一、创建Excel文件?
import pandas as pd
pf = pd.DataFrame()
pf.to_excel('D:/python_work/text1/d.xlsx')
print("Done!")
二、操作Excel文件?
1.往文件里写入数据:
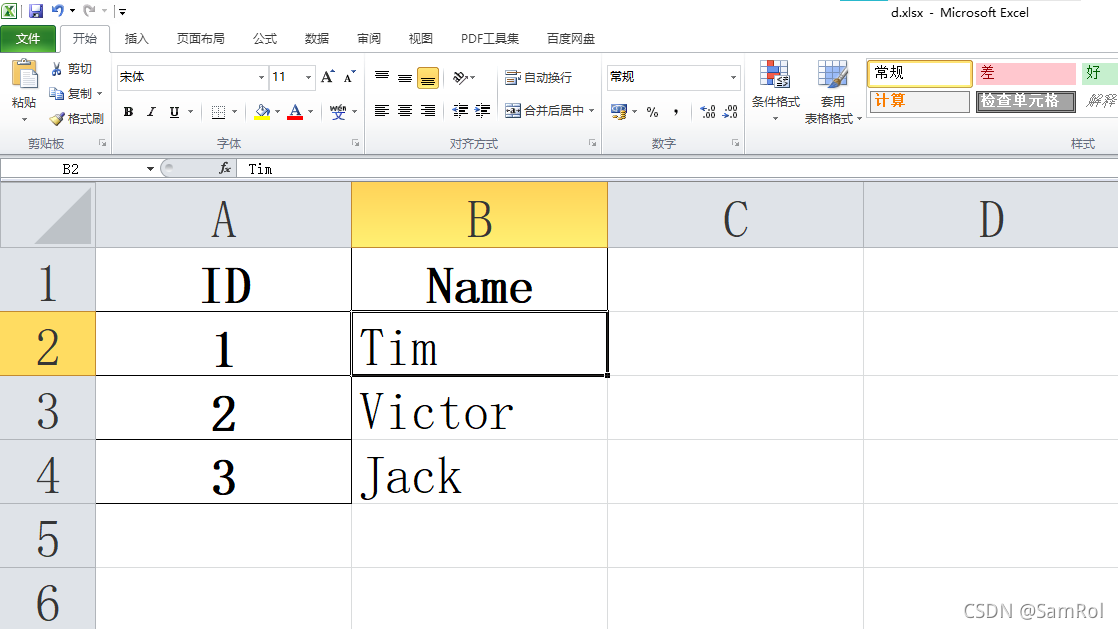
import pandas as pd
pf = pd.DataFrame({'ID':[1,2,3],'Name':['Tim','Victor','Jack']})
pf.set_index('ID', inplace = True)
pf.to_excel('D:/python_work/text1/d.xlsx')
print("Done!")
生成的文件:
?2.读写Excel文件:
import pandas as pd
pf = pd.read_excel('D:/python_work/text1/d.xlsx')3.查看行数和列数:
import pandas as pd
pf = pd.read_excel('D:/python_work/text1/d.xlsx')
print(pf.shape)#Here4.查看表头名:
import pandas as pd
pf = pd.read_excel('D:/python_work/text1/d.xlsx')
print(pf.columns)#Here5.查看“头”和“尾”数据
pf = pd.read_excel('D:/python_work/text1/d.xlsx')
print(pf.head(3))#3的意思是看前三行
print(pf.tail(3))#3的意思是看后三行6.设置开始读取行数位置
pf = pd.read_excel('D:/python_work/text1/d.xlsx', header=1)
#从excel的第二行开始读取7.手动设置列头
pf = pd.read_excel('D:/python_work/text1/d.xlsx', header=None)#把header设置为None
pf.columns = ['ID', 'Type','Title','FirstName']8.复制Excel表
pf = pd.read_excel('D:/python_work/text1/d.xlsx', index_col='ID')
#index_col的作用是设ID为第一个列头
pf.to_excel('D:/python_work/text1/d2.xlsx')9.通过Series创建行和列
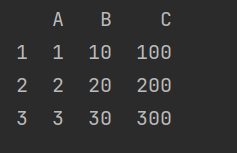
import pandas as pd
s1 = pd.Series([1,2,3], index=[1,2,3], name='A')#index设置的是行号
s2 = pd.Series([10,20,30], index=[1,2,3], name='B')
s3 = pd.Series([100,200,300], index=[1,2,3], name='C')
df = pd.DataFrame({s1.name:s1,s2.name:s2,s3.name:s3} )
print(df)
打印结果:
10.设置跳过读取的空行和设置读取范围内列,并指定列的数据类型
pf = pd.read_excel('D:/python_work/text1/d.xlsx',skiprows=3,usecols="C,F",index_col='ID',dtype={'ID':str})
#skiprows参数设置跳过行数,usecols设置读取的列标范围。11.设置列表的值
pf['ID'].at[0] = 100
#设置列头ID的第一行数据的值为10012.设置列表排序
pf = pd.read_excel('D:/python_work/text1/List.xlsx',index_col='ID')
pf.sort_values(by='Price', inplace=True, ascending=True)
#设置price列里的值从低到高排序
pf = pd.read_excel('D:/python_work/text1/List.xlsx',index_col='ID')
pf.sort_values(by='Price', inplace=True, ascending=False)
#ascending是上升的意思,所以设为False就为下降的意思,使price列里的值从高到低排序如果要排序两列需这样写:
pf = pd.read_excel('D:/python_work/text1/List.xlsx',index_col='ID')
pf.sort_values(by=['Worthy','Price'],inplace=True,ascending=[True,False])13.筛选和过滤
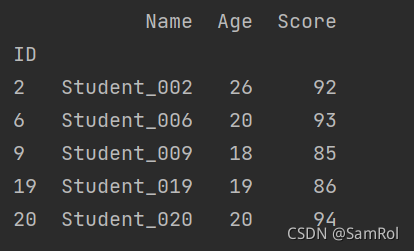
import pandas as pd
def age_18_to_30(a):
    return 18<=a<30
def leve_a(s):
    return 85<=s<=100
pf = pd.read_excel('D:/python_work/text1/Students.xlsx',index_col='ID')
pf = pf.loc[pf['Age'].apply(age_18_to_30)].loc[pf['Score'].apply(leve_a)]
或者用lambda写
pf = pd.read_excel('D:/python_work/text1/Students.xlsx',index_col='ID')
pf = pf.loc[pf['Age'].apply(lambda a:18<=a<30)].loc[pf['Score'].apply(lambda s:85<=s<=100)]
输出结果:?
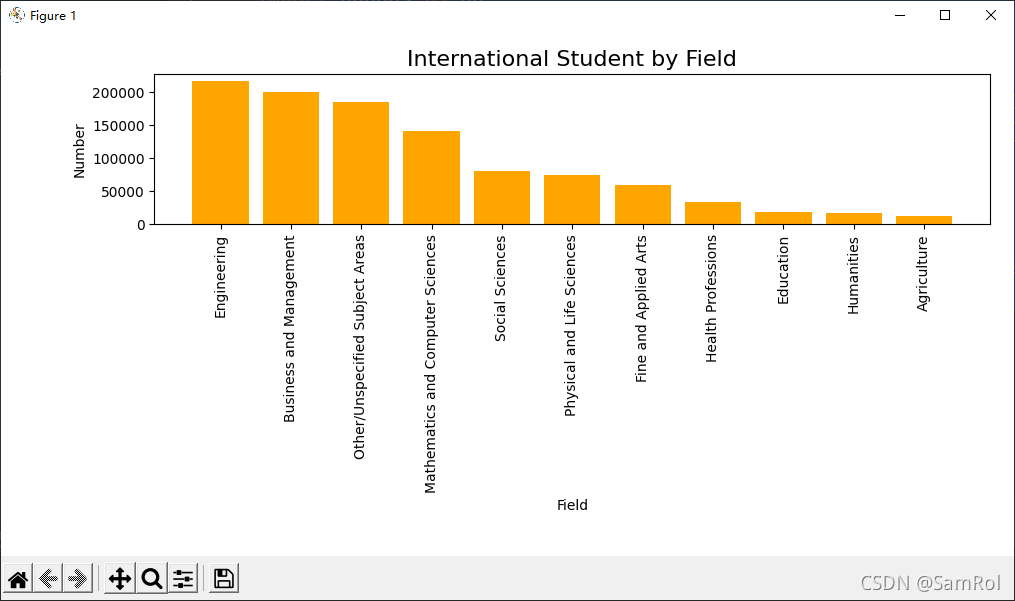
14.制图----柱状图
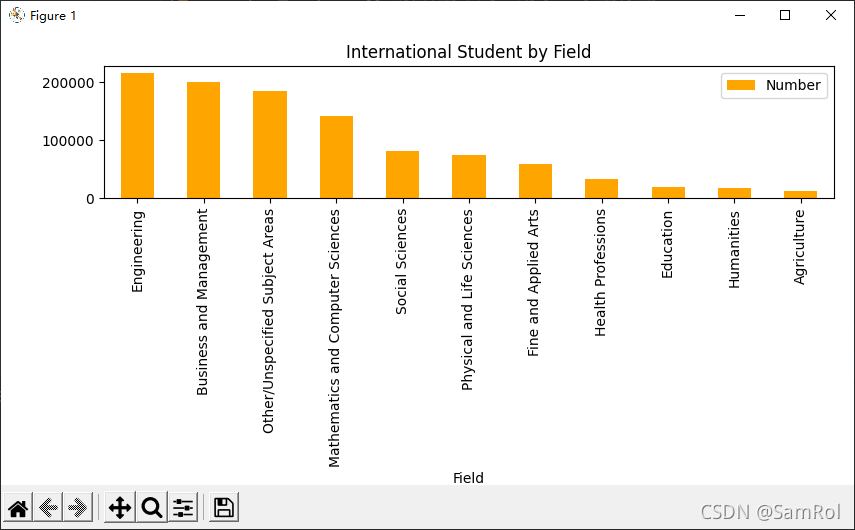
用pandas绘图
import pandas as pd
import matplotlib.pyplot as plt
pf = pd.read_excel('D:/python_work/text1/Students.xlsx')
pf.sort_values(by='Number', inplace=True,ascending=False)#从高到低排序
pf.plot.bar(x='Field', y='Number',color='orange',title='International Student by Field')#设计图表
plt.tight_layout()#紧凑型布局,用于显示全标签
plt.show()#显示图表
效果:
?用matplotlib绘图:
import pandas as pd
import matplotlib.pyplot as plt
pf = pd.read_excel('D:/python_work/text1/Students.xlsx')
pf.sort_values(by='Number', inplace=True,ascending=False)#从高到低排序
plt.bar(pf.Field,pf.Number,color='orange')#绘制图表x,y轴的内容,颜色为橙色
plt.xticks(pf.Field,rotation='90')#将Field的内容旋转90°
plt.xlabel('Field')#设置x轴标签
plt.ylabel('Number')#设置y轴标签
plt.title('International Student by Field',fontsize = 16)#设置标题且字号为16
plt.tight_layout()#紧凑型布局,用于显示全标签
plt.show()#显示图表
效果:
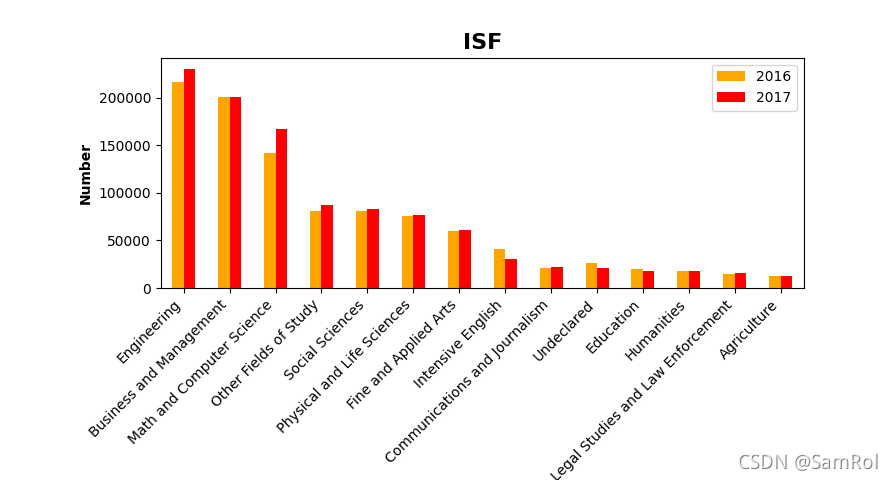
15.制图----分组柱状图?
?pandas和matplotlib相结合
import pandas as pd
import matplotlib.pyplot as plt
pf = pd.read_excel('D:/python_work/text1/Students.xlsx')
pf.sort_values(by='2017',inplace=True,ascending=False)#排序
pf.plot.bar(x='Field',y=['2016','2017'],color=['orange','red'])
plt.title('ISF',fontsize=16,fontweight='bold')
plt.xlabel('Field',fontweight='bold')
plt.ylabel('Number',fontweight='bold')
ax = plt.gca()#!!!获取轴上的内容!!!
ax.set_xticklabels(pf['Field'],rotation=45,ha='right')#编辑x轴上的内容,ha是设置旋转中心点
f = plt.gcf()#!!!获取图形!!!
f.subplots_adjust(left=0.18,bottom=0.4)#编辑图形的位置
plt.show()
效果:
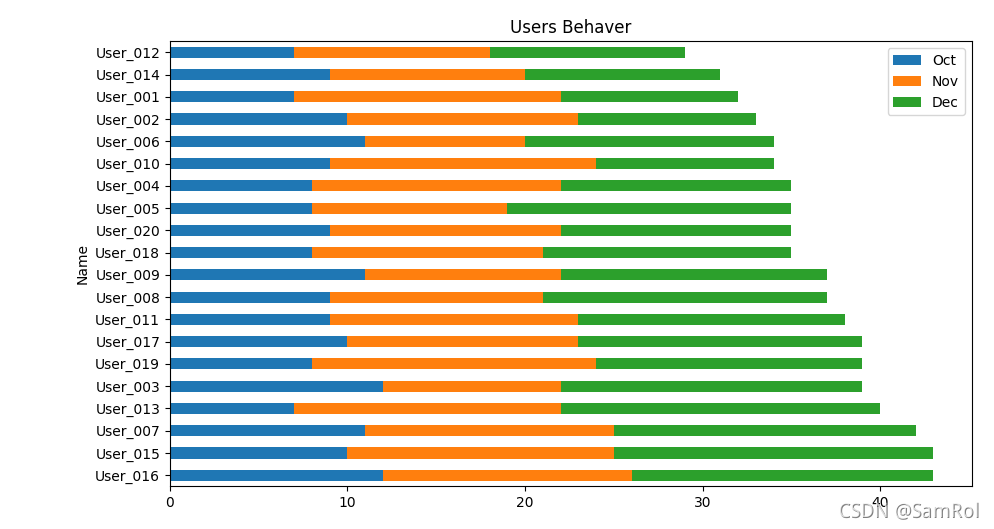
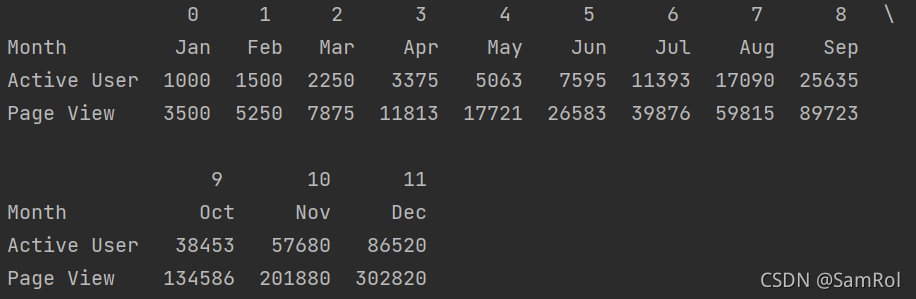
16.制图----叠加水平柱状图??
import pandas as pd
import matplotlib.pyplot as plt
pf = pd.read_excel('D:/python_work/text1/Users.xlsx')
pf['Total'] = pf['Oct']+pf['Nov']+pf['Dec']#增加一列
pf.sort_values(by='Total',inplace=True,ascending=False)
print(pf)
pf.plot.barh(x='Name',y=['Oct','Nov','Dec'],stacked=True,title='Users Behaver')
#barh水平柱状图,stacked用于叠加
plt.tight_layout()
plt.show()
效果:
17.制图----饼图??
import pandas as pd
import matplotlib.pyplot as plt
students = pd.read_excel('D:/python_work/text1/Students.xlsx',index_col='From')
print(students)
students['2017'].plot.pie(fontsize=8,counterclock=False,startangle =-270)
plt.title('Source of International Students', fontsize=16, fontweight='bold')
plt.ylabel('2017', fontsize=12,fontweight='bold')
plt.tight_layout()
plt.show()
效果:

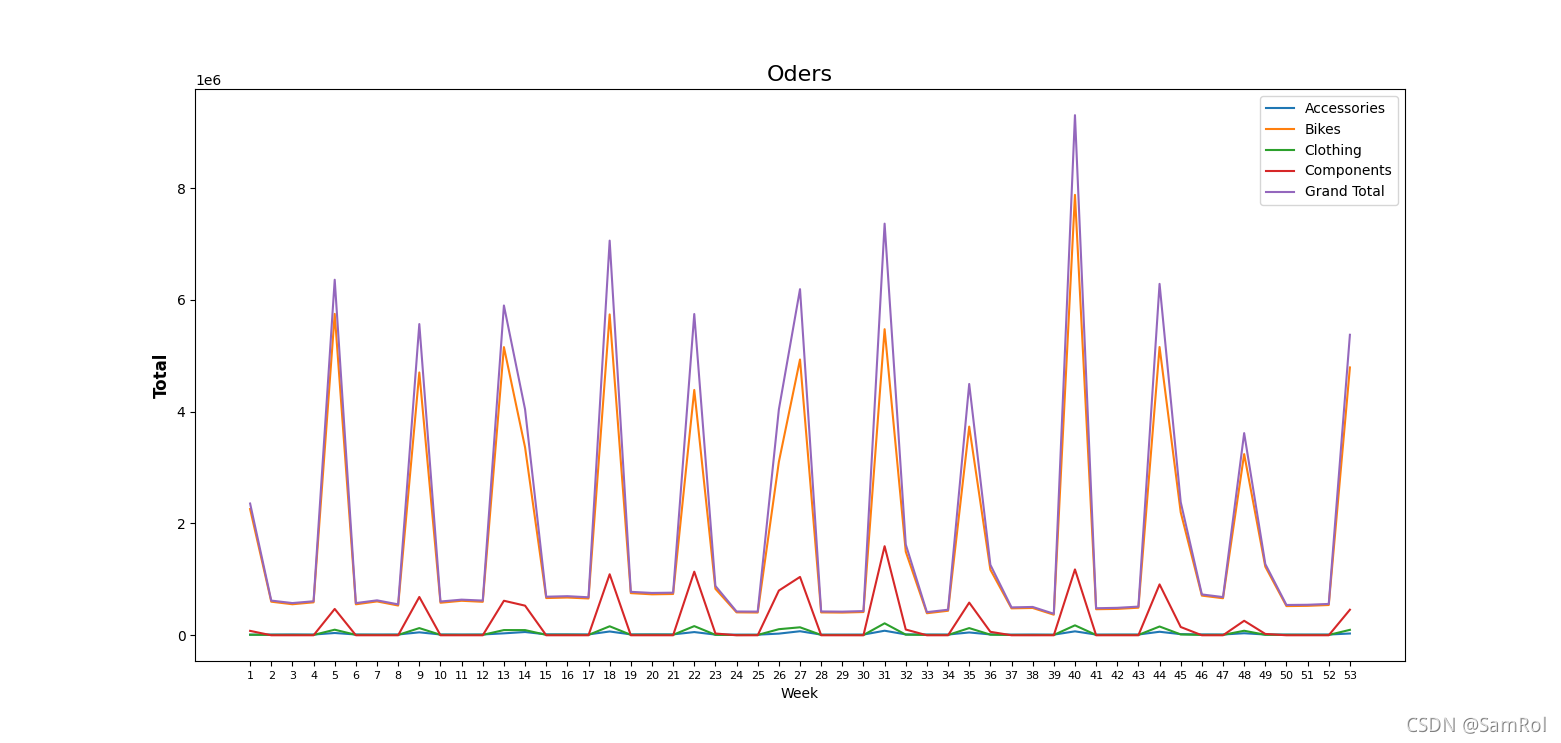
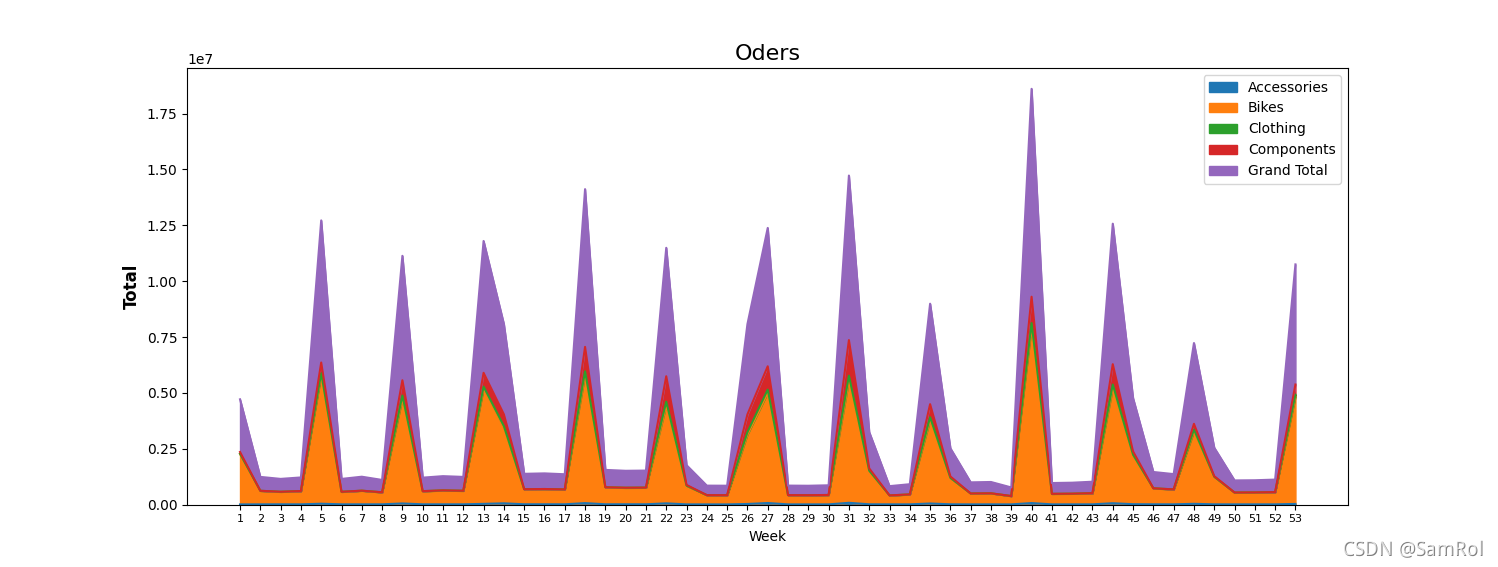
18.制图----折线图??
import pandas as pd
import matplotlib.pyplot as plt
users = pd.read_excel('D:/python_work/text1/Orders.xlsx',index_col='Week')
print(users)
print(users.columns)
users.plot(y=['Accessories', 'Bikes', 'Clothing', 'Components', 'Grand Total'])
plt.title('Oders',fontsize=16)
plt.ylabel('Total',fontsize=12,fontweight='bold')
plt.xticks(users.index,fontsize=8)#因为week转化为了index,所以.index,x轴更详细
plt.show()
效果:
users.plot.area(y=['Accessories', 'Bikes', 'Clothing', 'Components', 'Grand Total'])
#加上area
效果:
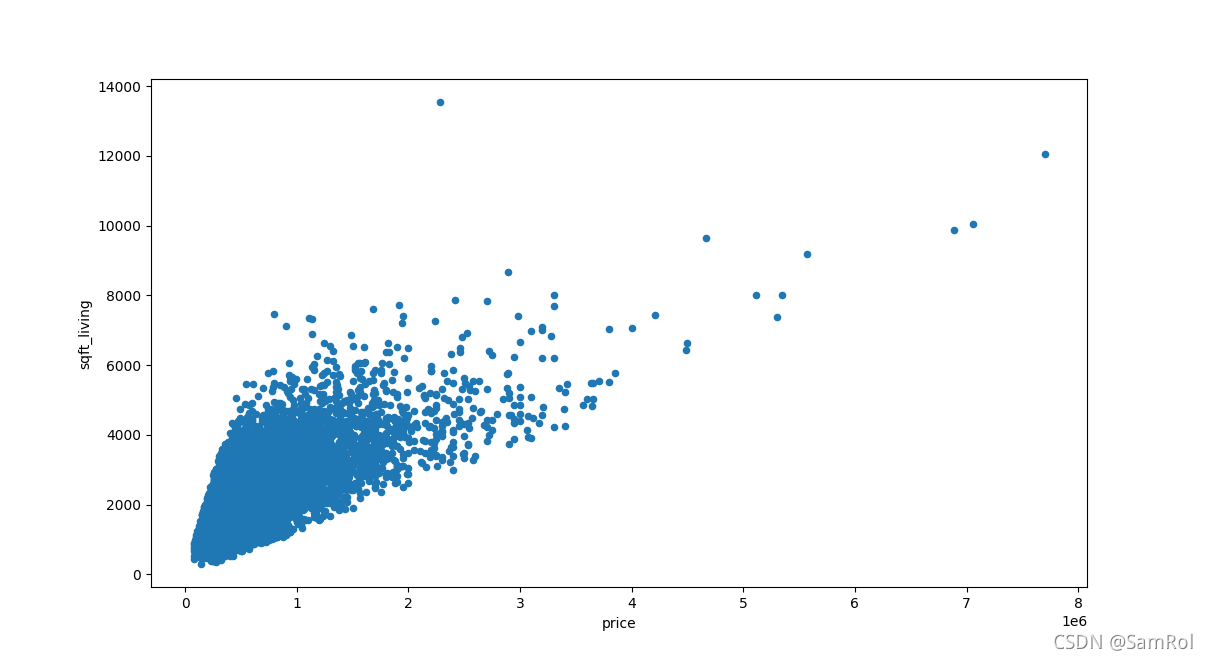
19.制图----散点图??
import pandas as pd
import matplotlib.pyplot as plt
pd.options.display.max_columns = 777 #显示所有列
homes = pd.read_excel('D:/python_work/text1/home_data.xlsx')
print(homes.head())
homes.plot.scatter(x='sqft_living', y='price')
plt.show()
效果:
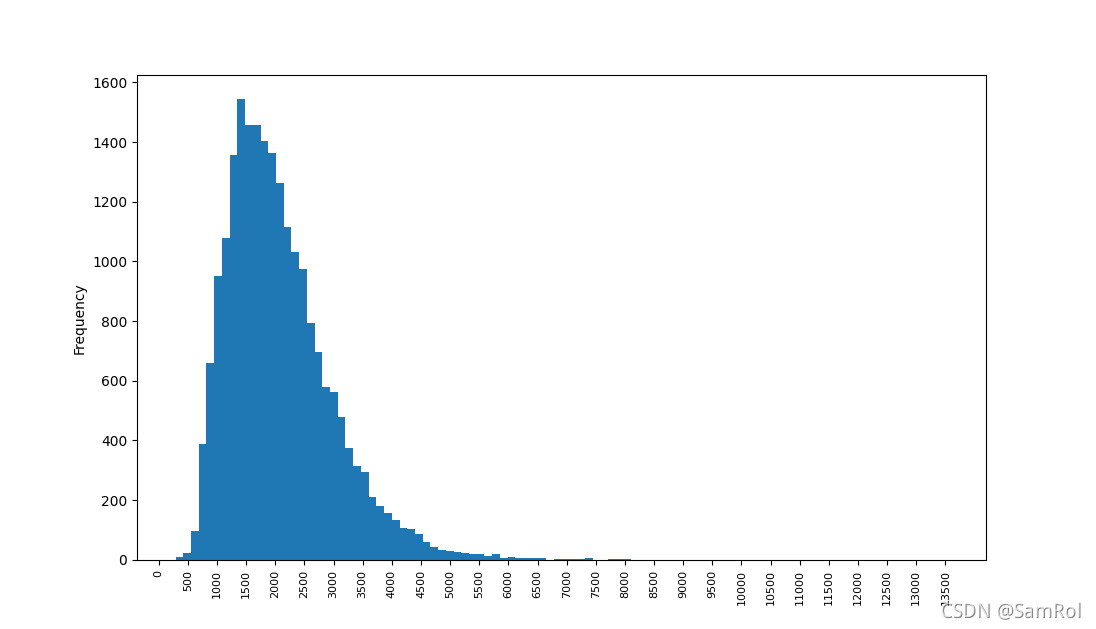
20.制图----直方图??
import pandas as pd
import matplotlib.pyplot as plt
pd.options.display.max_columns = 777 #显示所有列
homes = pd.read_excel('D:/python_work/text1/home_data.xlsx')
print(homes.head())
homes.sqft_living.plot.hist(bins=100)
plt.xticks(range(0,max(homes.sqft_living),500), fontsize=8,rotation=90)
plt.show()
效果:
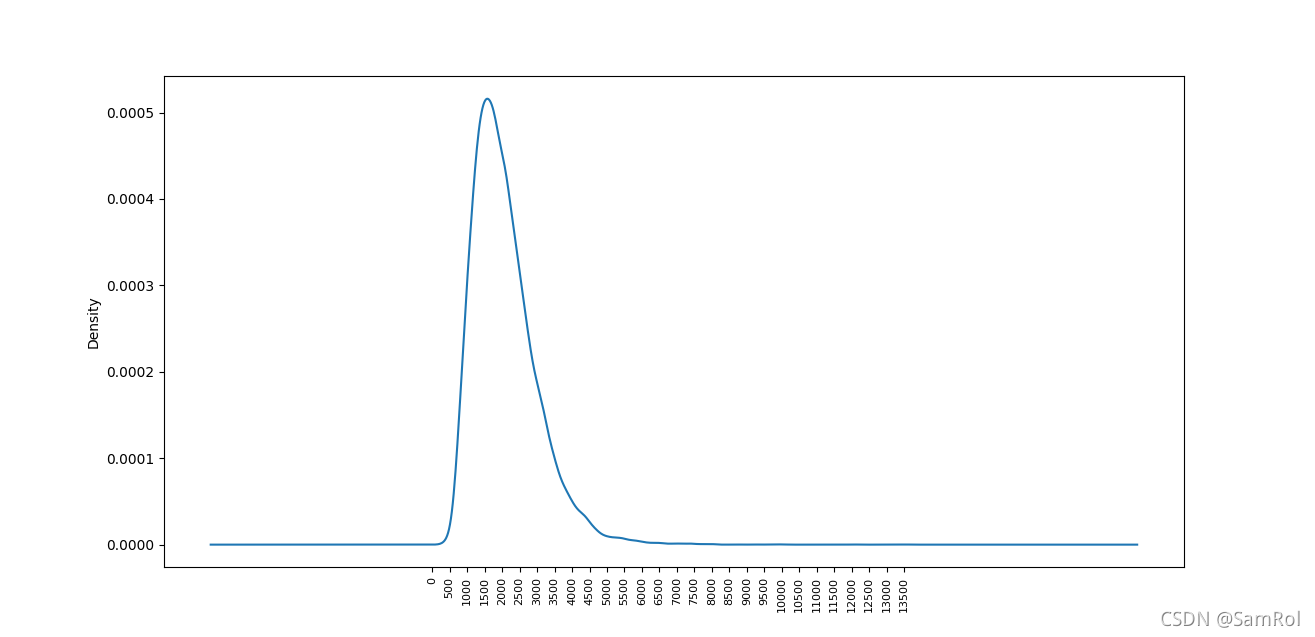
21.制图----密度图??
import pandas as pd
import matplotlib.pyplot as plt
pd.options.display.max_columns = 777 #显示所有列
homes = pd.read_excel('D:/python_work/text1/home_data.xlsx')
print(homes.head())
homes.sqft_living.plot.kde()
plt.xticks(range(0,max(homes.sqft_living),500), fontsize=8,rotation=90)
plt.show()
效果:
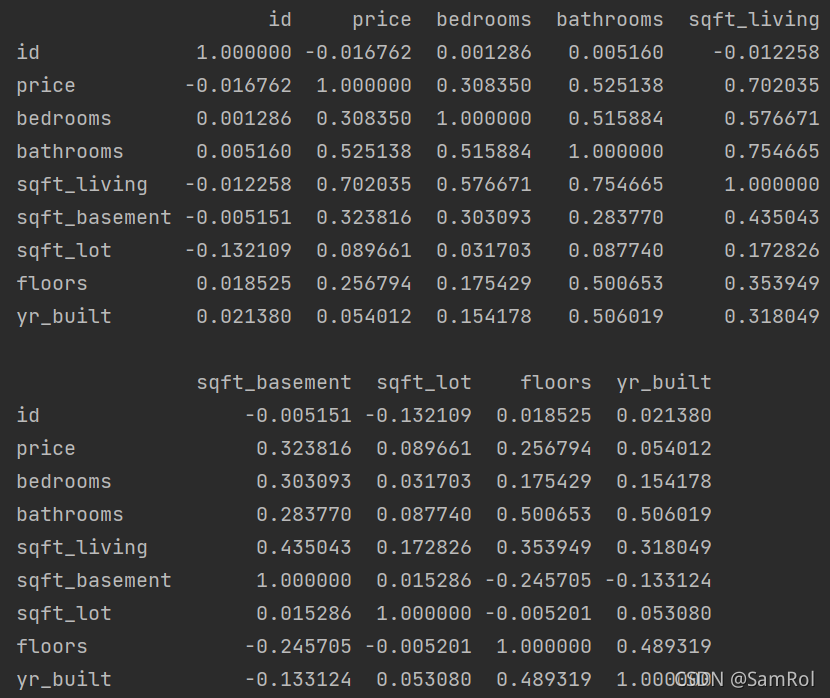
?22.分析数据的相关性corr():
import pandas as pd
import matplotlib.pyplot as plt
pd.options.display.max_columns = 777 #显示所有列
homes = pd.read_excel('D:/python_work/text1/home_data.xlsx')
print(homes.corr())
输出内容:
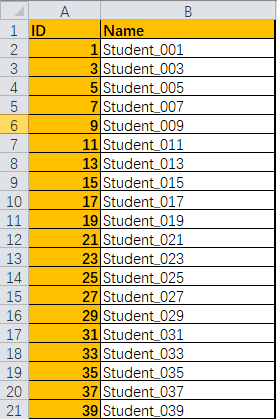
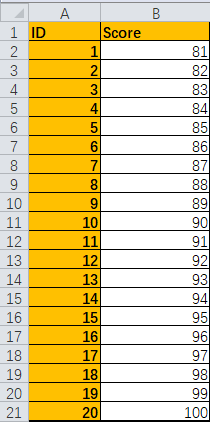
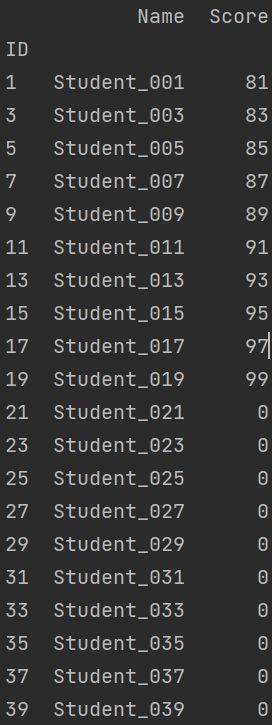
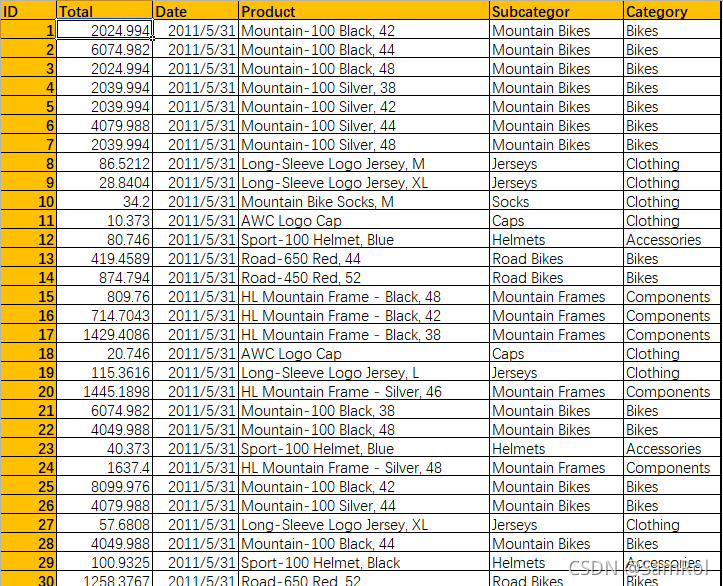
23.多表联合:
import pandas as pd
import matplotlib.pyplot as plt
students = pd.read_excel('D:/python_work/text1/Student_Score.xlsx', sheet_name='Students', index_col='ID')
scores = pd.read_excel('D:/python_work/text1/Student_Score.xlsx', sheet_name='Scores', index_col='ID')
table = students.join(scores, how='left').fillna(0)
# how参数:因为students先调用所以为左,左边的数据比右边多,默认情况下pandas会删除多出的部分,所以要用到'left'来保留多出的数据
table.Score = table.Score.astype(int)
print(table)
输出内容:
24.数据的校验:
import pandas as pd
def score_validation(row):
try:
assert 0<=row.Score<=100
except:
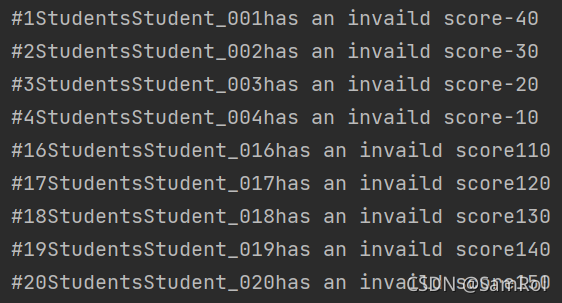
print(f'#{row.ID}Students{row.Name}has an invaild score{row.Score}')
students = pd.read_excel('D:/python_work/text1/Students.xlsx')
students.apply(score_validation, axis=1)#axis参数:0是从上到下,1是从左到右输出内容:
 ?
?
25.把一列数据分割成两列:
import pandas as pd
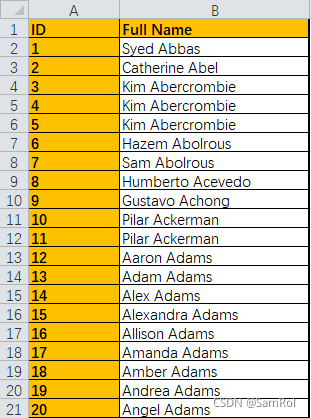
employees = pd.read_excel('D:/python_work/text1/Employees.xlsx',index_col='ID')
spl = employees['Full Name'].str.split(expand=True)
employees['FirstName'] = spl[0]
employees['LastName'] = spl[1]
print(employees)?输出内容:
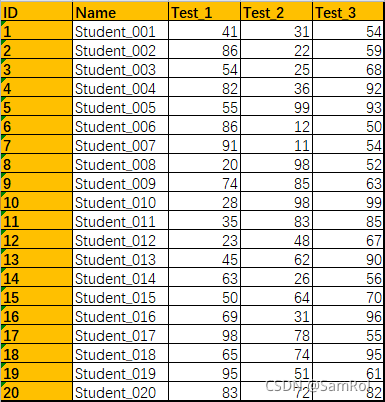
26.求和求平均统计:
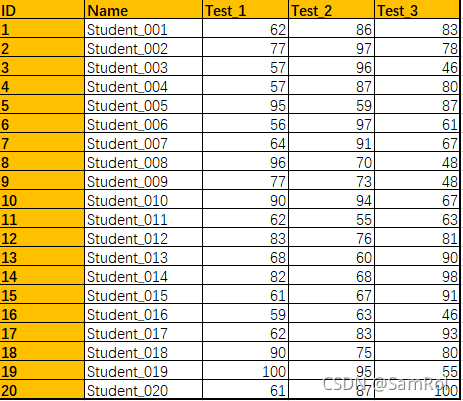
import pandas as pd
students = pd.read_excel('D:/python_work/text1/Students19.xlsx',index_col='ID')
temp = students[['Test_1','Test_2','Test_3']]
#每位学生的每一次测试的总成绩
students['Total'] = temp.sum(axis=1).astype(int)
#每位学生的每一次测试的总成绩的平均值,round用于保留两位小数
students['Average'] = round(temp.mean(axis=1).astype(float) ,2)
#每次测试的全班平均值
col_mean = students[['Test_1','Test_2','Test_3','Total','Average']].mean()
col_mean['Name'] = 'Summary'
#添加到students中
students = students.append(col_mean,ignore_index=True)
print(students)?输出内容:
 ?
?
27.定位清除重复数据:
定位清除数据:
import pandas as pd
students = pd.read_excel('D:/python_work/text1/Students_Duplicates.xlsx',index_col='ID')
students.drop_duplicates(subset='Name', inplace=True,keep='first')
#subset参数是定位重复内容所在的列,keep参数:first值是保留第一次重复出现的数据,last保留最后一次重复出现的数据
print(students)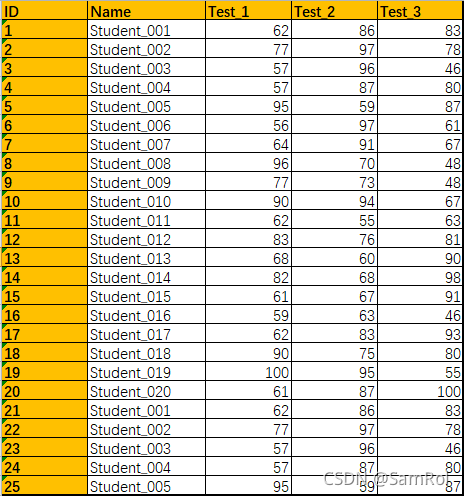
 ?
?
??扫描哪些行是重复的:
import pandas as pd
students = pd.read_excel('D:/python_work/text1/Students_Duplicates.xlsx',index_col='ID')
#扫描哪些行是重复的
dupe = students.duplicated(subset='Name')
print(dupe)
? ? ? ? ? ? ? ? ? ? ? ? ? ? ? ? ? ? ? ? ? ? ? ? ? ? ? ? ? ? ? ? ?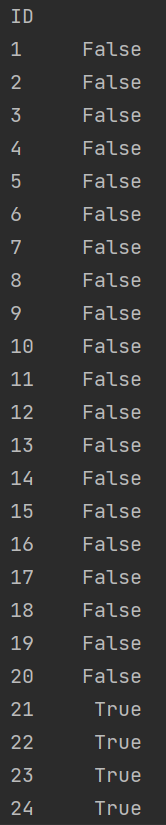
?抓取重复的数据:
import pandas as pd
students = pd.read_excel('D:/python_work/text1/Students_Duplicates.xlsx',index_col='ID')
#扫描哪些行是重复的
dupe = students.duplicated(subset='Name')
dupe = dupe[dupe == True]
print(students.loc[dupe.index])#loc[]用来定位
效果:
28.旋转数据表:
import pandas as pd
pd.options.display.max_columns = 999;
videos = pd.read_excel('D:/python_work/text1/Videos.xlsx')
table = videos.transpose()
print(table)
效果:
29.读取TXT、TSV、CSV的数据:
import pandas as pd
student1 = pd.read_csv('D:/python_work/text1/excle/Students022.csv', index_col='ID')
student2 = pd.read_csv('D:/python_work/text1/excle/Students022.tsv',sep='\t',index_col='ID')
student3 = pd.read_csv('D:/python_work/text1/excle/Students022.txt',sep='|',index_col='ID')
#sep参数是输入分割符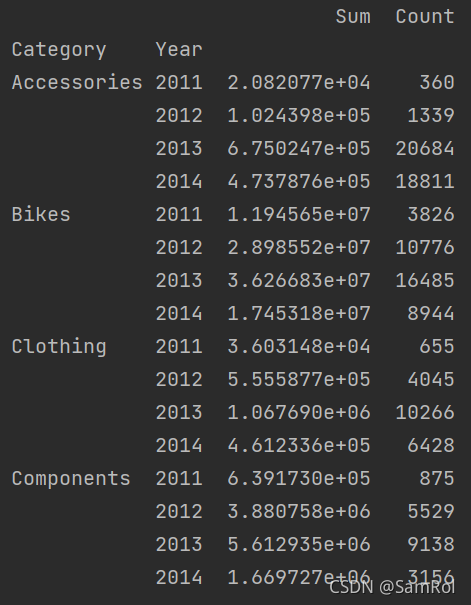
print(student2)30.透视表和数据聚合:
import pandas as pd
import numpy as np
pd.options.display.max_columns = 777
orders = pd.read_excel('D:/python_work/text1/excle/Orders023.xlsx')
orders['Year'] = pd.DatetimeIndex(orders['Date']).year
pt1 = orders.pivot_table(index='Category', columns='Year', values='Total', aggfunc=np.sum)
print(pt1)
import pandas as pd
pd.options.display.max_columns = 777
orders = pd.read_excel('D:/python_work/text1/excle/Orders023.xlsx')
orders['Year'] = pd.DatetimeIndex(orders['Date']).year
groups = orders.groupby(['Category', 'Year'])
s = groups['Total'].sum()
c = groups['ID'].count()
pt = pd.DataFrame({'Sum':s,'Count':c})
print(pt)效果:
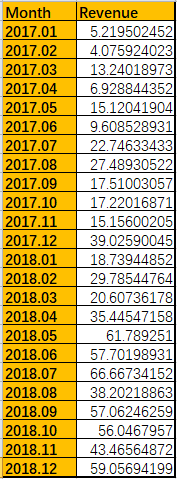
31.制图----线性回归、数据预测??:
import pandas as pd
import matplotlib.pyplot as plt
from scipy.stats import linregress
pd.options.display.max_columns = 777
sales = pd.read_excel('D:/python_work/text1/excle/Sales.xlsx',dtype={'Month':str})
slope, intercept, r,p,std_err = linregress(sales.index,sales.Revenue)
#斜率,y轴上的截距,    标准差
exp = sales.index*slope + intercept#期望值
plt.scatter(sales.index, sales.Revenue)
plt.plot(sales.index,exp,color='orange')
plt.title(f"y={slope}*X+{intercept}")
plt.xticks(sales.index, sales.Month, rotation=90)
plt.tight_layout()
plt.show()
效果:
 ?
?
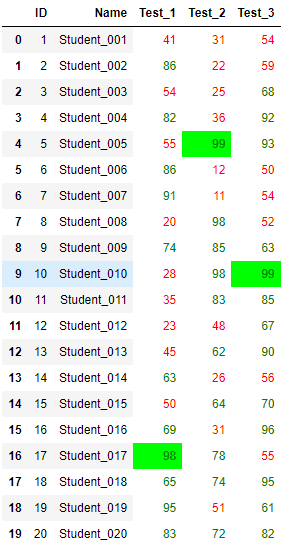
?32.给表格添加格式:
需要用到Jupyter Notebook
import pandas as pd
def low_score_red(s):
    color = 'red' if s<60 else 'green'
    return f'color:{color}'
def hight_score_green(col):
    return ['background-color:lime' if s==col.max() else 'background-color:white'for s in col]
students = pd.read_excel('D:/python_work/text1/excle/Students.xlsx')
students.style.applymap(low_score_red, subset=['Test_1', 'Test_2', 'Test_3']).apply(hight_score_green, subset=['Test_1', 'Test_2', 'Test_3'])
#applymap()是应用到数据的区域,apply()是应用到列或者行
效果:
import pandas as pd
students = pd.read_excel('D:/python_work/text1/excle/Students.xlsx')
students.style.bar(color='orange', subset=['Test_1','Test_2','Test_3'])
?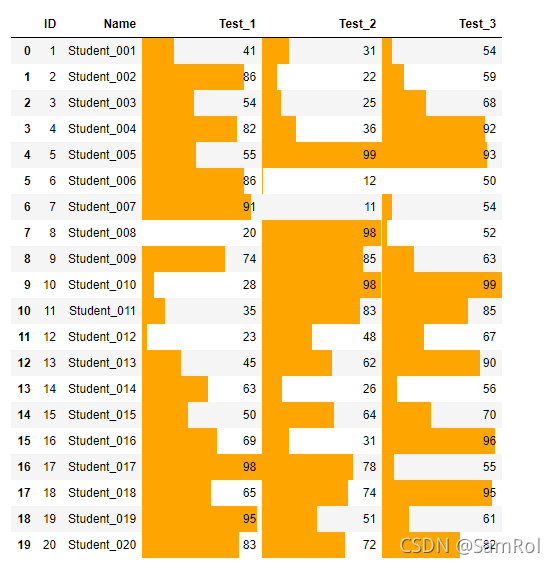
?33.尾部追加表格、插入表格: