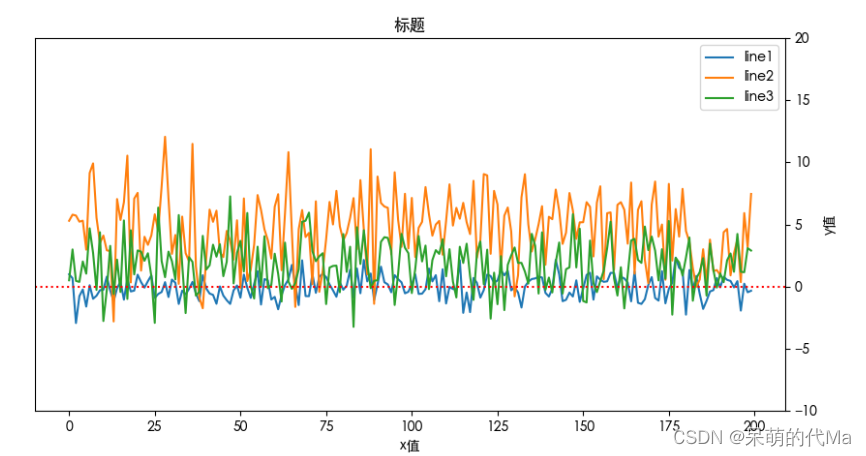
以往都是使用plt,但是在多子图绘制时总是需要ax,所以这篇博客使用一个案例来练习ax绘图
matplotlib使用plt绘图可以参考:Matplotlib 整合与细节操作(样式、图例、风格、轴线、网格)

使用ax绘图时,有时需要魔改一些内容,就与plt的api不一样:
    # 设置标题
    ax.title.set_text("我是标题")

    # 坐标轴右移
    ax.yaxis.set_ticks_position('right')

    # y轴label右移
    ax.yaxis.set_label_position("right")

	# 设置y轴的label(可以参考上图的释义)
	ax.set_ylabel("y值")

	# 设置x轴label
    ax.set_xlabel("x值")

	# 设置y轴的取值范围
	ax.set_ylim(-10, 20)  # 设置y轴的区间
代码示例
import matplotlib.pyplot as plt
import pandas as pd
import matplotlib.gridspec as gridspec  # 用网格来创建子图
import matplotlib as mpl
import numpy as np

mpl.rcParams['font.family'] = ['Heiti TC']


def draw_form_df(dataframe: pd.DataFrame, title_name: str) -> plt.Figure:
    """绘制dataframe的正式的图"""
    fig = plt.figure(figsize=(10, 5))  # 指定画布大小
    grid = gridspec.GridSpec(1, 1)  # 指定这个画布上就一个图
    # 绘制价格走势图
    ax = fig.add_subplot(grid[0, 0])  # 多子图时可以修改
    for index, line_value in dataframe.iterrows():
        ax.plot(list(range(dataframe.shape[1])), line_value.values, label=index)
    ax.axhline(y=0, ls=":", c="red")  # 在y=0这里添加辅助线
    ax.set_ylim(-10, 20)  # 设置y轴的区间
    # 标题
    ax.title.set_text(title_name)
    # 坐标轴右移
    ax.yaxis.set_ticks_position('right')
    # label右移
    ax.yaxis.set_label_position("right")
    ax.set_ylabel("y值")
    ax.set_xlabel("x值")
    ax.legend()  # 显示图例
    # fig.subplots_adjust(top=0.90) # 多图时适应尺寸
    return fig


if __name__ == '__main__':
    df = pd.DataFrame(
        data=[np.random.normal(0, 1, 200),
              np.random.normal(5, 3, 200),
              np.random.normal(2, 2, 200)], index=['line1', 'line2', 'line3'])
    fig = draw_form_df(df, "标题")
    fig.show()
效果图:
