前言
(个人学习笔记,供学习参考,如有不足之处,还请大佬们批评指正!!)
theme() 的语法有自己的一套风格,我感觉和ggplot2总体的风格类似,个人理解:它是针对图像的不同层次命名函数,并进行修改,并且后边的设置可以覆盖前面的设置,例子应该更能形象生动的展现。
在上一篇ggplot2-概述学习的结尾,也有讲到一部分theme的理解~:
【R语言-ggplot2学习-概览】
接下来跟着官方帮助文档学一些基本的。
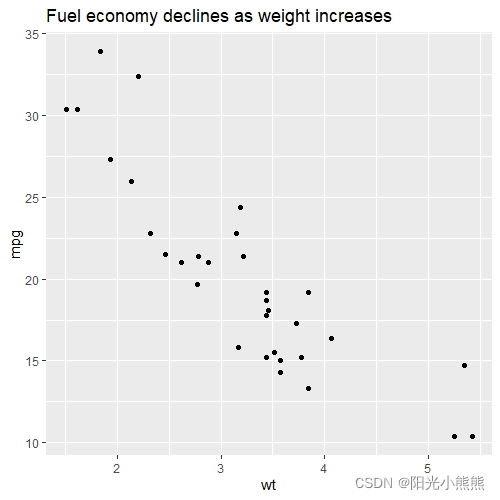
先来画一个原始的散点图:
p1 <- ggplot(mtcars, aes(wt, mpg)) +
  geom_point() +
  labs(title = "Fuel economy declines as weight increases")
p1

theme - 总体参数类型
以下是对图像整体的元素进行修改的参数,再细节一个层次的参数又主要分为3种:element_line;element_rect;element_text
line
all line elements (element_line())
rect
all rectangular elements (element_rect())
text
all text elements (element_text())
title
all title elements: plot, axes, legends (element_text(); inherits from text)
aspect.ratio
aspect ratio of the panel
例子:
p1 + theme(line = element_line(size = 1,linetype = 2,color = "black"))
改变网格线类型、大小,但不知道为什么,不能改变颜色。

p1 + theme(rect = element_rect(fill = "blue",color = "red",linetype = 2))

p1 + theme(text = element_text(colour = "red",size = 12,angle = 3))#设置大小、角度、颜色

p1 + theme(title = element_text(colour = "red",size = 10,angle = 2))
这个结果和上一条命令相似

p1 + theme(aspect.ratio = 1.5)

改变图像的长宽比,这个还是比较有用的!
theme - plot
以整幅图像为对象进行参数设置,不过只能调整,不能对没有的元素进行添加,添加元素使用其他命令。调整的主要也是字体大小颜色、位置、对齐等这些方面。
theme里头这类的参数有:
plot.background,
plot.title,
plot.title.position,
plot.subtitle,
plot.caption,
plot.caption.position,
plot.tag,
plot.tag.position,
plot.margin,
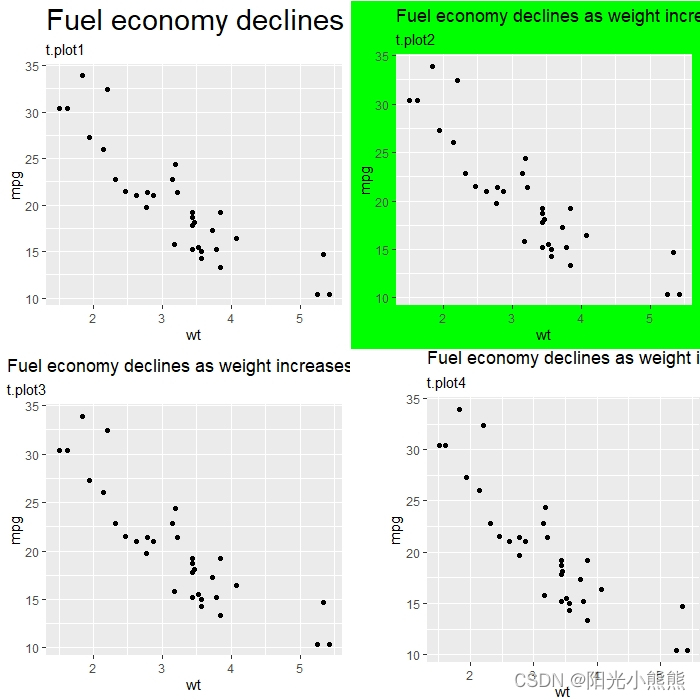
尝试4个参设设置:
t.plot1<-p1 + labs(subtitle = "t.plot1")+
  theme(plot.title = element_text(size = rel(2)))
#标题的字体大小变成原来的两倍
t.plot2<-p1 + labs(subtitle = "t.plot2")+
  theme(plot.background = element_rect(fill = "green"))
#图的外边的背景填充,不包括数据部分,包括轴标签刻度、标题这些
t.plot3<-p1 + labs(subtitle = "t.plot3")+
  theme(plot.title.position = "plot")
#向哪对齐,都是左对齐,以plot边界对齐
t.plot4<-p1  + labs(subtitle = "t.plot4")+
  theme(plot.margin = margin(t = 0,r = 0,b = 0,l = 1,unit = "cm"))
#以整幅图为对象的四周空白,左边缩进1cm
grid.arrange(t.plot1,t.plot2,t.plot3,t.plot4,ncol = 2)

theme - Panels
首先来一个实用技能!默认的灰色的背景个人觉得还是挺难看的,不知道为什么要选灰色作为默认的背景,不过都是可以修改哒!
p1 + theme(panel.background = element_rect(fill = "white", colour = "blue"))
#图里边的背景变成白色,边界变成蓝色

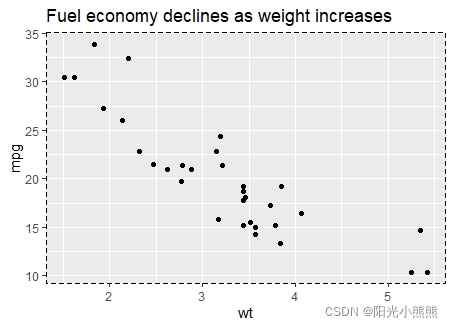
p1 + theme(panel.border = element_rect(linetype = "dashed", fill = NA))
#边界线形改成虚线

同理,linetype = “solid”,就可以改成实线。
p1 + theme(panel.grid.major = element_line(colour = "black"))
#主要网格线

p1 + theme(
  panel.grid.major.y = element_blank(),
  panel.grid.minor.y = element_blank(),
  panel.grid.major.x = element_blank(),
  panel.grid.minor.x = element_blank()
)
#x,y轴的网格线都不要

# Put gridlines on top of data
p1 + theme(
  panel.background = element_rect(fill = NA),
  panel.grid.major = element_line(colour = "grey50"),
  panel.ontop = T
)
网格线置于数据上方。

theme - axis
可以设置横纵坐标轴的刻度线、文本进行系列设置,包括大小、长度、颜色等。一张一张图地放有点累啊,还是就把代码和注释放着就好了。
举例比如说把刻度线长度设为0,等同于把刻度取消掉的效果,画图的时候有可能用上。
# Change styles of axes texts and lines
p1
p1 + theme(axis.line = element_line(size = 3, colour = "grey80"))
#轴坐标的线型和颜色调整
p1 + theme(axis.line = element_line(size = 1,colour = "black"))

p1 + theme(axis.text = element_text(colour = "blue"))
#刻度的值的颜色
p1 + theme(axis.ticks = element_line(size = 2))
#刻度的形状大小
# Change the appearance of the y-axis title
p1 + theme(axis.title.y = element_text(size = rel(1.5), angle = 90))
#y轴的标签变大
# Make ticks point outwards on y-axis and inwards on x-axis
p1 + theme(
  axis.ticks.length.y = unit(.25, "cm"),
  axis.ticks.length.x = unit(-.25, "cm"),#往里
  axis.text.x = element_text(margin = margin(t = .3, unit = "cm"))
)
#xy轴刻度-ticks的方向,长度,页边空白-margin
ttitle - legend
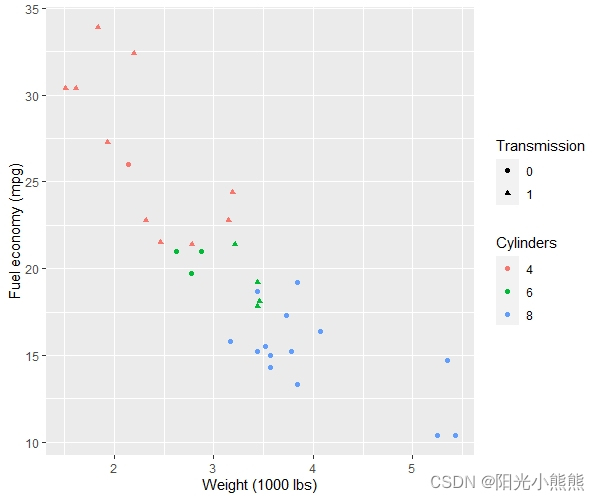
要展示图例的设置,需要另画一张图了。
p2 <- ggplot(mtcars, aes(wt, mpg)) +
  geom_point(aes(colour = factor(cyl), shape = factor(vs))) +#可以在点的维度上设置因子
  labs(
    x = "Weight (1000 lbs)",
    y = "Fuel economy (mpg)",
    colour = "Cylinders",#设置相应的图例标题
    shape = "Transmission"
  )
p2

# Position
p2 + theme(legend.position = "none")#删去所有图例
p2 + theme(legend.justification = "top")#右上角对齐
p2 + theme(legend.position = "bottom")

# Or place legends inside the plot using relative coordinates between 0 and 1
# legend.justification sets the corner that the position refers to
p2 + theme(
  legend.position = c(.95, .95),#相对于左边下边的位置,0-1
  legend.justification = c("right", "top"),
  legend.box.just = "right",#边框右边对齐
  legend.margin = margin(0, 6, 6, 6)#图例和图例边框之间的空白大小
)

# The legend.box properties work similarly for the space around
# all the legends
p2 + theme(
  legend.box.background = element_rect(color= NA),#不要边框的颜色
  legend.box.margin = margin(6, 6, 6, 0)#四周的空白大小
)

# You can also control the display of the keys
# and the justification related to the plot area can be set
p2 + theme(legend.key = element_rect(fill = "white", colour = "black"))
#图例的背景和边框,那个图形
p2 + theme(legend.text = element_text(size = 8, colour = "red"))
#图例标签的修改,内容能修改吗?貌似不行,只能给分类的因子标好labels
p2 + theme(legend.title = element_text(face = "bold"))
#图例标题的字体
title - Strips
接下来是有关分面之后的设置
p3 <- ggplot(mtcars, aes(wt, mpg)) +
  geom_point() +
  facet_wrap(~ cyl)
p3
#分面

p3 + theme(strip.background = element_rect(colour = "black", fill = "white"))
#分面的那个小框框背景和边框
p3 + theme(strip.text.x = element_text(colour = "white", face = "bold"))
#小框框里边字的颜色
p3 + theme(panel.spacing = unit(1, "lines"))
#分面的距离和形状
好啦,总体上的theme参数设置就这些啦,虽然还有些问题,之后的学习还是以问题为导向吧,需要对图形进行某种类型的设计的时候再来翻翻看搜搜看。(因为细节实在是好多啊呜呜呜)
如果学习笔记对屏幕前的你有那么一点帮助,点个赞鼓励一下哇! ^ _ ^