UDST下初探pandana
1、Pandana是什么,干什么用
Pandana 是一个用于网络分析的 Python 库,它使用收缩层次结构来超快速计算,可达性指标和最短路径。数字代码在 C++ 中。
收缩层次结构:一种预先计内存的方法,可以加快模型中最短\最佳路径的计算
安装
Pandana 是一个 Python 包,其中包含用于数值运算的 C++ 扩展。
标准安装
截至 2021 年 3 月,通过 PyPI 和 Conda Forge 为 Mac、Linux 和 Windows 提供二进制安装程序。
您可以使用 Pip 安装 Pandana:
pip install pandana
或conda:
conda install pandana --channel conda-forge
Pandana 最容易在 Python 3.6 到 3.9 中安装。带有 Python 2.7 二进制文件的 Pandana 的最后一个版本是 Conda Forge 上的 v0.4.4。Python 3.5 二进制文件的最后一个版本是 Pip 上的 v0.6。
1.2编译条件
Mac 用户应首先运行以确保您拥有 Apple 的 Xcode 命令行工具,这些工具在幕后是必需的。
Windows 用户将需要Microsoft Visual C++ Build Tools。
Pandana 的构建时要求是cython、numpy和支持 C++11 标准的 C++ 编译器。此外,编译器需要支持 OpenMP 以允许 Pandana 使用多线程。
针对MAC:
建议安装途径是从 Conda Forge 获取编译器——你需要clang和llvm-openmp包。
运行 Pandana 的设置脚本将触发编译:
conda install cython numpy clang llvm-openmp
python setup.py develop
(windows可跳过)
Mac 上的默认 C++ 编译器不支持 OpenMP,这意味着 Pandana 将无法使用多线程。
您可以设置CC环境变量以指定您选择的编译器。如果需要进行额外修改,可以在本地副本中编辑编译脚本setup.py。
多线程
您可以设置CC环境变量以指定您选择的编译器。有关此问题的讨论,请参阅PR #137中的文章。如果需要进行额外修改,可以在本地副本中编辑编译脚本setup.py。
2、Pandana官方简单例子
先上链接:https://github.com/UDST/pandana/blob/dev/examples/Pandana-demo.ipynb
此例子主要用来展示Pandana library:
Pandana library是一个用于网络分析的Python包,它使用收缩层次结构来计算超快速旅行可达性指标和最短路径。
Sections
- Loading data
- Shortest paths
- Proximity
- Accessibility
- Visualization
建议在本地vscode下部署
首先导入pandana包并显示其版本
import numpy as np
import pandas as pd

import pandana
print(pandana.__version__)
设置浮点数输出格式为两位小数,更多理解详见https://blog.csdn.net/S_o_l_o_n/article/details/106418441
pd.options.display.float_format = '{:.2f}'.format
2.1 Loading data
此处所用为pandana的一个包OSMnet,用于提取OpenStreetMap(OSM)街道网络数据的工具
conda安装osmnet或pip安装osmnet
from pandana.loaders import osm
import warnings
warnings.filterwarnings('ignore')
获取San Francisco, CA的数据
network = osm.pdna_network_from_bbox(37.698, -122.517, 37.819, -122.354) # San Francisco, CA
注:若此处报错,说明没有成功导入osm包,解决方法详见

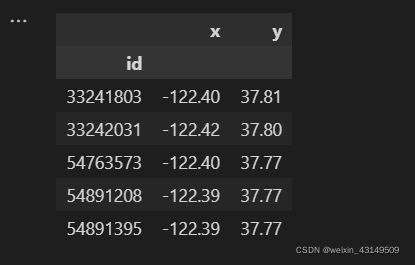
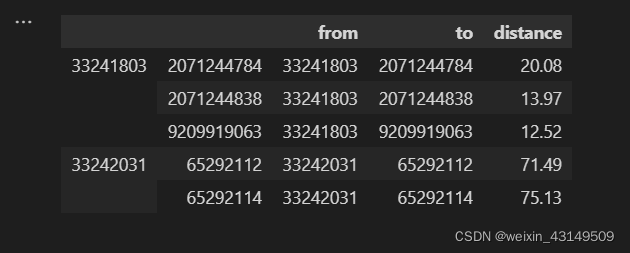
边和节点作为数据帧可见。
network.nodes_df.head()
节点中通过经纬度及id确定位置
边通过节点展现
network.edges_df.head()
保存和重新加载网络
不能直接保存Pandana网络对象,但可以轻松地从节点和边重新创建它。
network.nodes_df.to_csv('nodes.csv')
network.edges_df.to_csv('edges.csv')
nodes = pd.read_csv('nodes.csv', index_col=0)
edges = pd.read_csv('edges.csv', index_col=[0,1])
network = pandana.Network(nodes['x'], nodes['y'],
                          edges['from'], edges['to'], edges[['distance']])
2.2最短路径
该例中以餐厅作为展示,通过加载Open Street Map上列出的餐厅位置(使用与上面相同的OSMnet扩展),然后计算它们之间的一些最短路径。
restaurants = osm.node_query(
    37.698, -122.517, 37.819, -122.354, tags='"amenity"="restaurant"')
res = restaurants.sample(2)//随机展示两个餐厅
res

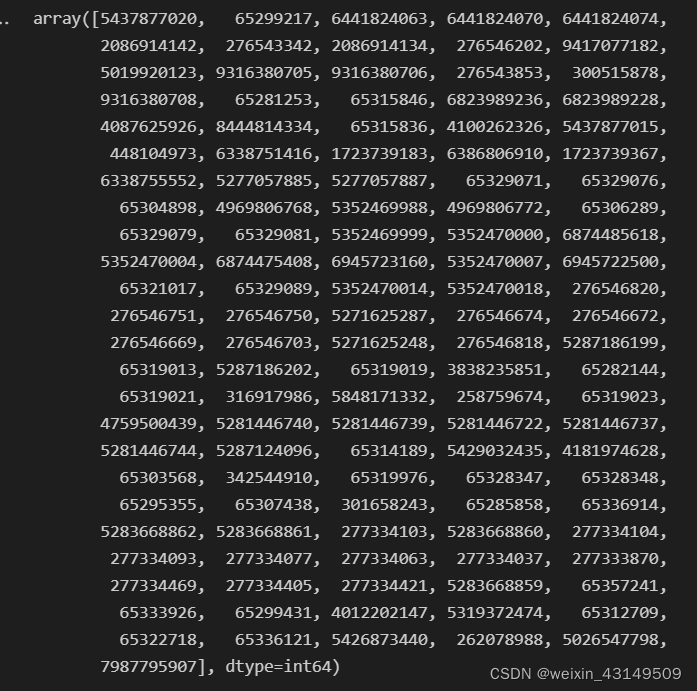
首先,确定距离每个餐厅最近的节点。然后获取节点之间的路由。这个网络的距离单位是米。
nodes = network.get_node_ids(res.lon, res.lat).values//输入两个
nodes
network.shortest_path()//返回最短路径经过的结点
network.shortest_path_length(nodes[0], nodes[1])//计算两点间长度
//Pandana可以在不到一分钟内生成数百万条最短路径。

计算所有的餐厅最短路径
restaurant_nodes = network.get_node_ids(restaurants.lon, restaurants.lat).values
origs = [o for o in restaurant_nodes for d in restaurant_nodes]
dests = [d for o in restaurant_nodes for d in restaurant_nodes]
%%time
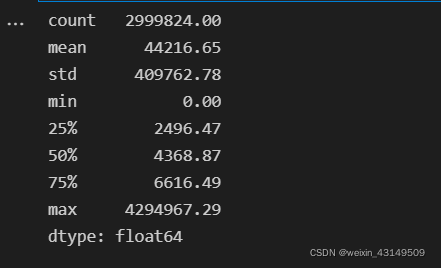
distances = network.shortest_path_lengths(origs, dests)

pd.Series(distances).describe()//展示各种数据
2.3 Proximity
为了找到某一点最近的餐厅:
首先将餐厅添加进网络中
network.set_pois(category = 'restaurants',
                 maxdist = 1000,//设置的最大距离
                 maxitems = 3,//设置的最大数目
                 x_col = restaurants.lon,
                 y_col = restaurants.lat)
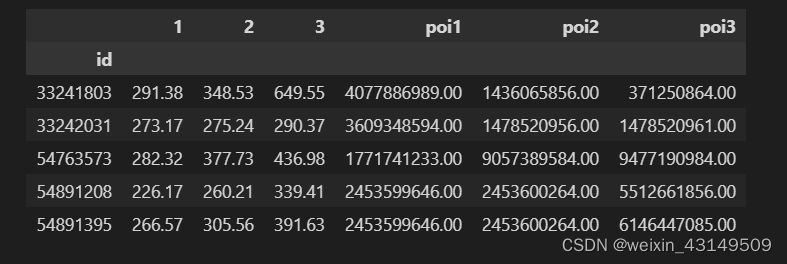
此时就可以进行查询了
results = network.nearest_pois(distance = 1000,//寻找 POI 的最大距离。
                               category = 'restaurants',
                               num_pois = 3,//要查找的 POI 的数量
                               include_poi_ids = True//如果此标志设置为 true,则调用将向返回 DataFrame 添加列 - 而不是仅返回第 n 个 POI 的距离,它还将返回该 POI 的 id。)
results.head()
2.4 Accessibility
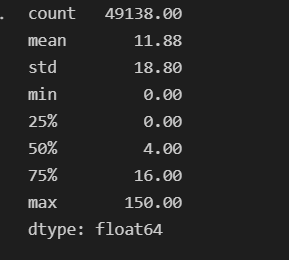
为了找到任意一个节点任意范围(例子为500米)内所有餐厅。Pananda称这种计算为聚合。
还是先录入网络中
restaurant_nodes = network.get_node_ids(restaurants.lon, restaurants.lat)
network.set(restaurant_nodes,
            name = 'restaurants')
network.aggregate()
各种数据的展现
accessibility = network.aggregate(distance = 500,
                                  type = 'count',
                                  name = 'restaurants')
accessibility.describe()
2.5.Visualization
直接使用Matplotlib,绘制餐厅可视化地图
import matplotlib
from matplotlib import pyplot as plt
print(matplotlib.__version__)


fig, ax = plt.subplots(figsize=(10,8))
plt.title('San Francisco: Restaurants within 500m')
plt.scatter(network.nodes_df.x, network.nodes_df.y,
            c=accessibility, s=1, cmap='YlOrRd',
            norm=matplotlib.colors.LogNorm())
cb = plt.colorbar()

plt.show()
放一个函数的用法:plt.scatter()

至此,官方给我们展示的内容就结束了,继续学习upup!