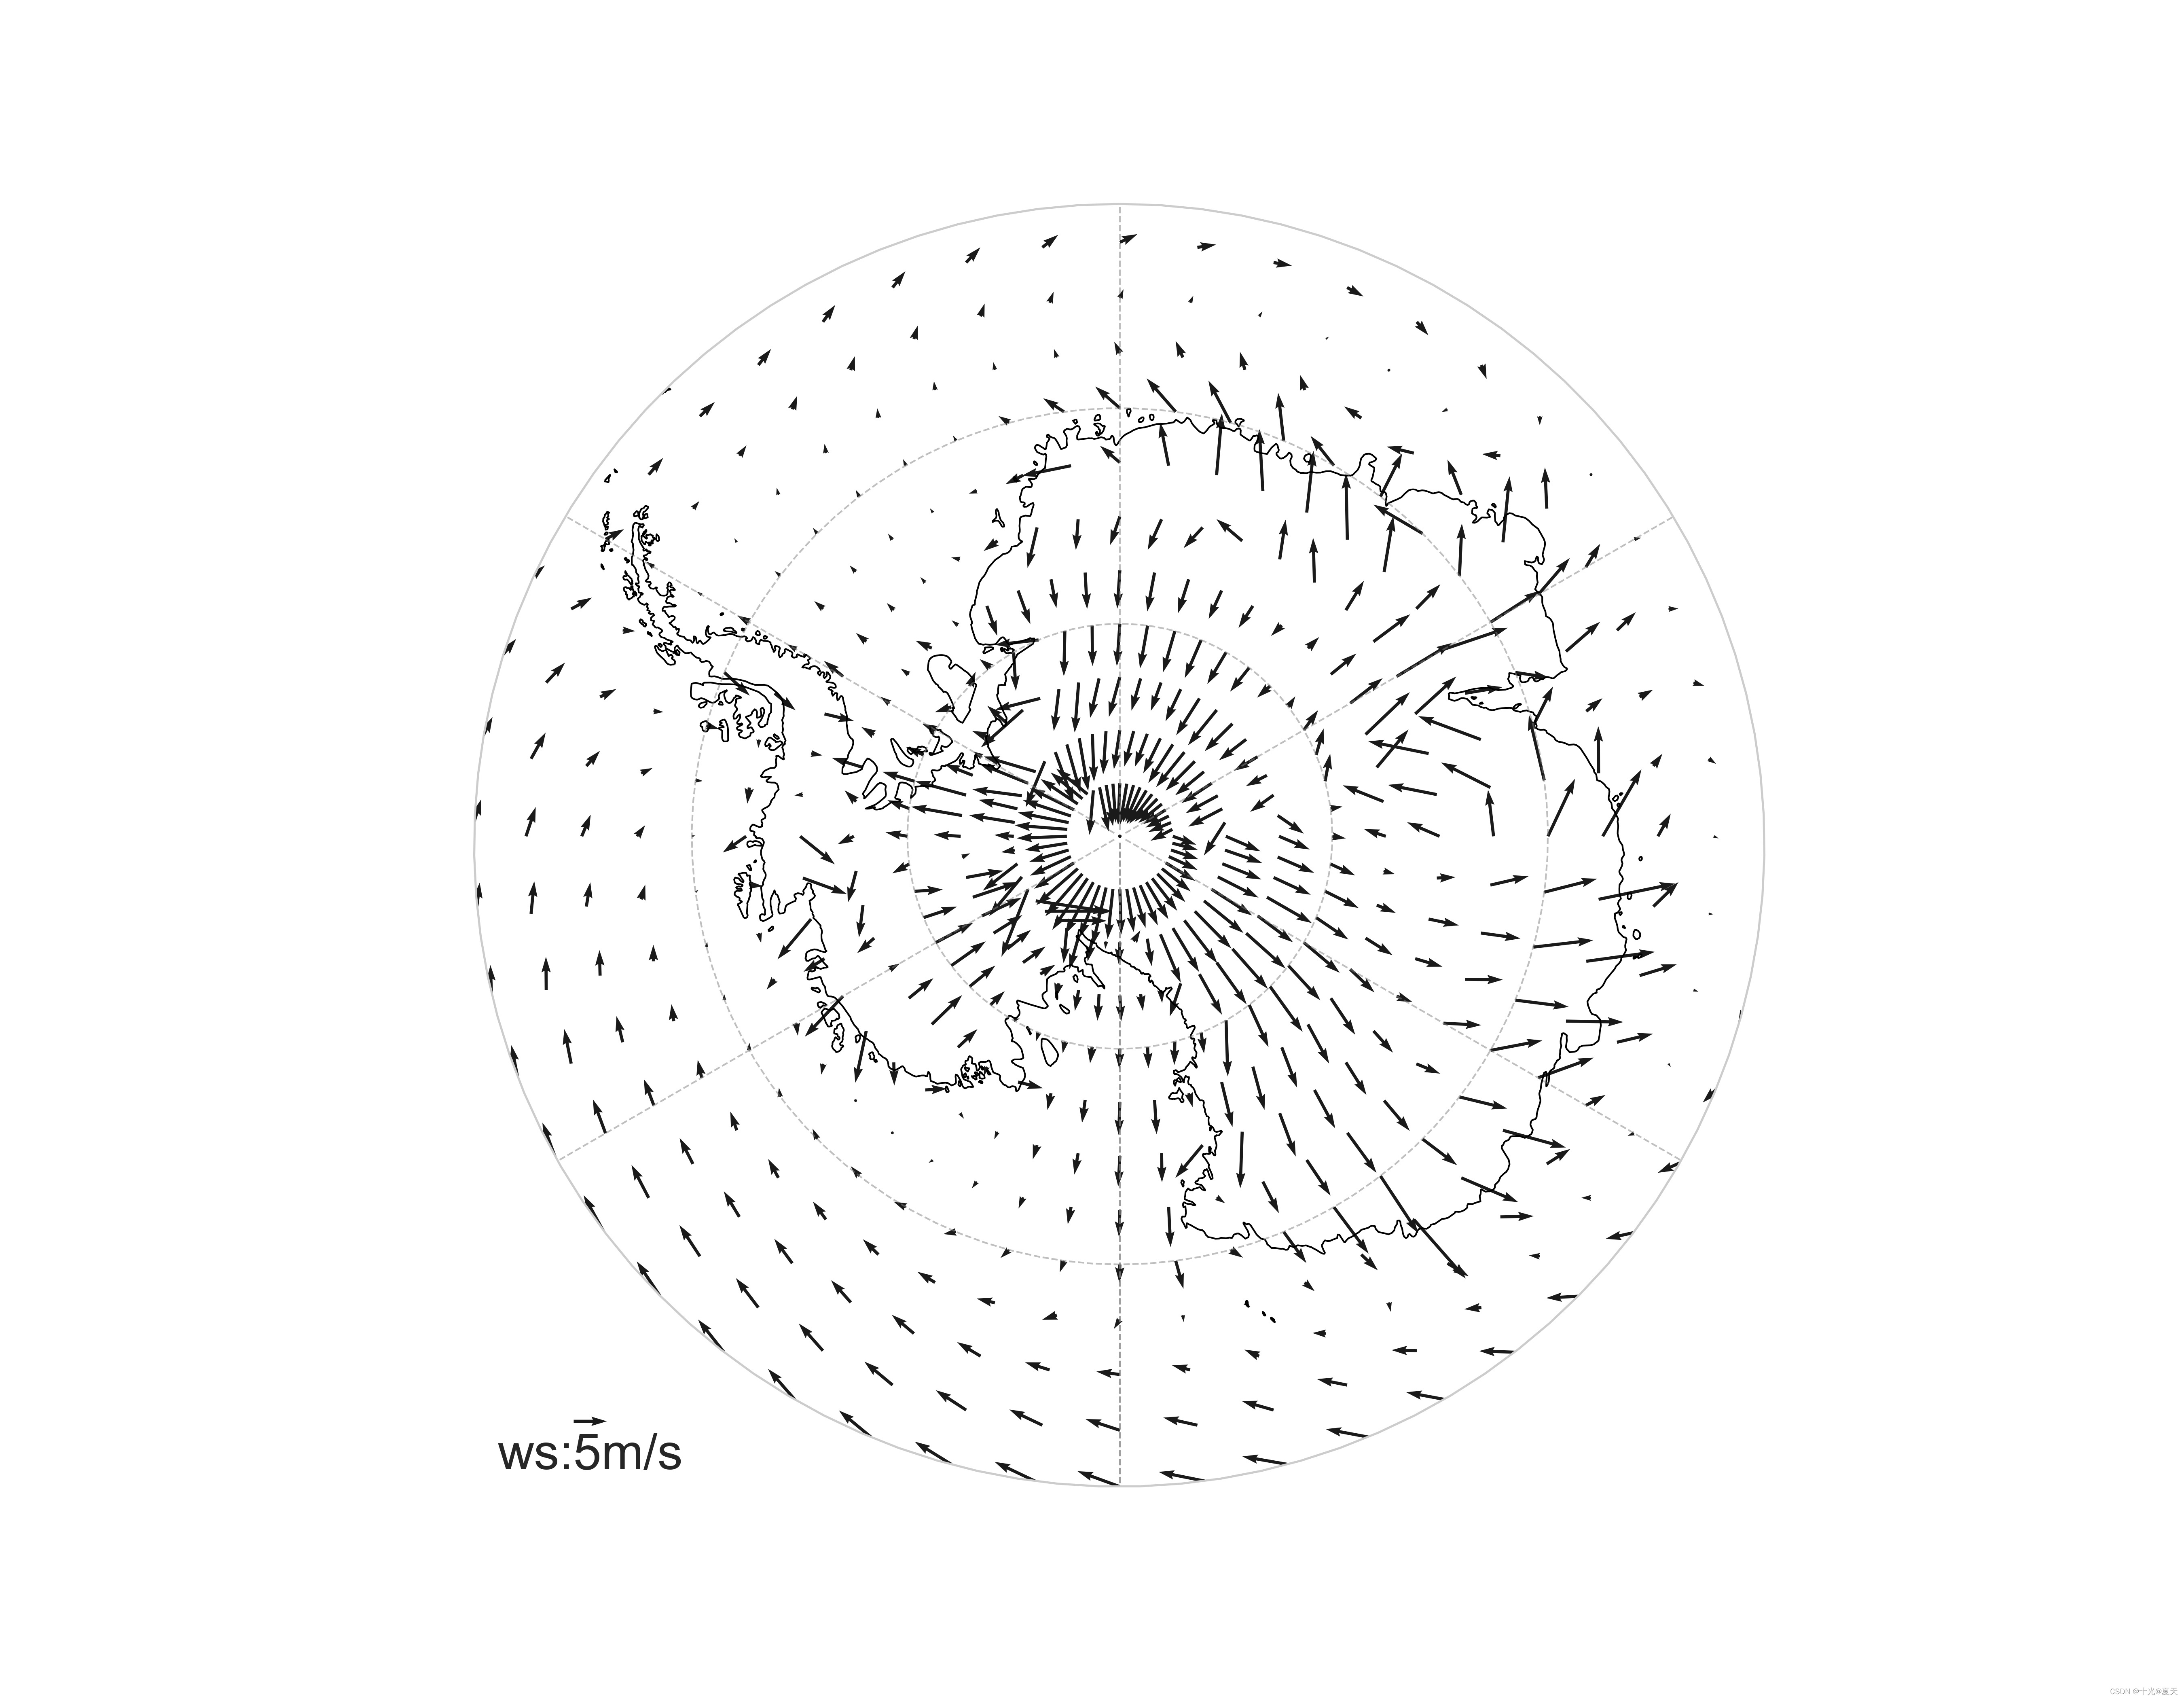
# ----------------------------------1.这个地区长期的风向图
# 读数据
import netCDF4 as nc
import pandas as pd
import numpy as np

file = 'adaptor.mars.internal-1645705255.1744275-4126-10-f3cf0eb9-b755-45ec-9de1-92b8694846c7.nc'
dataset = nc.Dataset(file)

uwind = dataset.variables['u'][:]
vwind = dataset.variables['v'][:]

# 读取经纬度数据lat=46, lon=72
lon = dataset.variables['longitude'][:]
lat = dataset.variables['latitude'][:]
# 对风向进行平均
uwind_mean=np.mean(uwind,axis=0)
vwind_mean=np.mean(vwind,axis=0)

# 绘图可视化
import matplotlib.pyplot as plt
import matplotlib.path as mpath
import matplotlib.ticker as mticker
import cartopy.crs as ccrs
import cartopy.feature as cfeature
from cartopy.mpl.gridliner import LONGITUDE_FORMATTER, LATITUDE_FORMATTER
import cartopy.mpl.ticker as cticker
import cartopy.io.shapereader as shpreader
import seaborn as sns
sns.set(style='whitegrid')
font = {'family' : 'Arial',
        'weight' : 'normal',
        'size'   : 30,
        }
fig1 = plt.figure(figsize=(18,14))
######################################################################整体投影图
leftlon, rightlon, lowerlat, upperlat = (-180,180,-60,-90)
img_extent = [leftlon, rightlon, lowerlat, upperlat]
#以下我仅展示了左半部分,右半部分基本一致,在此省略
f1_ax1 = fig1.add_subplot(1, 1,1, projection=ccrs.SouthPolarStereo())
# f1_ax1 = fig1.add_axes([0.1, 0.1, 0.9, 0.9],projection = ccrs.SouthPolarStereo())
gl=f1_ax1.gridlines(crs=ccrs.PlateCarree(), draw_labels=True,
                  linewidth=1, color='gray', alpha=0.5, linestyle='--')
gl.ylocator = mticker.FixedLocator([-70, -80])
f1_ax1.set_extent(img_extent, ccrs.PlateCarree())
#通过圆柱投影的范围限制地图范围,这样设置地图参数较为方便
f1_ax1.add_feature(cfeature.COASTLINE.with_scale('50m'))

#######以下为网格线的参数######
theta = np.linspace(0, 2*np.pi, 100)
center, radius = [0.5, 0.5], 0.5
verts = np.vstack([np.sin(theta), np.cos(theta)]).T
circle = mpath.Path(verts * radius + center)

# ##############################
f1_ax1.set_boundary(circle, transform=f1_ax1.transAxes)
xx,yy=np.meshgrid(lon,lat)
#h1 =f1_ax1.quiver(xx,yy,uwind_mean, vwind_mean,color='k',scale=250,zorder=10,width=0.002,headwidth=3,headlength=4.5,transform=ccrs.PlateCarree())


h1 = f1_ax1.quiver(xx[::10,::30], yy[::10,::30], uwind_mean[::10,::30], vwind_mean[::10,::30],transform=ccrs.PlateCarree())
f1_ax1.quiverkey(h1,                      #传入quiver句柄
              X=0.09, Y = 0.051,       #确定 label 所在位置,都限制在[0,1]之间
              U = 5,                    #参考箭头长度 表示风速为5m/s。
              angle = 0,            #参考箭头摆放角度。默认为0,即水平摆放
             label='ws:5m/s',        #箭头的补充:label的内容  +
             labelpos='S',          #label在参考箭头的哪个方向; S表示南边
             fontproperties = font,        #label 的字体设置:大小,样式,weight
             )
plt.savefig('Antarctic_wind_mean_1979.jpg',dpi=300)
plt.show()


# ----------------------------------2.u,v对于某个指数的回归斜率图(*2,彩色图)
# 读u_wind的斜率和显著性数据
u_slope=pd.read_csv('uwind_slope.csv')
u_slope=np.array(u_slope.iloc[:,1:])

u_slope_pvalues=pd.read_csv('uwind_pvalue.csv')
u_slope_pvalues=np.array(u_slope_pvalues.iloc[:,1:])

# 绘图可视化
import matplotlib.pyplot as plt
import matplotlib.path as mpath
import matplotlib.ticker as mticker
import cartopy.crs as ccrs
import cartopy.feature as cfeature
from cartopy.mpl.gridliner import LONGITUDE_FORMATTER, LATITUDE_FORMATTER
import cartopy.mpl.ticker as cticker
import cartopy.io.shapereader as shpreader
import seaborn as sns
sns.set(style='whitegrid')
font = {'family' : 'Times New Roman',
        'color'  : 'black',
        'weight' : 'normal',
        'size'   : 25,
        }
fig1 = plt.figure(figsize=(18,14))

######################################################################整体投影图
leftlon, rightlon, lowerlat, upperlat = (-180,180,-60,-90)
img_extent = [leftlon, rightlon, lowerlat, upperlat]
#以下我仅展示了左半部分,右半部分基本一致,在此省略
f1_ax1 = fig1.add_subplot(1, 1, 1, projection=ccrs.SouthPolarStereo())
# f1_ax1 = fig1.add_axes([0.1, 0.1, 0.9, 0.9],projection = ccrs.SouthPolarStereo())
gl=f1_ax1.gridlines(crs=ccrs.PlateCarree(), draw_labels=True,
                  linewidth=1, color='gray', alpha=0.5, linestyle='--')
gl.ylocator = mticker.FixedLocator([-70, -80])
f1_ax1.set_extent(img_extent, ccrs.PlateCarree())
#通过圆柱投影的范围限制地图范围,这样设置地图参数较为方便
f1_ax1.add_feature(cfeature.COASTLINE.with_scale('50m'))

#######以下为网格线的参数######
theta = np.linspace(0, 2*np.pi, 100)
center, radius = [0.5, 0.5], 0.5
verts = np.vstack([np.sin(theta), np.cos(theta)]).T
circle = mpath.Path(verts * radius + center)

# ##############################
f1_ax1.set_boundary(circle, transform=f1_ax1.transAxes)
xx,yy=np.meshgrid(lon,lat)
c7 = f1_ax1.pcolormesh(xx,yy,u_slope, zorder=0,transform=ccrs.PlateCarree(), cmap=plt.cm.bwr,vmin=-1, vmax=1)
cb=plt.colorbar(c7)
cb.ax.tick_params(labelsize=16)  #设置色标刻度字体大小
# plt.savefig('Antarctic.jpg',dpi=300)

# 画一下显著性的散点
u_slope_pvalues_1D=u_slope_pvalues[20:100,:].ravel()
xx_1D=xx[20:100,:].ravel()
yy_1D=yy[20:100,:].ravel()

f1_ax1.scatter(xx_1D[np.argwhere(u_slope_pvalues_1D<0.01)][::80],yy_1D[np.argwhere(u_slope_pvalues_1D<0.01)][::80],transform=ccrs.PlateCarree(),s=50,c='black',marker='+')

plt.savefig('Antarctic_uwind_slope.jpg',dpi=300)
plt.show()

