课时35
?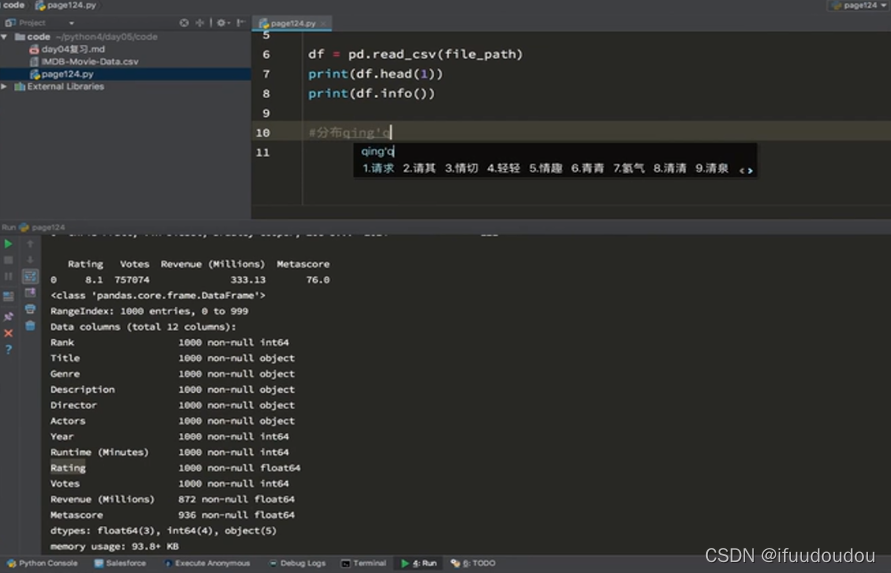
import pandas as pd
from matplotlib import pyplot as plt
file_path=" "#csv文件
pd.read_csv(file_path)
#rating,runtime分布情况
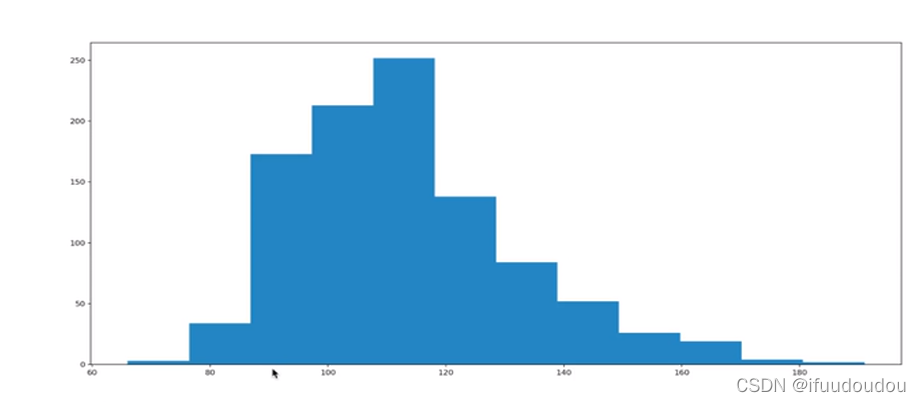
#选择图形,对连续数据的统计,使用直方图
#准备数据
runtime_data=df["Runtime(Minutes)"].values
max_runtime=runtime_data.max()
min_runtime=runtime_data.min()
#计算组数
num_bin=(max_runtime-min_runtime)//10
#设置图形大小
plt.figure(figsize=(28,8),dpi=80)
plt.hist(runtime_data,num_bin)
plt.show()
?
优化一下组距,添加x轴信息。
import pandas as pd
from matplotlib import pyplot as plt
file_path=" "#csv文件

pd.read_csv(file_path)

#rating,runtime分布情况
#选择图形,对连续数据的统计,使用直方图
#准备数据

runtime_data=df["Runtime(Minutes)"].values

max_runtime=runtime_data.max()
min_runtime=runtime_data.min()
#计算组数

num_bin=(max_runtime-min_runtime)//5

#设置图形大小
plt.figure(figsize=(28,8),dpi=80)
plt.hist(runtime_data,num_bin)

plt.xticks(range(min_runtime,max_runtime+5,5))
plt.show()
 ?
?
import pandas as pd
from matplotlib import pyplot as plt
file_path=" "#csv文件

pd.read_csv(file_path)

#rating,runtime分布情况
#选择图形,对连续数据的统计,使用直方图
#准备数据

runtime_data=df["Runtime(Minutes)"].values

max_runtime=runtime_data.max()
min_runtime=runtime_data.min()
#计算组数

num_bin=(max_runtime-min_runtime)//0.5

#设置图形大小
plt.figure(figsize=(28,8),dpi=80)


num_bin_list=[1.6]
i=min_runtime
while i<=max_runtime:
    i+=0.5
    num_bin_list.append(i)


plt.hist(runtime_data,num_bin_list)

#_x=[]
#i=min_runtime
#while i <=min_runtime+0.5:
    #i=i+0.5
    #_x.append(i)
#_x=list(range(min_runtime*2,max_runtime*2)) #浮点数不能用range
#_x=[i/2 for i in _x]


plt.xticks(range(min_runtime,max_runtime*0.5,))
plt.show()
?
 ?
?
?课时37

 ?
?
?
import pandas as pd
from matplotlib import pyplot as plt
file_path=""

df=pd.read_csv(file_path)

#统计分类的列表
temp_list=df["Genre"].str.split(",").tolist(0)

genre_list=list(set([i for j in temp_list for i in j]))

#构造全为0的数组
zeros_df=pd.DataFrame(np.zeros((df.shape[0],len(genre_list))),columns=genre_list)

#给每个电影出现分类的位置赋值1

for i in range(df.shape[0]):
    zeros_df.loc[i,temp_list[i]]=1

#统计每个分类的电影的数量和
genre_count=genre_zeros_df.sum(axis=0)

#排序
genre_count=genre_count.sort_values()
_x=genre_count.index
_y=genre_count.values
#绘图
plt.figure(figsize=(20,8),dpi=80)
plt.bar(range(len(_x),_y))
plt.xticks(range(len(_x)),_x)

plt.show()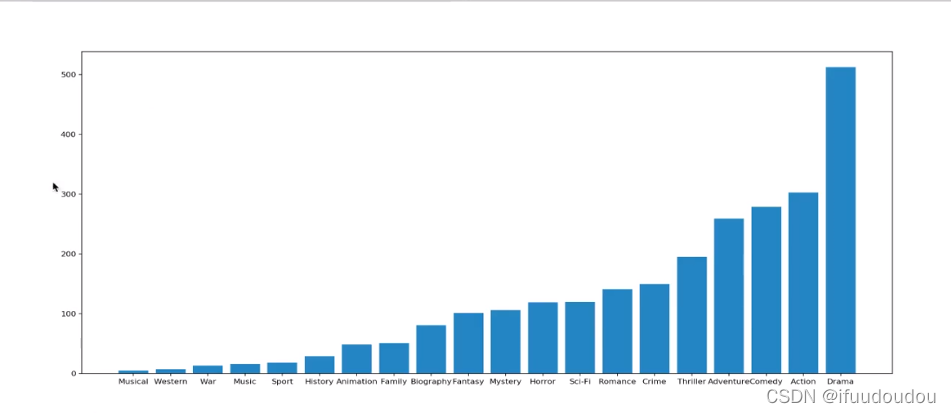
其中最重要的部分是把字符串转化成数字来统计。