1 初步设想买卖信号应该和指标数据不一样,是有买卖才进行记录,没有买卖则不标记。
比如某个时间点发生了买卖,将时间记录下来,然后再记下买卖了几手,同时标记一下是开仓还是平仓。
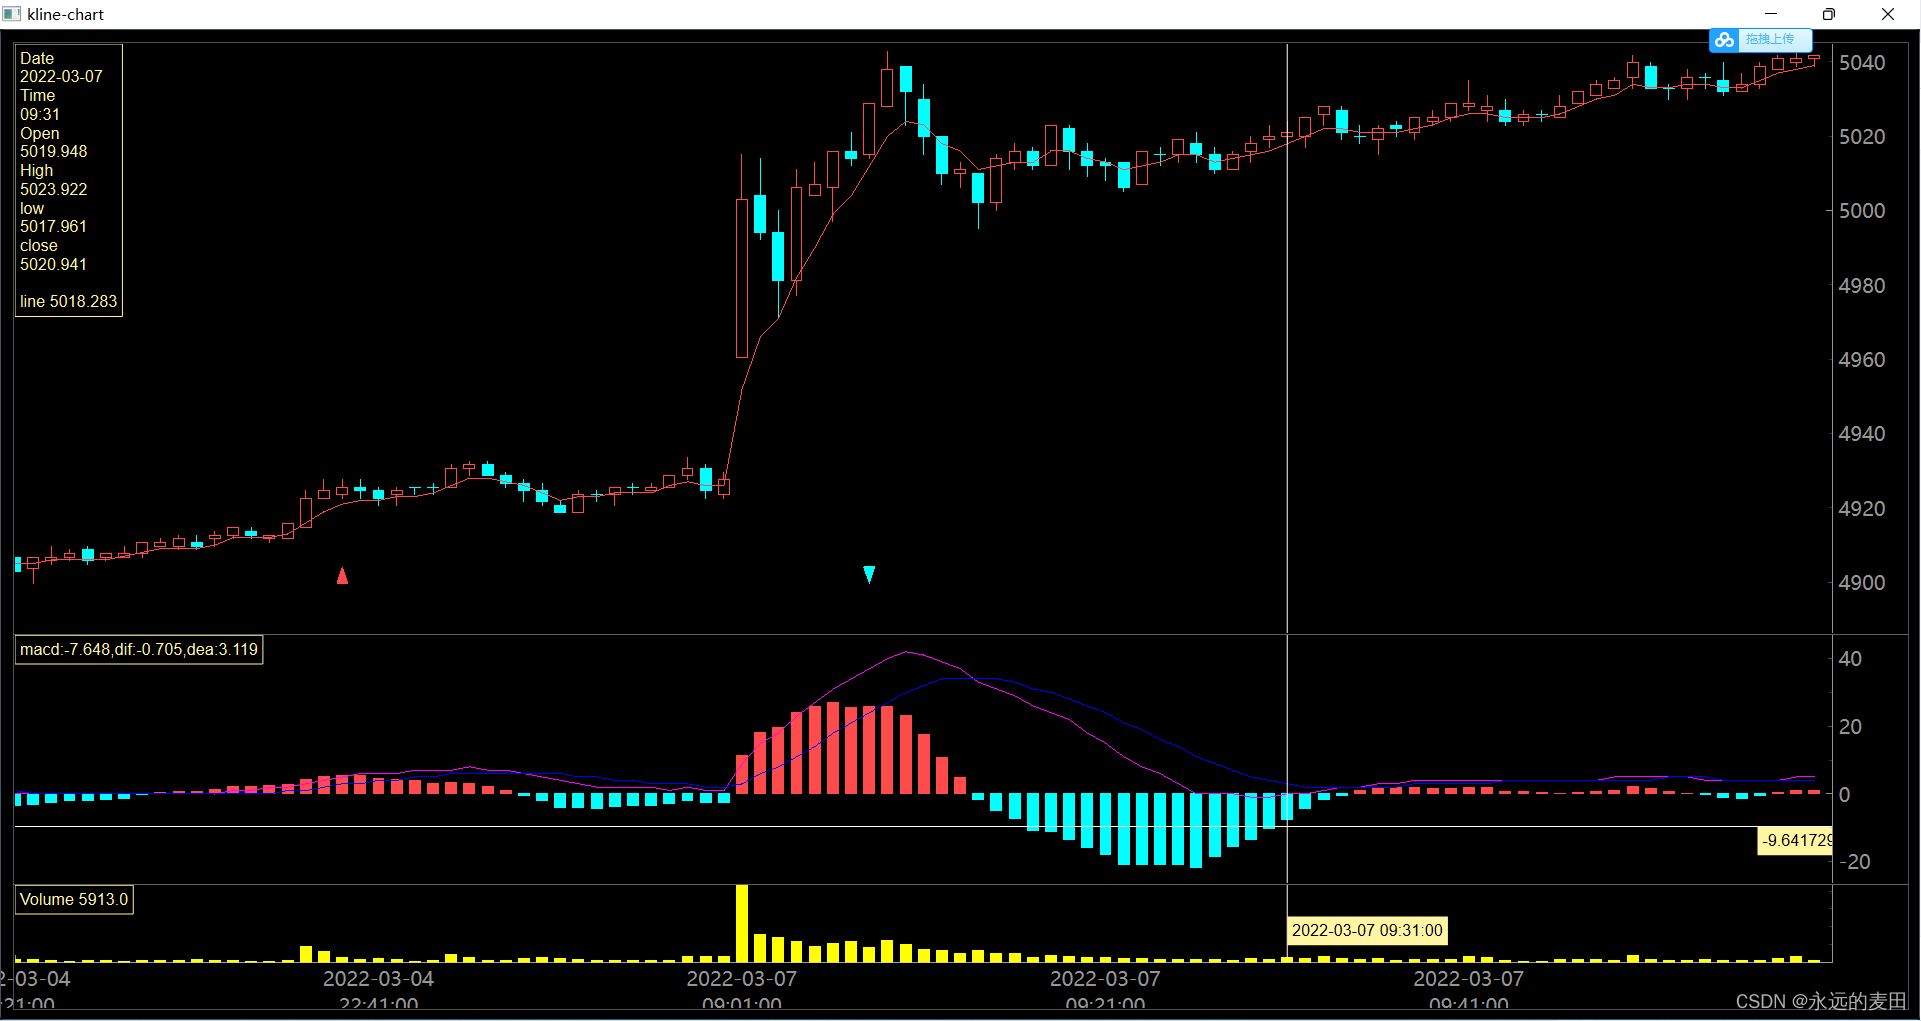
2 买卖信号应该与K线图叠加,在K线的下方标记一个小三角,箭头向上表示开仓,红色表示做多,绿色表示做空。箭头向下表示平仓。
3 由于上一节我们已经完成了多种图表的叠加,因此买卖信号相当于是买卖图表与K线图表的叠加。
买卖信号的图形是箭头,我们可以画三角形,应该用到函数:
painter.drawPolygon(points)
对于向上的箭头:
points = QPolygonF([
    QPointF(ix, min_value + (max_value-min_value)*0.03),
    QPointF(ix - BAR_WIDTH, min_value),
    QPointF(ix + BAR_WIDTH, min_value)
])
向下的箭头:
points = QPolygonF([
    QPointF(ix, min_value),
    QPointF(ix - BAR_WIDTH, min_value + (max_value-min_value)*0.03),
    QPointF(ix + BAR_WIDTH, min_value + (max_value-min_value)*0.03)
])
对应需要引用的模块:
from PySide6.QtCore import QPointF
from PySide6.QtGui import QPolygonF
其它的应该与其它的ChartItem类似,我们新建一个类
class ArrowItem(ChartItem)用来实现这个向上的箭头和向下的箭头
至此,画出买卖信号的关键代码就完成了。
在代码完成前还需要注意一点,ArrowItem相比CandleItem或是其他的图表类而言,它里面的数值是不能参与到plot页面大小的设定的,因为里面的数据并不包含对应的股票价格,甚至可能没有一条买卖信号。因此,在get_layout_range中,需要针对这种类型的数据进行屏蔽:
        max_price = float("-inf")  # 无限小,比所有数都小
        min_price = float("inf")  # 无限大,比所有数都大
        chart_items: dict[ItemIndex, ChartItemInfo] = self._all_chart_infos[layout_index]
        for info in chart_items.values():
            bar_list = list(info.bars.values())[min_ix:max_ix + 1]
            if info.type == "Arrow":
                continue    # 对于画箭头型的,大小不在区域范围内
            for bar in bar_list[:]:
                for item in bar[1:]:
                    max_price = max(max_price, item)
                    min_price = min(min_price, item)
        self._all_ranges[layout_index][(min_ix, max_ix)] = (min_price, max_price)
附上ArrowItem的实现代码:
class ArrowItem(ChartItem):
    """
    箭头图
    """

    def __init__(self, layout_index, chart_index, manager: BarManager):
        """"""
        super().__init__(layout_index, chart_index, manager)

    def _draw_bar_picture(self, ix: int, old_bar: KlineItem, bar: KlineItem) -> QtGui.QPicture:
        from PySide6.QtCore import QPointF
        from PySide6.QtGui import QPolygonF
        """"""
        # Create objects
        volume_picture = QtGui.QPicture()
        if bar is None:
            return volume_picture

        painter = QtGui.QPainter(volume_picture)

        # Set painter color
        # if bar.close_price >= bar.open_price:
        if bar[2] == Offset.OPEN.value and bar[1] > 0:
            painter.setPen(self._up_pen)
            painter.setBrush(self._up_brush)
        else:
            painter.setPen(self._down_pen)
            painter.setBrush(self._down_brush)
        # Draw volume body

        min_value, max_value = self.get_y_range(self._rect_area[0], self._rect_area[1])
        if bar[2] == Offset.OPEN.value:
            points = QPolygonF([
                QPointF(ix, min_value + (max_value-min_value)*0.03),
                QPointF(ix - BAR_WIDTH, min_value),
                QPointF(ix + BAR_WIDTH, min_value)
            ])
        else:
            points = QPolygonF([
                QPointF(ix, min_value),
                QPointF(ix - BAR_WIDTH, min_value + (max_value-min_value)*0.03),
                QPointF(ix + BAR_WIDTH, min_value + (max_value-min_value)*0.03)
            ])

        painter.drawPolygon(points)
        painter.end()

        return volume_picture

    def get_info_text(self, ix: int) -> str:
        """
        Get information text to show by cursor.
        """
        bar = self.get_bar(ix)

        if bar:
            text = f"Volume {bar[1]}"
        else:
            text = ""

        return text
再附上实现的效果图:

?最后贴上gitee的地址:klinechart: 股票K线图表 - Gitee.com
