python 循环绘制子图时,设置共享x、y轴
00 前言
通常在阅读文献时,发现对于一些图片的绘制时,如果存在多个子图,通常为了美观、简洁,只保留最后一列的以及最左一侧的子图的刻度,如下图所示:
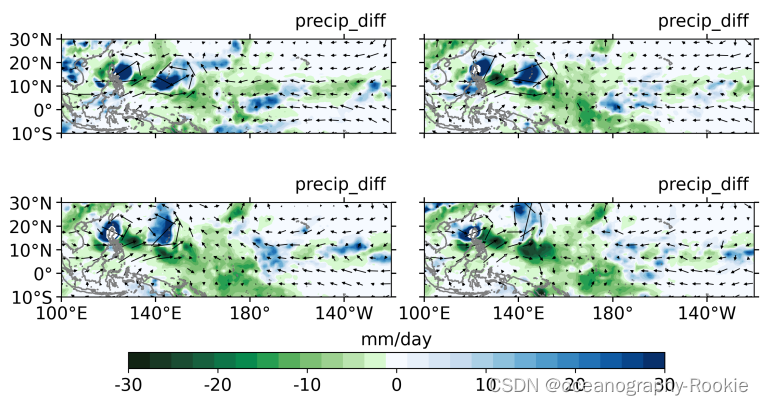
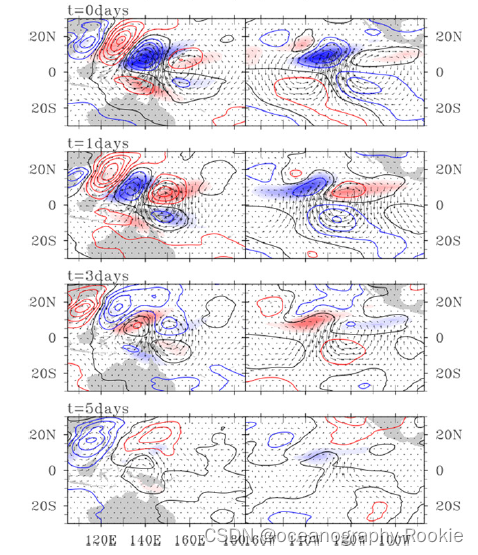

那么,我们应该如何实现这种功能呢?
一般来说,在python实现多子图绘制的函数主要有两个:
- 第一种,通过
fig.add_subplot(行、列、位置)添加
import matplotlib.pyplot as plt
fig=plt.figure(figsize=(5,5))
subplot=fig.add_subplot(1,1,1)
- 第二种,通过
plt.subplots(行,列),将行数和列数作为参数传递给该方法,该方法返回一个图对象和轴对象,可以用来操作图形。
import matplotlib.pyplot as plt
fig,ax=plt.subplots(2,1)
1、使用fig.add_subplot(行、列、位置)添加子图
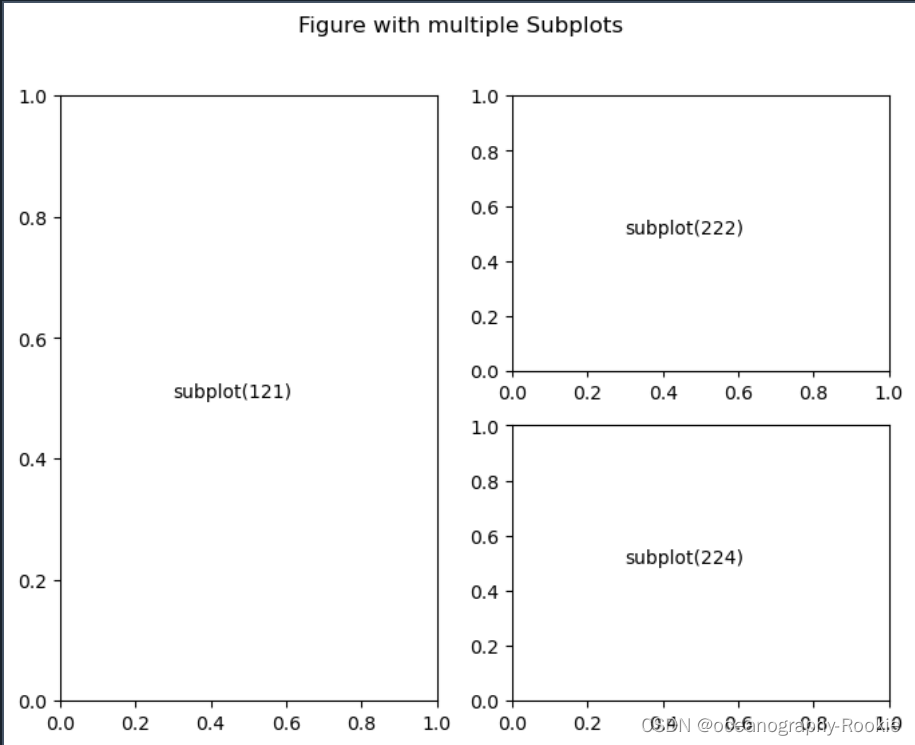
其中,对于第一种来说,比较容易上手,只需要指定子图的具体位置即可,如下图所示:
import matplotlib.pyplot as plt

fig=plt.figure(figsize=(8,6),dpi=100)

ax_1=fig.add_subplot(121)
ax_1.text(0.3, 0.5, 'subplot(121)')

ax_2=fig.add_subplot(222)
ax_2.text(0.3, 0.5, 'subplot(222)')

ax_3=fig.add_subplot(224)
ax_3.text(0.3, 0.5, 'subplot(224)')

fig.suptitle("Figure with multiple Subplots")
plt.show()
1.1 循环绘制子图
如果要在一个页面上显示一个2x2的四个子图,只需要添加一个循环即可:
import matplotlib.pyplot as plt

fig=plt.figure(figsize=(8,6),dpi=100)
c=0
for i in range(4):
    c=c+1
    ax=fig.add_subplot(2,2,c)
    ax.text(0.3, 0.5, 'subplot(22'+str(c)+')')
    fig.suptitle("Figure with multiple Subplots")
plt.show()

2、使用plt.subplots(行,列)添加子图
matplotlib.pyplot.subplots(nrows=1, ncols=1, *,
sharex=False, sharey=False,
squeeze=True, subplot_kw=None,
gridspec_kw=None, **fig_kw)
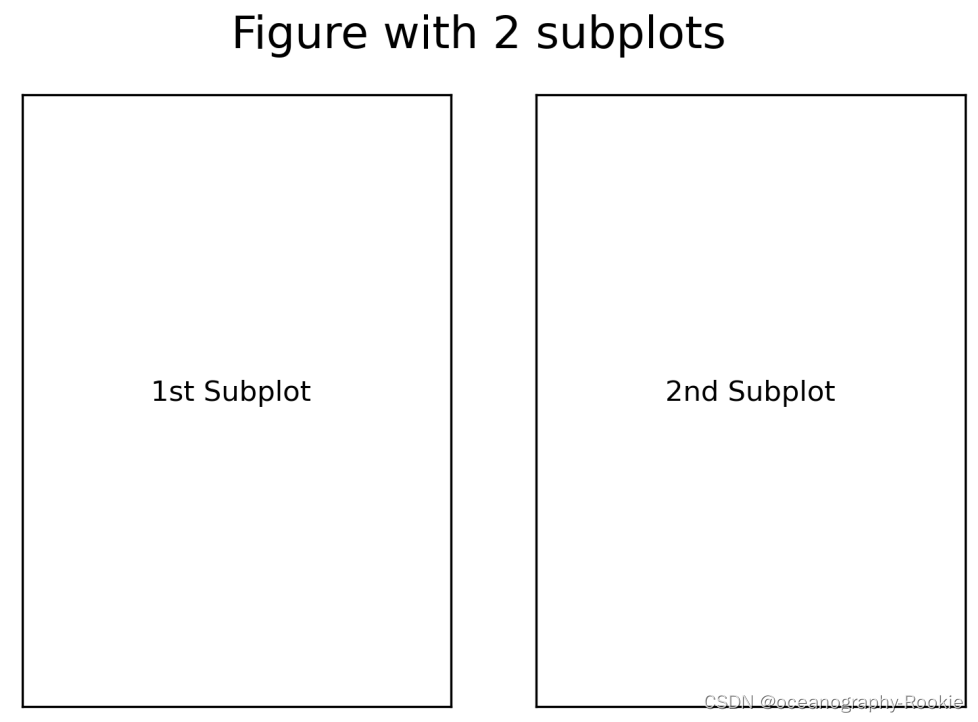
但是,plt.subplots()与fig.add_subplot()相比稍微麻烦一点,但是功能也多一点,通过返回ax列表中的子图个数进行子图的绘制:
import matplotlib.pyplot as plt

fig,ax=plt.subplots(1,2,dpi=300)

ax[0].text(0.3,0.5,"1st Subplot")
ax[0].set_xticks([])
ax[0].set_yticks([])

ax[1].text(0.3,0.5,"2nd Subplot")
ax[1].set_xticks([])
ax[1].set_yticks([])

fig.suptitle('Figure with 2 subplots',fontsize=16)
plt.show()
2.1 循环绘制子图
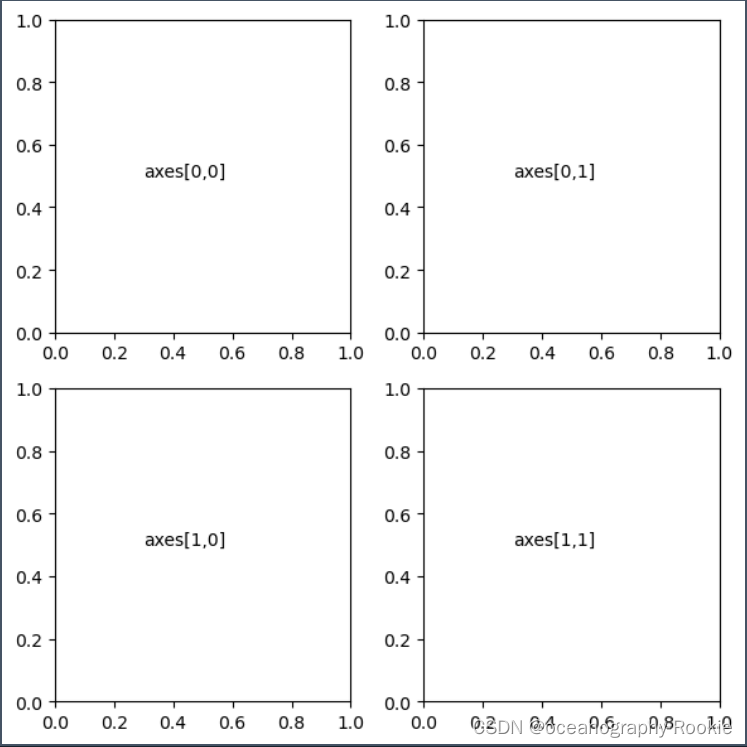
对于plt.subplots(),如果要实现循环绘制子图,就需要双重循环:
import matplotlib.pyplot as plt

fig, axes = plt.subplots(2, 2, figsize=(6,6),dpi=100)

for i, row in enumerate(axes):
    for j, col in enumerate(row):
        axes[i,j].text(0.3, 0.5, 'axes['+str(i)+','+str(j)+']')

plt.tight_layout()
3、循环绘制子图时,设置共享坐标轴
那么,如何在循环绘制子图的同时,又实现共享坐标轴呢,这里就要使用到plt.subplots(),它提供了一个参数,可以自动实现共享坐标轴的功能,只需要在建立子图个数时添加sharex、sharey即可,如下所示:
fig, axes = plt.subplots(3, 3, sharex=True, sharey=True, figsize=(6,6))
下面进行简单示范:
import matplotlib.pyplot as plt

fig, axes = plt.subplots(2, 2, sharex=True, sharey=True, figsize=(6,6),dpi=100)

for i, row in enumerate(axes):
    for j, col in enumerate(row):
        axes[i,j].text(0.3, 0.5, 'axes['+str(i)+','+str(j)+']')
        fig.suptitle('Figure with 2x2 subplots',fontsize=16)
plt.tight_layout()
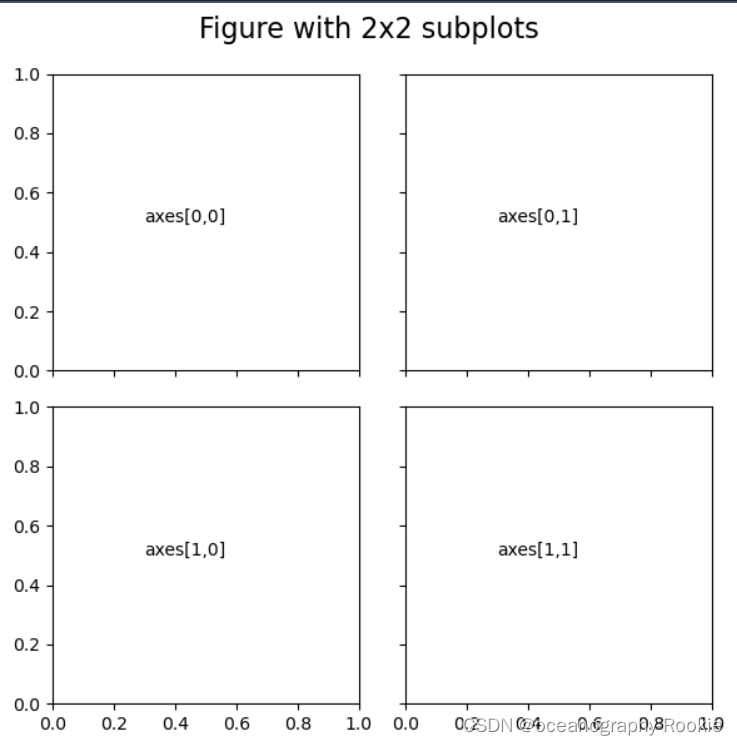
可以发现,已经实现了我们的需求!!
4、循环绘制子图时设置共享label
同样的,如果要实现共享label,应该怎么做呢?
这其实有两个思路:
- 通过
ax.text()选取适当位置,进行添加 - 在绘制子图时,添加判断语句进行添加
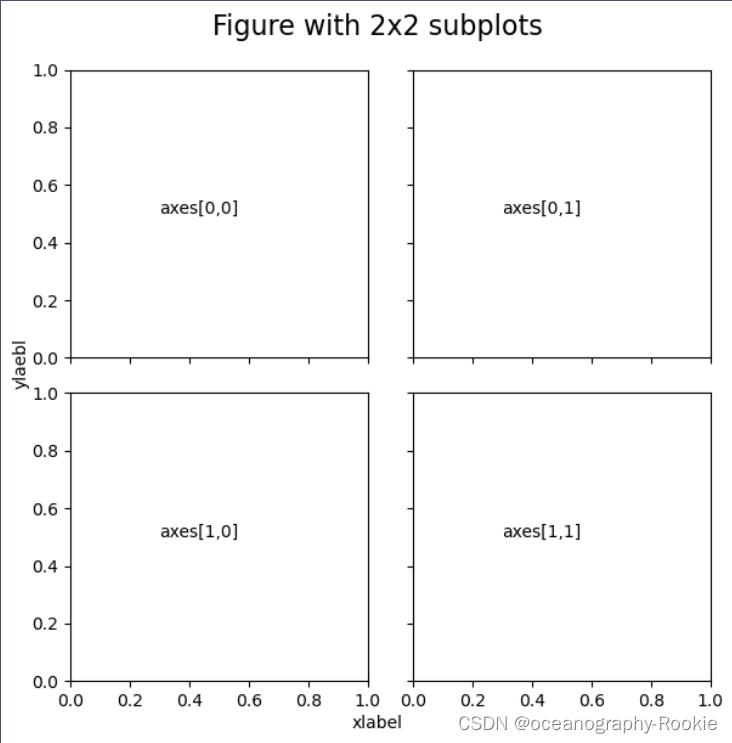
下面,进行简单演示:
import matplotlib.pyplot as plt

fig, axes = plt.subplots(2, 2, sharex=True, sharey=True, figsize=(6,6),dpi=100)

for i, row in enumerate(axes):
    for j, col in enumerate(row):
        axes[i,j].text(0.3, 0.5, 'axes['+str(i)+','+str(j)+']')
        fig.suptitle('Figure with 2x2 subplots',fontsize=16)

fig.text(0.5, 0, 'xlabel', ha='center')
fig.text(0, 0.5, 'ylaebl', va='center', rotation='vertical')

plt.tight_layout()
或者也可以如下面这样:
import matplotlib.pyplot as plt

fig, axes = plt.subplots(2, 2, sharex=True, sharey=True, figsize=(6,6),dpi=100)

for i, row in enumerate(axes):
    for j, col in enumerate(row):
        axes[i,j].text(0.3, 0.5, 'axes['+str(i)+','+str(j)+']')
        fig.suptitle('Figure with 2x2 subplots',fontsize=16)
        if col.is_last_row():
            col.set_xlabel('xlabel')
        if col.is_first_col():
            col.set_ylabel('ylaebl')
plt.tight_layout()

Tips:
-
对于海洋、大气相关专业的绘图,一般需要添加投影,所以需要在生成子图个数时添加进去
							一个努力学习python的ocean er
            			水平有限,欢迎指正!!!
              		欢迎评论、收藏、点赞、转发、关注。
              	关注我不后悔,记录学习进步的过程~~
