画个立方体
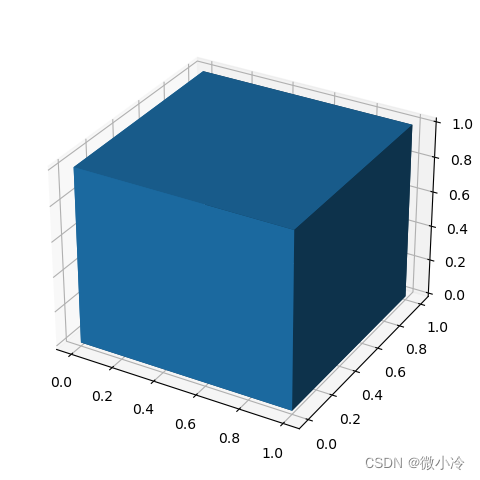
在matplotlib中,通过plt.voxels绘制立方体,下面先绘制一个最质朴的立方体

代码为
import matplotlib.pyplot as plt
import numpy as np

x, y, z = np.indices((2, 2, 2))
filled = np.ones((1,1,1))
ax = plt.subplot(projection='3d')
ax.voxels(x,y,z, filled=filled)
plt.show()
其中,x,y,z表示顶点,filled表示被填充的区域。由于其顶点数量为
2
×
2
×
2
2\times2\times2
2×2×2,故只有一个立方体,从而filled是一个
1
×
1
×
1
1\times1\times1
1×1×1的张量。
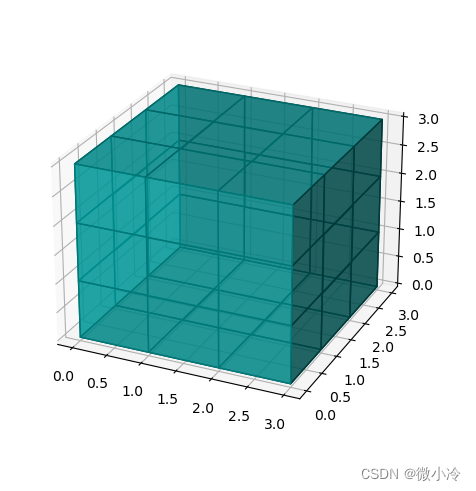
按照这个思路,可以做一个魔方
x, y, z = np.indices((4, 4, 4))
filled = np.ones((3,3,3))
cFace = np.where(filled, '#00AAAAA0', '#00AAAAA0')
cEdge = np.where(filled, '#008888', '#008888')
ax = plt.subplot(projection='3d')
ax.voxels(x,y,z, filled=filled, facecolors=cFace, edgecolors=cEdge)
plt.show()
其效果为

由于
x
,
y
,
z
x,y,z
x,y,z均为
4
×
4
×
4
4\times4\times4
4×4×4,则这些顶点共分割出
3
×
3
×
3
3\times3\times3
3×3×3的立方体,而filled填充,facecolors对面上色以及edgecolors对线上色,都是针对这
3
×
3
×
3
3\times3\times3
3×3×3的立方体而言的。其中,颜色的格式是RGBA,A就是透明度。
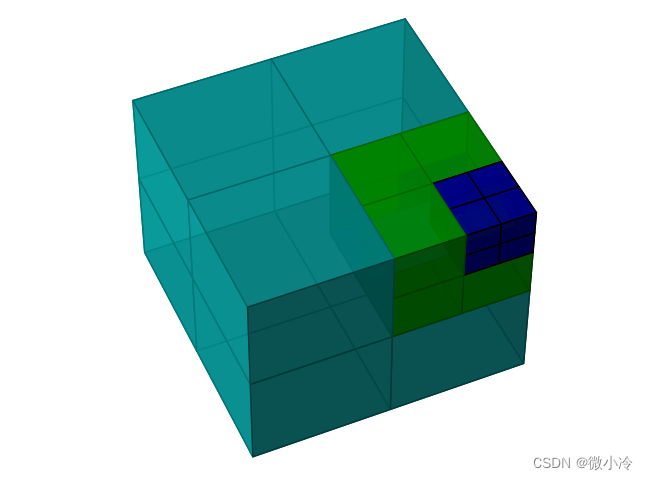
接下来,做一个八叉树的示意图
ax = plt.subplot(projection='3d')
ax.set_xlim(0,2)
ax.set_ylim(0,2)
ax.set_zlim(0,2)
ax.axis('off')

x, y, z = np.indices((3, 3, 3))
filled = np.ones((2,2,2))
filled[1,1,1] = False   #(1,1,1)这个立方体将要继续被分割
cFace = np.where(filled, '#00AAAACC', '#00AAAACC')
cEdge = np.where(filled, '#008888', '#008888')
ax.voxels(x,y,z, filled=filled, facecolors=cFace, edgecolors=cEdge) #第一次分割

x, y, z = np.indices((3, 3, 3))/2+1
cFace = np.where(filled, '#00AA00DD', '#00AA00DD')
cEdge = np.where(filled, '#008800', '#008800')
ax.voxels(x,y,z, filled=filled, facecolors=cFace, edgecolors=cEdge) #第二次分割

x, y, z = np.indices((3, 3, 3))/4+1.5
filled[1,1,1] = True
cFace = np.where(filled, '#0000AAEE', '#0000AAEE')
cEdge = np.where(filled, '#000000', '#000000')
ax.voxels(x,y,z, filled=filled, facecolors=cFace, edgecolors=cEdge) #第三次分割


plt.show()
其效果为

