最近看到一个餐厅销量预测的代码,奈何目前statsmodels 版本已经是0.13.2,之前代码运行报错
p,q = bic_matrix.stack().idxmin()
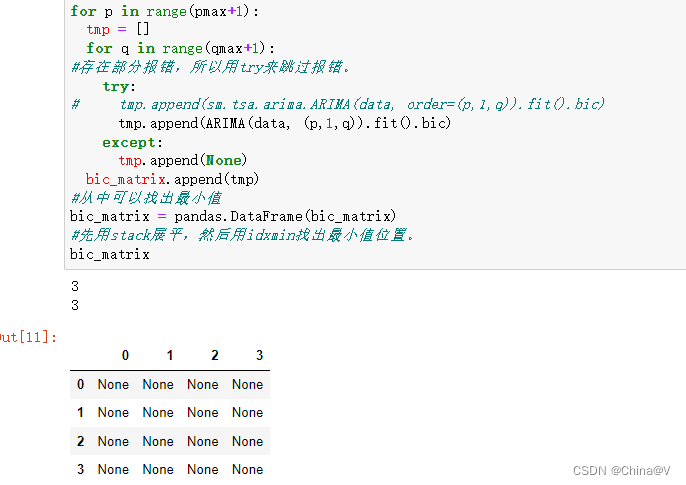
一开始以为是数据类型问题,当我输出时
print(bic_matrix)
得到的结果是
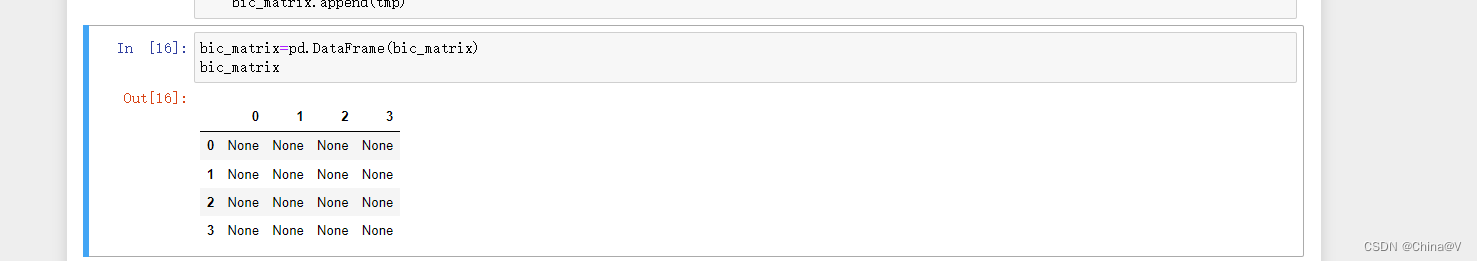 所以这里发现肯定是上面没有获取到值,找到这里发现就是关键
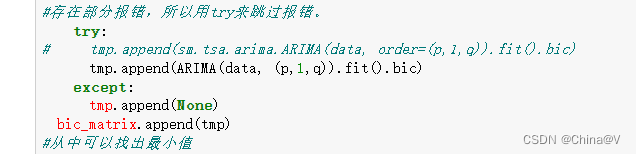
于是乎注释try except 再次运行得到
NotImplementedError:
statsmodels.tsa.arima_model.ARMA and statsmodels.tsa.arima_model.ARIMA have
been removed in favor of statsmodels.tsa.arima.model.ARIMA (note the .
between arima and model) and statsmodels.tsa.SARIMAX.

statsmodels.tsa.arima.model.ARIMA makes use of the statespace framework and
is both well tested and maintained. It also offers alternative specialized
parameter estimators.
这下就找到病因了,百度搜索,发现这位大佬的文章
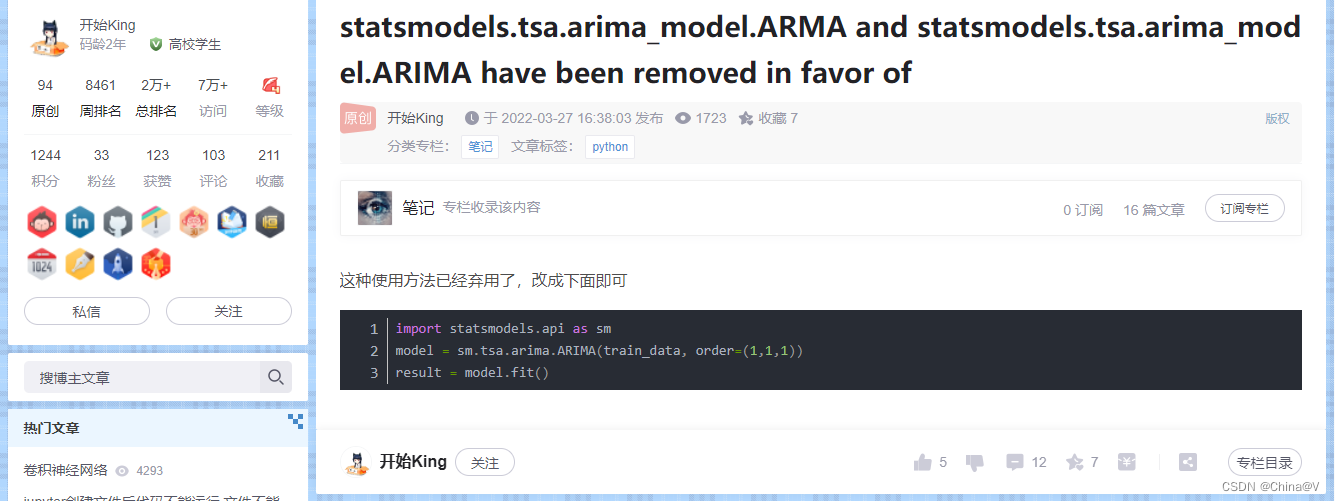
链接:https://blog.csdn.net/m0_52118763/article/details/123776168
使用大佬的方法,还是有点小问题
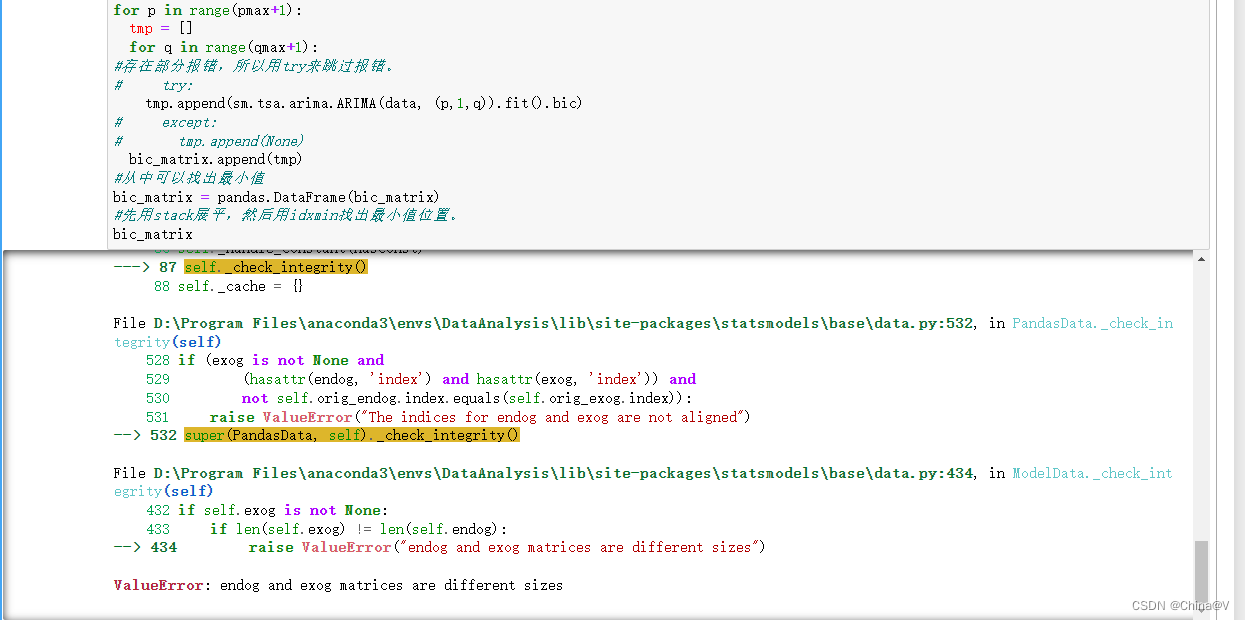
ValueError: endog and exog matrices are different sizes
发现是参数问题,于是添加了参数,成功运行
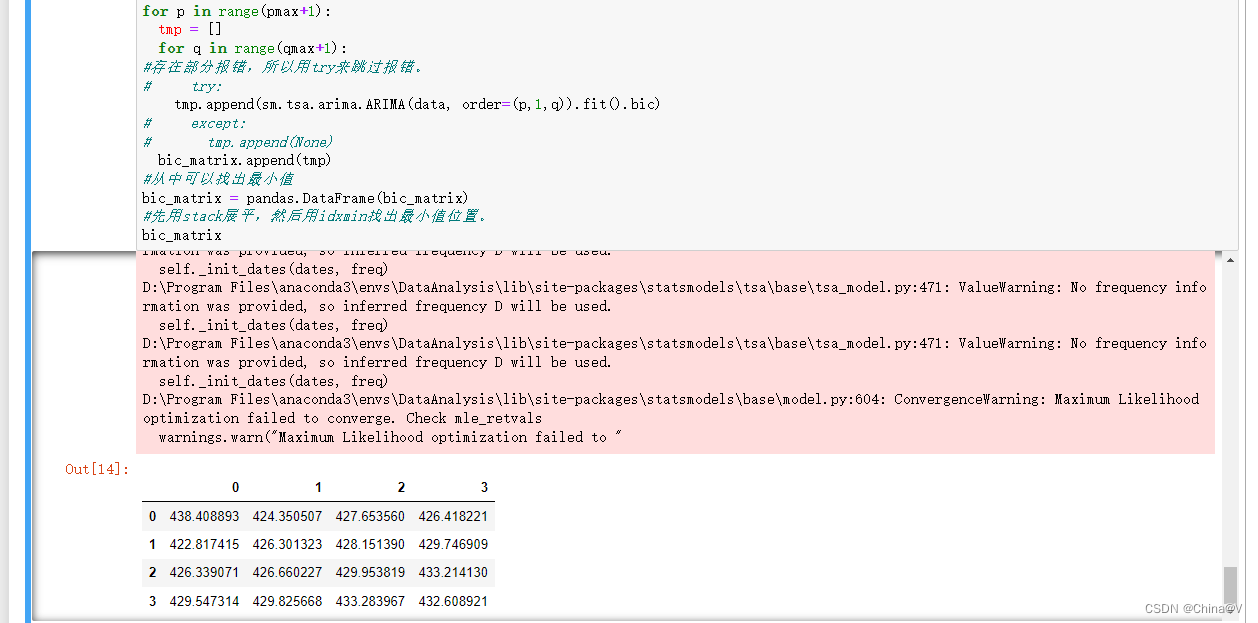
其他地方也替换修改,但是在最后,发现了一个问题
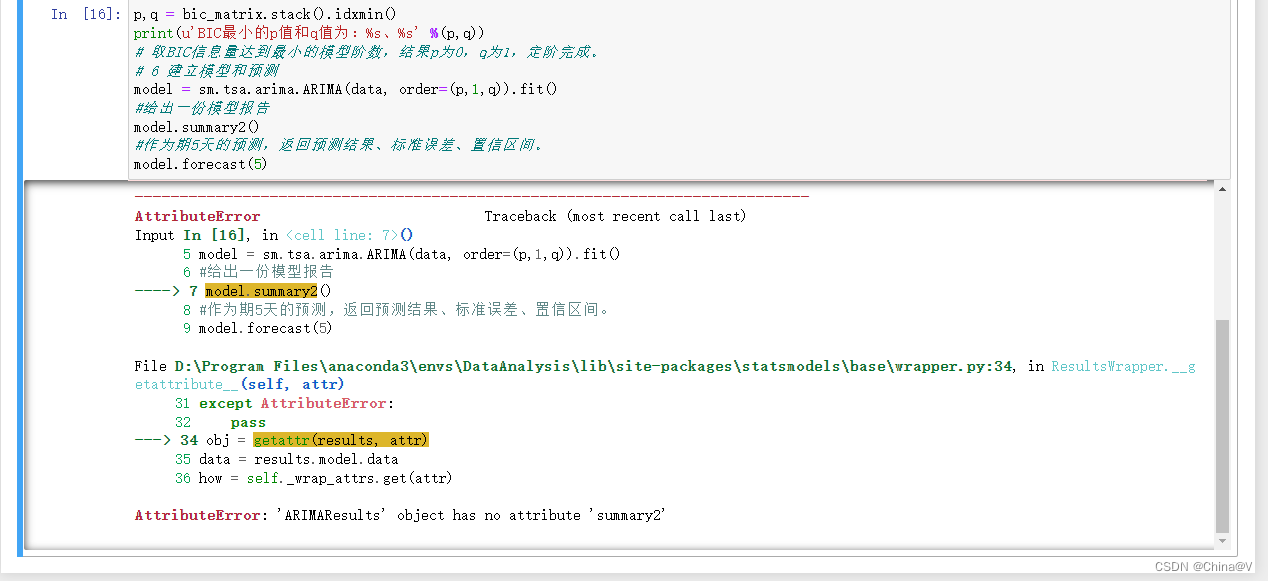
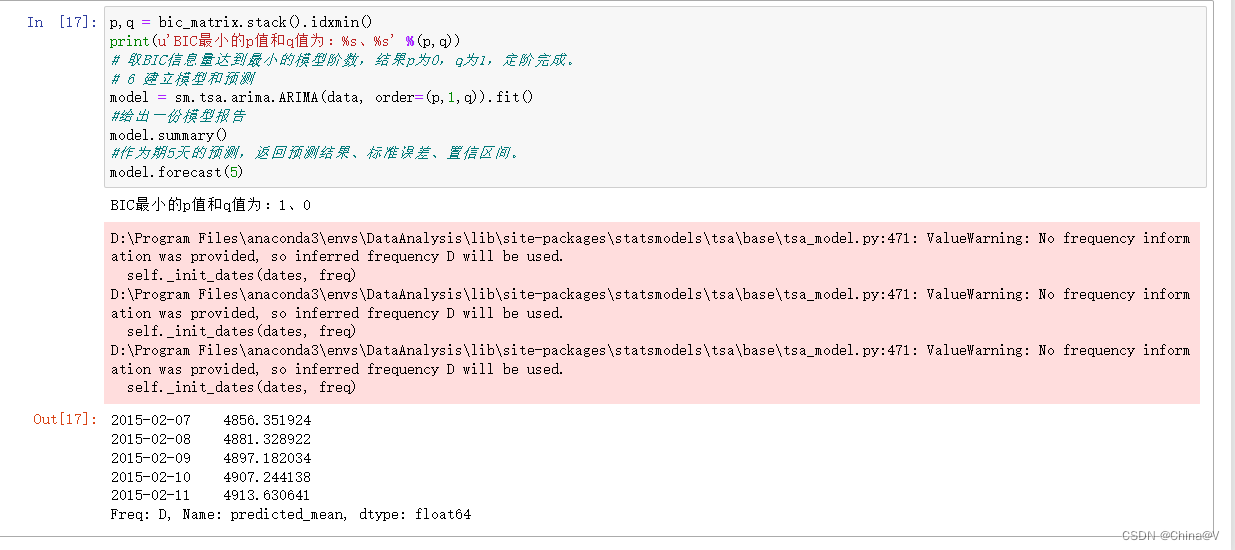
修改成下面的样子,就可以了正常输出数据了
这里确实没有弄懂,如果有知道的大佬,劳烦告知一声,非常感谢@开始king大佬的文章指点了迷津,最后献上完整代码
# -*- coding: utf-8 -*-

import pandas as pd

discfile = '../data/arima_data.xls'
forecastnum = 5


data = pd.read_excel(discfile, index_col = '日期')

# 时序图
import matplotlib.pyplot as plt
plt.rcParams['font.sans-serif'] = ['SimHei']  # 用来正常显示中文标签
plt.rcParams['axes.unicode_minus'] = False  # 用来正常显示负号
data.plot()
plt.show()

# 自相关图
from statsmodels.graphics.tsaplots import plot_acf
plot_acf(data).show()

# 平稳性检测
from statsmodels.tsa.stattools import adfuller as ADF
print('原始序列的ADF检验结果为:', ADF(data['销量']))


# 差分后的结果
D_data = data.diff().dropna()
D_data.columns = ['销量差分']
D_data.plot()  # 时序图
plt.show()
plot_acf(D_data).show()  # 自相关图
from statsmodels.graphics.tsaplots import plot_pacf
plot_pacf(D_data).show()  # 偏自相关图
print('差分序列的ADF检验结果为:', ADF(D_data['销量差分']))

# 白噪声检验
from statsmodels.stats.diagnostic import acorr_ljungbox
print('差分序列的白噪声检验结果为:', acorr_ljungbox(D_data, lags=1))

# from statsmodels.tsa.arima_model import ARIMA
import statsmodels.api as sm
# 定阶
data['销量'] = data['销量'].astype('float64')
pmax = int(len(D_data)/10)
qmax = int(len(D_data)/10)
bic_matrix = []  # BIC矩阵
for p in range(pmax+1):
  tmp = []
  for q in range(qmax+1):
    # try:  # 存在部分报错,所以用try来跳过报错。
      tmp.append(sm.tsa.arima.ARIMA(data, order=(p,1,q)).fit().bic)
    # except:
    #   tmp.append(None)
  bic_matrix.append(tmp)

bic_matrix = pd.DataFrame(bic_matrix)  # 从中可以找出最小值
print(bic_matrix)
p,q = bic_matrix.stack().idxmin()  # 先用stack展平,然后用idxmin找出最小值位置。
print('BIC最小的p值和q值为:%s、%s' %(p,q))
model = sm.tsa.arima.ARIMA(data, order=(p,1,q)).fit()  # 建立ARIMA(0, 1, 1)模型
print('模型报告为:\n', model.summary())
print('预测未来5天,其预测结果、标准误差、置信区间如下:\n', model.forecast(5))
以下是上面代码用到的数据
日期	销量
2015/1/1	3023
2015/1/2	3039
2015/1/3	3056
2015/1/4	3138
2015/1/5	3188
2015/1/6	3224
2015/1/7	3226
2015/1/8	3029
2015/1/9	2859
2015/1/10	2870
2015/1/11	2910
2015/1/12	3012
2015/1/13	3142
2015/1/14	3252
2015/1/15	3342
2015/1/16	3365
2015/1/17	3339
2015/1/18	3345
2015/1/19	3421
2015/1/20	3443
2015/1/21	3428
2015/1/22	3554
2015/1/23	3615
2015/1/24	3646
2015/1/25	3614
2015/1/26	3574
2015/1/27	3635
2015/1/28	3738
2015/1/29	3707
2015/1/30	3827
2015/1/31	4039
2015/2/1	4210
2015/2/2	4493
2015/2/3	4560
2015/2/4	4637
2015/2/5	4755
2015/2/6	4817