B站学习记录:
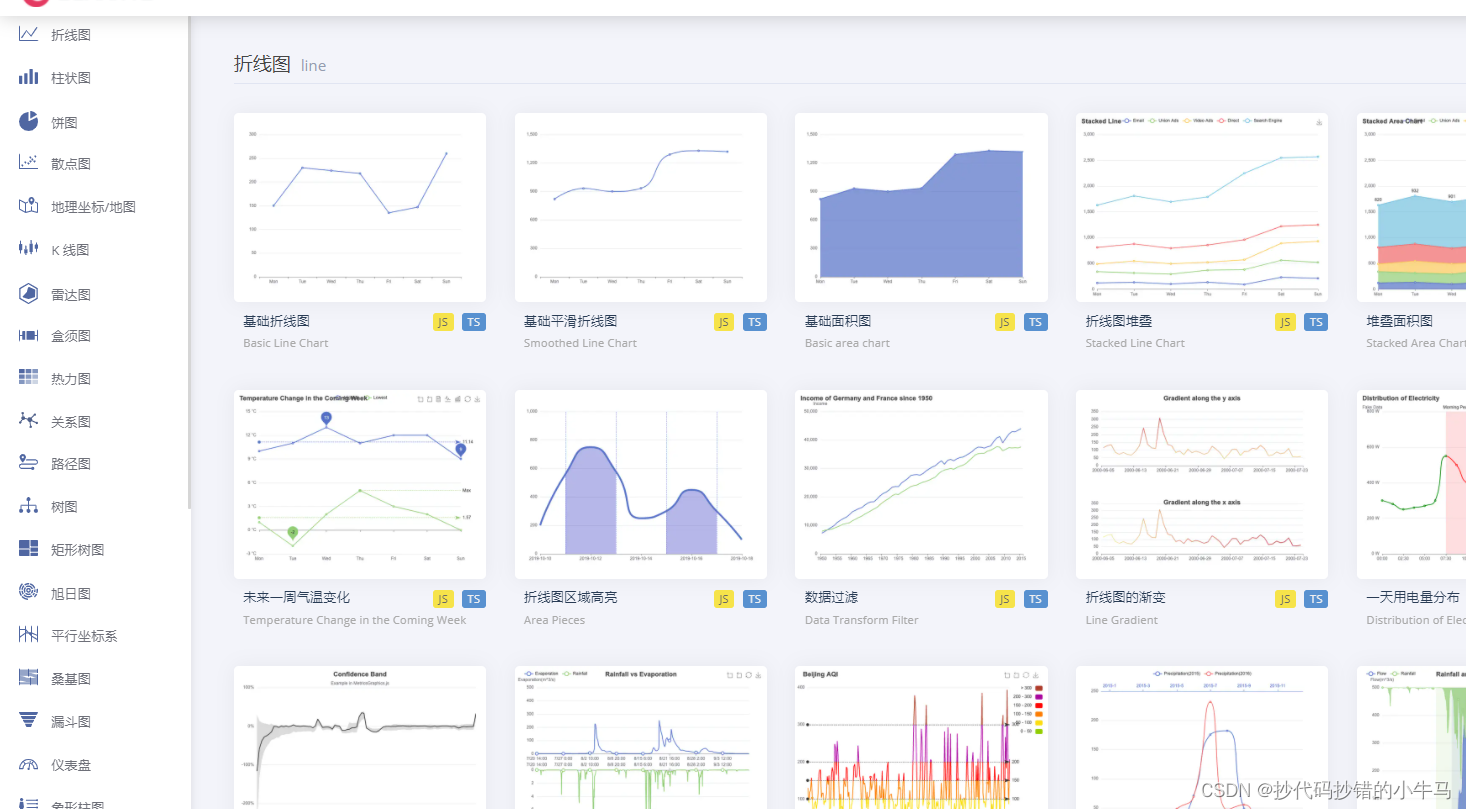
echarts官网:https://echarts.apache.org/examples/zh/index.html
官网上有很多可视化例子:

py
"""
2022年

CSDN:抄代码抄错的小牛马
"""
from flask import Flask, render_template
import pandas as pd

app = Flask(__name__)
app.config.from_object(__name__)
app.config["JSON_AS_ASCII"] = False


@app.route("/")
def show():
    data = pd.read_csv("1.csv")
    # print(data)
    data = data.rename(columns={"电影名称":"name","累计票房(万)":"value"})
    # data = data.rename(columns={"电影名称": "name", '累计票房(万)': "value", '场均人次': "value"})

    data = data.to_dict(orient="records")
    print(data)

    return render_template("show.html",data=data)


if __name__ == '__main__':
    app.run(debug=True)
HTML
 <!DOCTYPE html>
<html lang="en">
<head>
    <meta charset="UTF-8">
    <title>展示</title>
    <!-- 引入 ECharts 文件 -->
    <script src="https://cdn.bootcdn.net/ajax/libs/echarts/5.3.2/echarts.min.js"></script>
</head>
<body>
    <center>
    <div id="main" style="width:800px; height:600px; background:pink " ></div>
    <script type="text/javascript" >
        var myChart = echarts.init(document.getElementById('main'));
        var option = {
              backgroundColor: '#2c343c',
              title: {
                text: '艺恩票房',
                left: 'center',
                top: 20,
                textStyle: {
                  color: '#ccc'
                }
              },
              tooltip: {
                trigger: 'item'
              },
              visualMap: {
                show: false,
                min: 1,
                max: 60000000000,
                inRange: {
                  colorLightness: [0, 1]
                }
              },
              series: [
                {
                  name: '累计票房(万)',
                  type: 'pie',
                  radius: '55%',
                  center: ['50%', '50%'],
                  data:{{data|tojson}}.sort(function (a, b) {
                    return a.value - b.value;
                  }),
                  roseType: 'radius',
                  label: {
                    color: 'rgba(255, 255, 255, 0.3)'
                  },
                  labelLine: {
                    lineStyle: {
                      color: 'rgba(255, 255, 255, 0.3)'
                    },
                    smooth: 0.2,
                    length: 10,
                    length2: 20
                  },
                  itemStyle: {
                    color: '#c23531',
                    shadowBlur: 200,
                    shadowColor: 'rgba(0, 0, 0, 0.5)'
                  },
                  animationType: 'scale',
                  animationEasing: 'elasticOut',
                  animationDelay: function (idx) {
                    return Math.random() * 200;
                  }
                }
              ]
            };
            myChart.setOption(option);


    </script>
    </center>
</body>
</html>
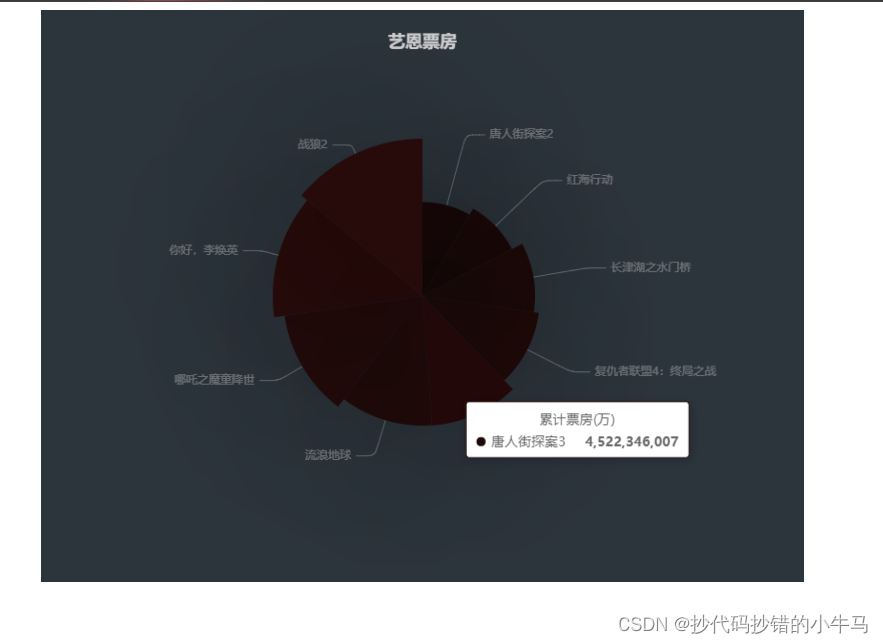
最终效果:

拜~~