01_认识折线统计图
以折线的上升或下降来表示统计数量的增减变化的统计图,叫作折线统计图。折线统计图用折线的起伏表示数据的增减变化情况。不仅可以表示数量的多少,而且可以反映数据的增减变化情况。
折线统计图在生活中运用的非常普遍,虽然它不直接给出精确的数据,但只要掌握了一定的技巧,熟练运用“坐标法”也可以很快地确定某个具体的数据。折线统计图在显示数据变化情况方面是十分优秀的。
02_Matplotlib Pyplot
Pyplot 是 Matplotlib 的子库,提供了和 MATLAB 类似的绘图 API。
Pyplot 是常用的绘图模块,能很方便让用户绘制 2D 图表。
Pyplot 包含一系列绘图函数的相关函数,每个函数会对当前的图像进行一些修改,这个上期饼图有讲过,不再多讲(上期传送门)。
使用的时候,我们可以使用 import 导入 pyplot 库,并设置一个别名 plt:
import matplotlib.pyplot as plt
我们可以使用 pyplot 中的 plot() 方法来绘制折线图。
plot() 语法格式如下:
matplotlib.pyplot.plot([x], y, [fmt], data=None, **kwargs)
参数说明:
- x:一维数组,表示x轴数据。
- y:一维数组,表示y轴数据。
- fmt:字符串,用来定义图的基本属性:颜?(color),点型(marker),线型(linestyle),具体形式:
# fmt = '[color][marker][line]'
matplotlib.pyplot.plot([x], y, '[marker][color][line]', data=
None, **kwargs)
!!!fmt参数详解!!!
-
markers :
'.'point marker 点状
','pixel marker 像素
'o'circle marker 圆形
'v'triangle_down marker 倒三角
'^'triangle_up marker 三角型
'<'triangle_left marker 左三角
'>'triangle_right marker 右三角
'1'tri_down marker 三平分线(向下)
'2'tri_up marker 三平分线(向上)
'3'tri_left marker 三平分线(向左)
'4'tri_right marker 三平分线(向右)
'8'octagon marker 八边形
's'square marker 正方形
'p'pentagon marker 五边形
'P'plus (filled) marker 十字架
'*'star marker 五角星
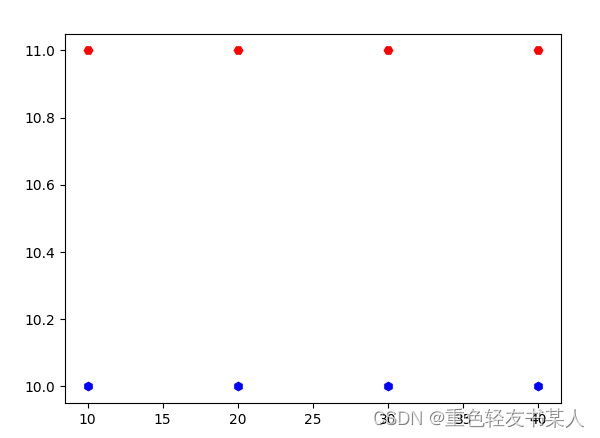
'h'hexagon1 marker 六边形1号
'H'hexagon2 marker 六边形2号六边形1号(蓝色)与2号(红色)的区别:
'+'plus marker 加号
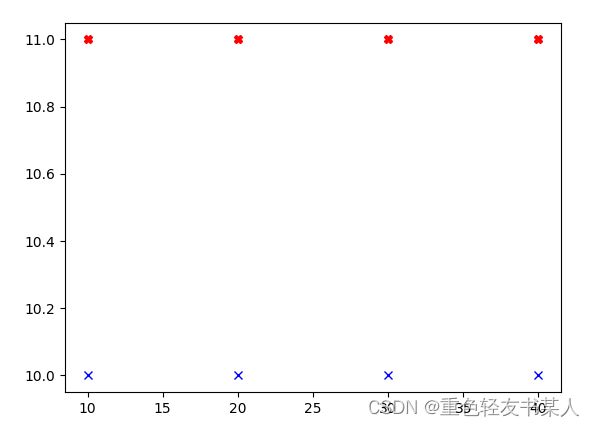
'x'x marker 叉号1号
'X'x (filled) marker 叉号2号叉号1号(蓝色)与2号(红色)的区别:
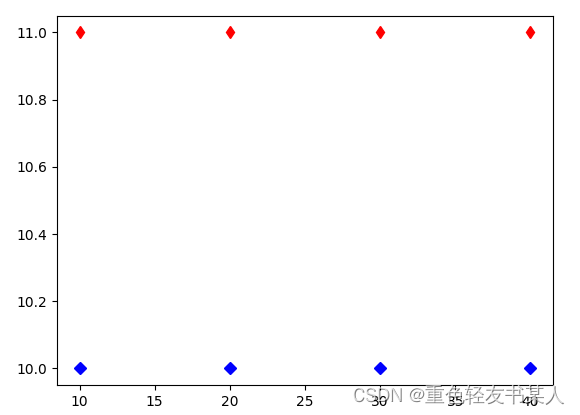
'D'diamond marker 菱形1号
'd'thin_diamond marker 菱形2号菱形1号(蓝色)与2号的区别:
'|'vline marker 竖线
'_'hline marker 横线 -
colors 颜色:
'b'blue 蓝色
'g'green 绿色
'r'red 红色
'c'cyan 青色
'm'magenta 洋红
'y'yellow 黄色
'k'black 黑色
'w'white 白色 -
lines:
'-'solid line style 实线
'--'dashed line style 长虚线
'-.'dash-dot line style 点划线
':'dotted line style 短虚线
03_折线图绘制
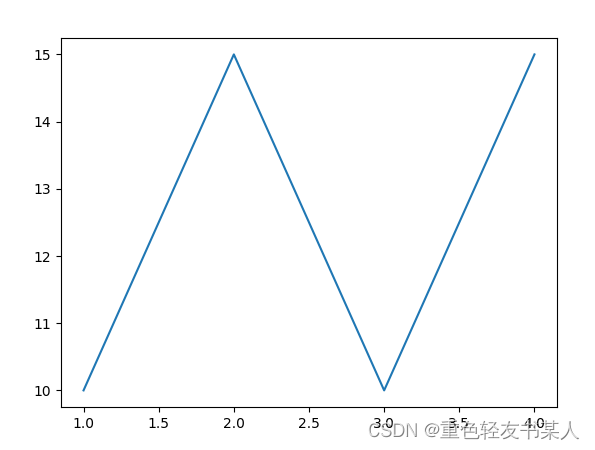
下面我们用plot()函数来创建一个简单的折线图:
# 导入库
import matplotlib.pyplot as plt
# 数据准备
x = [1, 2, 3, 4]
y = [10, 15, 10, 15]
# 绘制折线图
plt.plot(x, y)
# 显示折线图
plt.show()
成功!
04_复式折线图
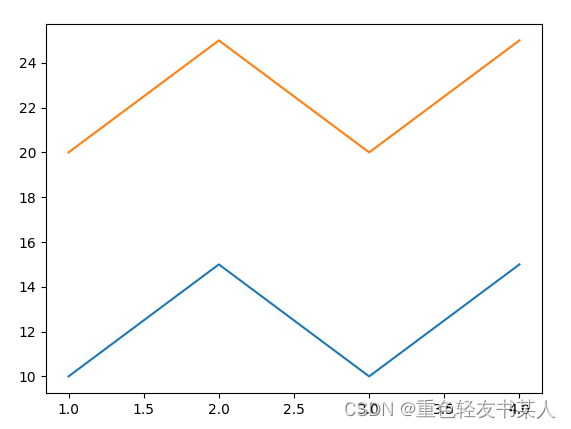
简单!多一行代码实现!
# 导入库
import matplotlib.pyplot as plt
# 数据准备
x1 = [1, 2, 3, 4]
y1 = [10, 15, 10, 15]
x2 = [4, 3, 2, 1]
y2 = [25, 20, 25, 20]
# 绘制折线图
plt.plot(x1, y1)
plt.plot(x2, y2)
# 显示折线图
plt.show()
成果:
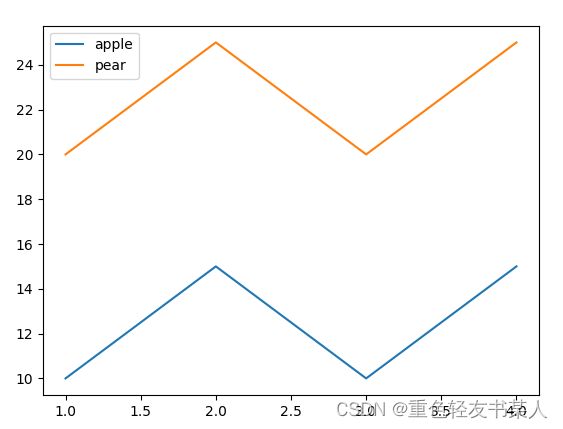
为了使阅读更加清楚,我们加上标识:
# 导入库
import matplotlib.pyplot as plt
# 数据准备
x1 = [1, 2, 3, 4]
y1 = [10, 15, 10, 15]
x2 = [4, 3, 2, 1]
y2 = [25, 20, 25, 20]
# 绘制折线图
plt.plot(x1, y1)
plt.plot(x2, y2)
plt.legend(['apple', 'pear'])
# 显示折线图
plt.show()
掌声在哪里!
06_折线图进阶
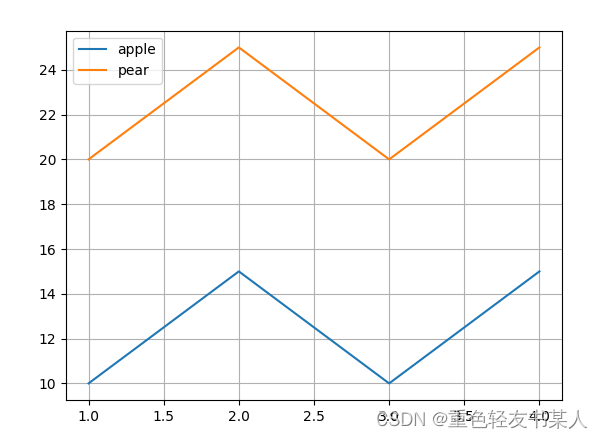
1.行列线
# 导入库
import matplotlib.pyplot as plt
# 数据准备
x1 = [1, 2, 3, 4]
y1 = [10, 15, 10, 15]
x2 = [4, 3, 2, 1]
y2 = [25, 20, 25, 20]
# 绘制折线图
plt.plot(x1, y1)
plt.plot(x2, y2)
plt.legend(['apple', 'pear'])
# 绘制行列线
plt.grid()
# 显示折线图
plt.show()
展示:
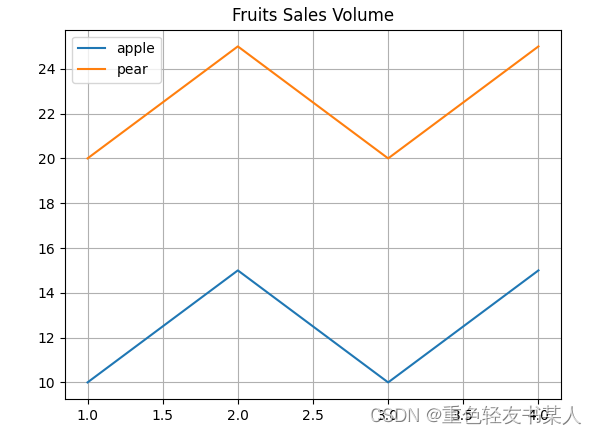
2.标题
# 导入库
import matplotlib.pyplot as plt
# 数据准备
x1 = [1, 2, 3, 4]
y1 = [10, 15, 10, 15]
x2 = [4, 3, 2, 1]
y2 = [25, 20, 25, 20]
# 绘制折线图
plt.plot(x1, y1)
plt.plot(x2, y2)
plt.legend(['apple', 'pear'])
# 绘制行列线
plt.grid()
# 绘制标题
plt.title('Fruits')
# 显示折线图
plt.show()
展示:
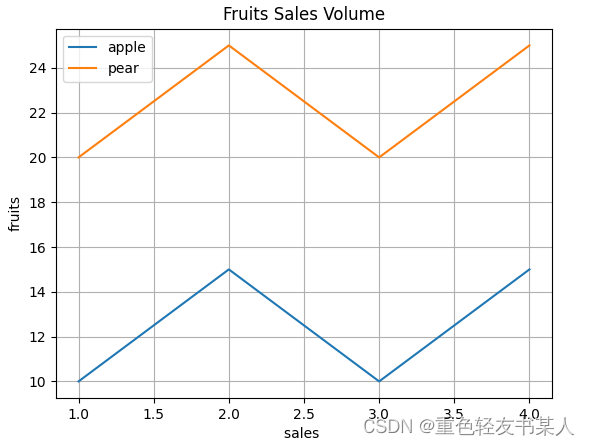
3.添加横竖标题
# 导入库
import matplotlib.pyplot as plt
# 数据准备
x1 = [1, 2, 3, 4]
y1 = [10, 15, 10, 15]
x2 = [4, 3, 2, 1]
y2 = [25, 20, 25, 20]
# 绘制折线图
plt.plot(x1, y1)
plt.plot(x2, y2)
plt.legend(['apple', 'pear'])
# 绘制行列线
plt.grid()
# 绘制标题
plt.title('Fruits Sales Volume')
# 绘制横竖标题
plt.xlabel('sales ')
plt.ylabel('fruits')
# 显示折线图
plt.show()
展示:
到此为止!期待下期!