你真的知道什么是正弦和余弦吗?使用 Python 和 Turtle 可视化数学
可以在tutle官方文档、python库之turtle库官方文档入门和python库之turtle库例子详细了解turtle模块的使用
正弦和余弦无处不在。但并不是每个人都真正了解他们是什么。在本文中,您将使用该turtle模块编写一个 Python 程序,以可视化它们与圆的关系。然而,返回的信息超越了正弦和余弦。它是关于更普遍地使用 Python 代码可视化数学。
可视化数学关系或科学过程可以帮助研究和理解这些主题。这是科学家时经常使用的工具。
这是您将在本文结束时创建的动画:
正弦和余弦如何与圆相连?
在开始编写代码之前,让我们看看为什么使用 Python 可视化数学会很有用。在这种情况下,您正在探索许多数学领域的关键构建块之一——正弦和余弦。
你知道sin( x )和 cos( x ) 是什么样子的。但是它们是如何与圆联系起来的呢?
再看一遍上面的视频……
蓝点以恒定的角速度绕圆周运动。它的运动是平稳的,圆点不减速也不加速。
现在,看看黄点。你能看出黄点和蓝点之间的联系吗?
如果你仔细看,你会注意到黄点沿着一条垂直线上下移动。忽略似乎从点移出的痕迹。现在只关注点。
黄点的垂直位置跟踪蓝点的垂直位置。黄点的x坐标不变,但它的y坐标始终与蓝点的相同。
这是接下来要注意的事情。黄点的速度是恒定的吗?还是加速和减速?
您可能已经注意到,当它穿过中心线时,当它处于上下移动的中间时,黄点移动得最快。然后它在到达顶部或底部时减速,改变方向,然后再次向中心加速。
当您记住蓝点以恒定速度移动时,这是有道理的。当黄点位于顶部或底部时,蓝点主要水平移动。因此,当蓝点靠近圆的顶部和底部时,它的垂直移动很小或为零。
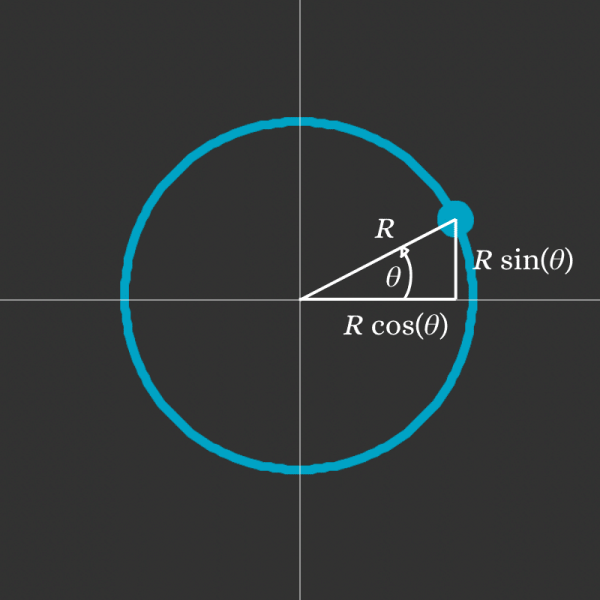
黄点的*y坐标跟随 sin(𝜃)。*下图显示了角度𝜃:
![[外链图片转存失败,源站可能有防盗链机制,建议将图片保存下来直接上传(img-94S4t6IR-1660131299300)(https://i0.wp.com/thepythoncodingbook.com/wp-content/uploads/2022/05/angle.png?fit=800%2C800&ssl=1)]](https://img-blog.csdnimg.cn/6b77a3ff1e614888bceb816642cf5248.png)
该角度是从x轴到将点连接到中心的半径测量的。
你可以看到正弦曲线的形状从黄点留下的痕迹中显现出来。
我已经详细讨论了黄点。红点呢?这个点正在跟踪蓝点的水平位置。它的x坐标遵循 cos(𝜃)。
对,所以如果你只对正弦和余弦的可视化以及它们与圆的关系感兴趣,那么我们就完成了。
但是,如果您也对使用 Python 可视化数学感兴趣,那么请继续阅读……
设置海龟计划
您将在此程序中使用 Python的turtle模块 可视化数学。该模块允许您以相对简单的方式进行绘图。它是 Python 标准库的一部分,所以如果你已经安装了 Python,你的计算机上就已经有了这个模块。
如果您以前从未使用过此模块,请不要担心。我将解释您将使用的功能和方法。
您可以首先导入模块并创建运行动画的窗口:
import turtle

window = turtle.Screen()
window.bgcolor(50 / 255, 50 / 255, 50 / 255)

turtle.done()
调用turtle.Screen()创建了一个名为window 的屏幕实例。
您还可以更改其背景颜色。默认情况下,turtle将颜色的红色、绿色和蓝色分量表示为0 和 1之间的浮点数。尽管您可以更改模式以使用0 和255 之间的整数,但将 RGB 值除以255 也同样容易。我们将在此动画中使用暗模式外观!
最后一行,turtle.done(),在程序绘制完其他所有内容后保持窗口打开。如果没有这一行,程序将在到达末尾时终止并关闭窗口。
turtle模块中的主要绘图对象是turtle.Turtle(). 您可以在屏幕上移动乌龟进行绘制。要在动画中绘制圆圈,您需要创建一个海龟。您还可以为圆的半径设置一个变量:
import turtle

radius = 100

window = turtle.Screen()
window.bgcolor(50 / 255, 50 / 255, 50 / 255)

main_dot = turtle.Turtle()
main_dot.pensize(5)
main_dot.shape("circle")
main_dot.color(0, 160 / 255, 193 / 255)
main_dot.penup()
main_dot.setposition(0, -radius)
main_dot.pendown()

turtle.done()
创建海龟后,更改“笔”的大小,以便海龟稍后在程序中绘制线条时,这些线条将比默认值粗。您还可以更改海龟本身的形状。"circle"在 using 时使用参数.shape(),它将海龟的形状设置为一个点。
接下来,您将颜色设置为蓝色并抬起笔,这样您就可以将海龟移动到其起始位置,而无需在海龟移动时画线。您将海龟保持在x=0,但将y坐标更改为半径的负值。这会将点向下移动。此步骤可确保圆的中心位于窗口的中心,因为当您绘制圆时,圆点将逆时针旋转。
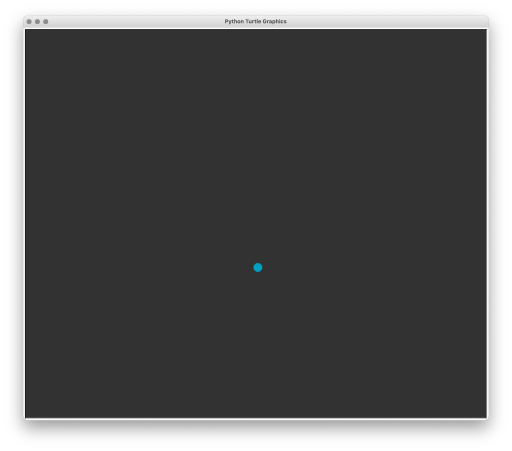
运行此代码时,您会在深灰色背景上看到蓝点:

绕圈走
接下来,您可以使圆点绕一圈。使用turtle模块可以通过多种方式实现此目的。但是,您将在此处使用.circle()方法。此方法有一个必需的radius参数 ,它确定圆的大小。
你可以写main_dot.circle(radius)。但是,这将一口气画出整个圆圈。你想把它分解成更小的步骤,因为你需要在这个主点的每个位置执行其他任务。
您可以在.circle()中使用可选extent参数。此参数确定绘制多大的圆。尝试main_dot.circle(radius, 180)画一个半圆,然后尝试其他角度。
在这个项目中,您可以设置一个名为angular_speed的变量,在while循环的每次迭代中绘制一小部分圆圈:
import turtle

radius = 100
angular_speed = 2

window = turtle.Screen()
window.tracer(0)
window.bgcolor(50 / 255, 50 / 255, 50 / 255)

main_dot = turtle.Turtle()
main_dot.pensize(5)
main_dot.shape("circle")
main_dot.color(0, 160 / 255, 193 / 255)
main_dot.penup()
main_dot.setposition(0, -radius)
main_dot.pendown()

while True:
    main_dot.circle(radius, angular_speed)

    window.update()

turtle.done()
点将在while循环的每次迭代中绘制一个小圆弧。由于您设置angluar_speed为2,因此海龟将在每次迭代中绘制 2o 的圆。
您还可以在创建窗口后立即进行window.tracer(0)设置。这会停止海龟在屏幕上绘制的每一步延迟。相反,它使您可以控制何时更新屏幕。您在while循环结束时添加window.update()以在每次迭代时更新一次屏幕。循环的一次迭代相当于动画的一帧。
使用window.tracer(0)andwindow.update()可以让您更好地控制动画并加快绘图速度,尤其是当程序需要绘制很多东西时。
运行代码时,您会看到圆点围绕着一个圆转圈:
在这个阶段不要担心点的速度。当您已经准备好其他所有内容时,您将在接近尾声时处理动画的整体速度。但是,如果要减慢速度,angular_speed可以使用较小的值。
跟踪蓝点的垂直运动
您现在可以创建另一个海龟来跟踪蓝点的垂直运动。您将把这个点变成黄色并将其移到圆圈的右侧:
import turtle

radius = 100
angular_speed = 2

window = turtle.Screen()
window.tracer(0)
window.bgcolor(50 / 255, 50 / 255, 50 / 255)

main_dot = turtle.Turtle()
main_dot.pensize(5)
main_dot.shape("circle")
main_dot.color(0, 160 / 255, 193 / 255)
main_dot.penup()
main_dot.setposition(0, -radius)
main_dot.pendown()

vertical_dot = turtle.Turtle()
vertical_dot.shape("circle")
vertical_dot.color(248 / 255, 237 / 255, 49 / 255)
vertical_dot.penup()
vertical_dot.setposition(
    main_dot.xcor() + 2 * radius,
    main_dot.ycor(),
)

while True:
    main_dot.circle(radius, angular_speed)

    vertical_dot.sety(main_dot.ycor())

    window.update()

turtle.done()
您使用main_dot 的位置作为参考来设置vertical_dot 的初始位置。main_dot.xcor()和main_dot.ycor()方法返回海龟的x和y坐标。如果您将主圆圈移动到屏幕的不同部分,vertical_dot将随之移动,因为您将vertical_dot的位置链接到main_dot。
您添加2 * radius到main_dot的x-坐标,这样vertical_dot离圆心的距离总是两倍于圆在x轴上的长。
You add
2 * radiustomain_dot‘s *x-*coordinate so thatvertical_dotis always twice as far from the centre of the circle as the circle’s circumference on the *x-*axis.
在while循环中,您使用vertical_dot.sety()更改vertical_dot的y坐标。这个点跟踪main_dot的y坐标,这意味着在屏幕上main_dot和vertical_dot将始终具有相同的高度。
运行此代码时,您可以看到黄点跟踪蓝点的垂直位置:
顺便说一句,您现在还可以删除代码末尾的turtle.done()调用,因为您有一个无限循环正在运行,因此程序永远不会终止。我将在下一个代码片段中删除此调用。
跟踪蓝点的水平运动
您可以按照上面相同的模式来跟踪蓝点的水平运动。在这种情况下,您可以将点的颜色设置为红色并将其放在圆圈下方:
import turtle

radius = 100
angular_speed = 2

window = turtle.Screen()
window.tracer(0)
window.bgcolor(50 / 255, 50 / 255, 50 / 255)

main_dot = turtle.Turtle()
main_dot.pensize(5)
main_dot.shape("circle")
main_dot.color(0, 160 / 255, 193 / 255)
main_dot.penup()
main_dot.setposition(0, -radius)
main_dot.pendown()

vertical_dot = turtle.Turtle()
vertical_dot.shape("circle")
vertical_dot.color(248 / 255, 237 / 255, 49 / 255)
vertical_dot.penup()
vertical_dot.setposition(
    main_dot.xcor() + 2 * radius,
    main_dot.ycor(),
)

horizontal_dot = turtle.Turtle()
horizontal_dot.shape("circle")
horizontal_dot.color(242 / 255, 114 / 255, 124 / 255)
horizontal_dot.penup()
horizontal_dot.setposition(
    main_dot.xcor(),
    main_dot.ycor() - radius,
)

while True:
    main_dot.circle(radius, angular_speed)

    vertical_dot.sety(main_dot.ycor())

    horizontal_dot.setx(main_dot.xcor())

    window.update()
您将horizontal_dot的初始位置设置为低于 main_dot一个radius距离。回想一下,蓝点从最低点开始画圆。在while循环中,horizontal_dot是跟踪main_dot的x坐标。因此,蓝点和红点始终共享相同的x轴位置。
动画现在有黄点和红点跟踪蓝点:
您已经可以看到,虽然蓝点在圆周上匀速移动,但黄点和红点在移动时会加速和减速。
你可以在这里停下来。或者您可以进一步阅读以在黄色和红色点上添加轨迹,以更详细地显示它们的速度如何变化。
在黄点和红点上添加痕迹
接下来,您将获得黄色和红色点在每次循环迭代中在绘图画布上留下的标记。然后这些标记将向外移动,为下一次迭代中由点绘制的新标记让路。
让我们首先关注黄点。您可以通过克隆vertical_dot来创建新海龟并隐藏实际的海龟。然后,您可以创建一组*x-值来表示黄点的x-*位置和窗口右侧边缘之间的所有点:
import turtle

radius = 100
angular_speed = 2

window = turtle.Screen()
window.tracer(0)
window.bgcolor(50 / 255, 50 / 255, 50 / 255)

main_dot = turtle.Turtle()
main_dot.pensize(5)
main_dot.shape("circle")
main_dot.color(0, 160 / 255, 193 / 255)
main_dot.penup()
main_dot.setposition(0, -radius)
main_dot.pendown()

vertical_dot = turtle.Turtle()
vertical_dot.shape("circle")
vertical_dot.color(248 / 255, 237 / 255, 49 / 255)
vertical_dot.penup()
vertical_dot.setposition(
    main_dot.xcor() + 2 * radius,
    main_dot.ycor(),
)

vertical_plot = vertical_dot.clone()
vertical_plot.hideturtle()
start_x = int(vertical_plot.xcor())
# Get range of x-values from position of dot to edge of screen
x_range = range(start_x, window.window_width() // 2 + 1)
# Create a list to store the y-values to draw at each
# point in x_range.
vertical_values = [None for _ in x_range]
# You can populate(填充) the first item in this list
# with the dot's starting height
vertical_values[0] = vertical_plot.ycor()

horizontal_dot = turtle.Turtle()
horizontal_dot.shape("circle")
horizontal_dot.color(242 / 255, 114 / 255, 124 / 255)
horizontal_dot.penup()
horizontal_dot.setposition(
    main_dot.xcor(),
    main_dot.ycor() - radius,
)

while True:
    main_dot.circle(radius, angular_speed)

    vertical_dot.sety(main_dot.ycor())

    horizontal_dot.setx(main_dot.xcor())

    window.update()
该变量x_range存储从黄点的x位置到屏幕边缘的所有点。在此示例中,我使用了所有像素。但是,如果您更喜欢使用这些点的子集,例如每两个像素中的一个,则可以在使用range()时使用可选step参数。如果动画变得过于缓慢,使用较少的点可以加快动画的速度,但也会改变动画显示的正弦曲线的频率。
您还创建了vertical_values长度由x_range 中的点数确定的列表。此列表中的每个项目都将包含需要绘制的*y坐标。*除第一项外,所有这些值最初都设置为None。
蓝点将在while循环中的每次迭代中移动。因此,黄点也是如此。接下来,您需要在vertical_values列表中填充黄点的新y坐标。但是,首先,您需要将所有现有值向前移动。第一项变成第二项,第二项变成第三项,以此类推。
让我们先试试这个方法:
import turtle

radius = 100
angular_speed = 2

window = turtle.Screen()
window.tracer(0)
window.bgcolor(50 / 255, 50 / 255, 50 / 255)

main_dot = turtle.Turtle()
main_dot.pensize(5)
main_dot.shape("circle")
main_dot.color(0, 160 / 255, 193 / 255)
main_dot.penup()
main_dot.setposition(0, -radius)
main_dot.pendown()

vertical_dot = turtle.Turtle()
vertical_dot.shape("circle")
vertical_dot.color(248 / 255, 237 / 255, 49 / 255)
vertical_dot.penup()
vertical_dot.setposition(
    main_dot.xcor() + 2 * radius,
    main_dot.ycor(),
)

vertical_plot = vertical_dot.clone()
vertical_plot.hideturtle()
start_x = int(vertical_plot.xcor())
# Get range of x-values from position of dot to edge of screen
x_range = range(start_x, window.window_width() // 2 + 1)
# Create a list to store the y-values to draw at each
# point in x_range.
vertical_values = [None for _ in x_range]
# You can populate the first item in this list
# with the dot's starting height
vertical_values[0] = vertical_plot.ycor()

horizontal_dot = turtle.Turtle()
horizontal_dot.shape("circle")
horizontal_dot.color(242 / 255, 114 / 255, 124 / 255)
horizontal_dot.penup()
horizontal_dot.setposition(
    main_dot.xcor(),
    main_dot.ycor() - radius,
)

while True:
    main_dot.circle(radius, angular_speed)

    vertical_dot.sety(main_dot.ycor())

    # Delete the turtle’s drawings from the screen. Do not move turtle.
    # 海龟的状态和位置以及其他海龟的绘图不受影响。
    vertical_plot.clear()
    # Shift all values one place to the right
    vertical_values[2:] = vertical_values[
        : len(vertical_values) - 1
    ]
    # Record the current y-value as the first item
    # in the list
    vertical_values[0] = vertical_dot.ycor()
    # Plot all the y-values
    for x, y in zip(x_range, vertical_values):
        if y is not None:
            vertical_plot.setposition(x, y)
            vertical_plot.dot(5)

    horizontal_dot.setx(main_dot.xcor())

    window.update()
一旦将vertical_values中所有y值向右移动了一个位置并在列表的开头添加了新的*y坐标,就可以在屏幕上绘制所有点。*您可以使用 Python 的zip()函数进行同时循环x_range和vertical_values。
您在画布上根据存储在列表中的每个x位置的y坐标绘制一个点。请注意,您还在每次迭代中调用vertical_plot.clear()以从动画的前一帧清除绘图。
您将值移动到列表中的右侧,以便您可以在开头添加一个新项目。对于列表,这不是一个有效的过程。您将在本文后面修改这一点,以使用更适合此任务的数据结构。但就目前而言,您可以坚持使用这种方法。
目前的动画是这样的:
向红点添加跟踪
在红点上添加痕迹的过程非常相似。唯一的区别是您是垂直向下移动以获得轨迹而不是向右移动。
您可以为红点复制上面的过程:
import turtle

radius = 100
angular_speed = 2

window = turtle.Screen()
window.tracer(0)
window.bgcolor(50 / 255, 50 / 255, 50 / 255)

main_dot = turtle.Turtle()
main_dot.pensize(5)
main_dot.shape("circle")
main_dot.color(0, 160 / 255, 193 / 255)
main_dot.penup()
main_dot.setposition(0, -radius)
main_dot.pendown()

vertical_dot = turtle.Turtle()
vertical_dot.shape("circle")
vertical_dot.color(248 / 255, 237 / 255, 49 / 255)
vertical_dot.penup()
vertical_dot.setposition(
    main_dot.xcor() + 2 * radius,
    main_dot.ycor(),
)

vertical_plot = vertical_dot.clone()
vertical_plot.hideturtle()
start_x = int(vertical_plot.xcor())
# Get range of x-values from position of dot to edge of screen
x_range = range(start_x, window.window_width() // 2 + 1)
# Create a list to store the y-values to draw at each
# point in x_range.
vertical_values = [None for _ in x_range]
# You can populate the first item in this list
# with the dot's starting height
vertical_values[0] = vertical_plot.ycor()

horizontal_dot = turtle.Turtle()
horizontal_dot.shape("circle")
horizontal_dot.color(242 / 255, 114 / 255, 124 / 255)
horizontal_dot.penup()
horizontal_dot.setposition(
    main_dot.xcor(),
    main_dot.ycor() - radius,
)

horizontal_plot = horizontal_dot.clone()
horizontal_plot.hideturtle()
start_y = int(horizontal_plot.ycor())
y_range = range(start_y, -window.window_height() // 2 - 1, -1)
horizontal_values = [None for _ in y_range]
horizontal_values[0] = horizontal_plot.xcor()

while True:
    main_dot.circle(radius, angular_speed)

    vertical_dot.sety(main_dot.ycor())
    vertical_plot.clear()
    # Shift all values one place to the right
    vertical_values[2:] = vertical_values[
        : len(vertical_values) - 1
    ]
    # Record the current y-value as the first item
    # in the list
    vertical_values[0] = vertical_dot.ycor()
    # Plot all the y-values
    for x, y in zip(x_range, vertical_values):
        if y is not None:
            vertical_plot.setposition(x, y)
            vertical_plot.dot(5)

    horizontal_dot.setx(main_dot.xcor())
    horizontal_plot.clear()
    horizontal_values[2:] = horizontal_values[
        : len(horizontal_values) - 1
    ]
    horizontal_values[0] = horizontal_dot.xcor()
    for x, y in zip(horizontal_values, y_range):
        if x is not None:
            horizontal_plot.setposition(x, y)
            horizontal_plot.dot(5)

    window.update()
请注意,当您使用range()创建y_range时,使用第三个可选参数step并将其设置为-1. 这样做是因为它在处理负值时y_range正在减少。
使用双端队列而不是列表
让我从本节的前言开始。您可以忽略它并继续阅读本文的下一部分。您在此处对代码所做的更改不会对您的程序产生太大影响。然而,这是一个探索 Pythondeque数据结构的机会。
我在本博客的第一篇文章中详细介绍了双端队列以及它们如何在堆栈和队列中使用。您还可以在另一篇文章中阅读有关此主题的更多信息。
简而言之,将列表中的项目改为元组效率并不高。Python 提供了一种双端队列数据结构,称为deque. 这个数据结构是collections模块的一部分。
双端队列允许您使用.appendleft()方法有效地在序列的开头添加项目。当您在双端队列上使用.pop()时,序列的最后一项会“弹出”。
因此,您可以重构代码以使用deque. 我还将窗口设置为方形:
import collections
import turtle

radius = 100
angular_speed = 2

window = turtle.Screen()
window.setup(1000, 1000)
window.tracer(0)
window.bgcolor(50 / 255, 50 / 255, 50 / 255)

main_dot = turtle.Turtle()
main_dot.pensize(5)
main_dot.shape("circle")
main_dot.color(0, 160 / 255, 193 / 255)
main_dot.penup()
main_dot.setposition(0, -radius)
main_dot.pendown()

vertical_dot = turtle.Turtle()
vertical_dot.shape("circle")
vertical_dot.color(248 / 255, 237 / 255, 49 / 255)
vertical_dot.penup()
vertical_dot.setposition(
    main_dot.xcor() + 2 * radius,
    main_dot.ycor(),
)

vertical_plot = vertical_dot.clone()
vertical_plot.hideturtle()
start_x = int(vertical_plot.xcor())
# Get range of x-values from position of dot to edge of screen
x_range = range(start_x, window.window_width() // 2 + 1)
# Create a list to store the y-values to draw at each
# point in x_range.
vertical_values = collections.deque(None for _ in x_range)
# You can populate the first item in this list
# with the dot's starting height
vertical_values[0] = vertical_plot.ycor()

horizontal_dot = turtle.Turtle()
horizontal_dot.shape("circle")
horizontal_dot.color(242 / 255, 114 / 255, 124 / 255)
horizontal_dot.penup()
horizontal_dot.setposition(
    main_dot.xcor(),
    main_dot.ycor() - radius,
)

horizontal_plot = horizontal_dot.clone()
horizontal_plot.hideturtle()
start_y = int(horizontal_plot.ycor())
y_range = range(start_y, -window.window_height() // 2 - 1, -1)
horizontal_values = collections.deque(None for _ in y_range)
horizontal_values[0] = horizontal_plot.xcor()

while True:
    main_dot.circle(radius, angular_speed)

    vertical_dot.sety(main_dot.ycor())
    vertical_plot.clear()
    # Add new value at the start, and delete last value
    vertical_values.appendleft(vertical_dot.ycor())
    vertical_values.pop()
    # Plot all the y-values
    for x, y in zip(x_range, vertical_values):
        if y is not None:
            vertical_plot.setposition(x, y)
            vertical_plot.dot(5)

    horizontal_dot.setx(main_dot.xcor())
    horizontal_plot.clear()
    horizontal_values.appendleft(horizontal_dot.xcor())
    horizontal_values.pop()
    for x, y in zip(horizontal_values, y_range):
        if x is not None:
            horizontal_plot.setposition(x, y)
            horizontal_plot.dot(5)

    window.update()
动画现在差不多完成了:
请注意,本文中显示的视频是为了显示目的而加速的。动画的速度会因您的设置而异。您可能会注意到动画会在一段时间后变慢,因为它需要在两条轨迹中绘制更多的点。如果您愿意,可以将每帧减慢到较慢的帧速率来避免这种情况。以下部分将指导您完成此操作的一种方法。
设置动画的帧速率
要获得更流畅的动画,您可以选择帧速率并确保每一帧的运行速度永远不会超过所需的速度。目前,每一帧所花费的时间取决于程序能够以多快的速度执行while循环中的所有操作。每帧花费的时间的一个重要贡献者是屏幕上图形的显示。
您可以设置一个在每一帧开始时开始的计时器,然后确保在继续动画循环的下一次迭代之前已经过去了足够的时间:
import collections
import time
import turtle

radius = 100
angular_speed = 2

fps = 12  # Frames per second
time_per_frame = 1 / fps

window = turtle.Screen()
window.setup(1000, 1000)
window.tracer(0)
window.bgcolor(50 / 255, 50 / 255, 50 / 255)

main_dot = turtle.Turtle()
main_dot.pensize(5)
main_dot.shape("circle")
main_dot.color(0, 160 / 255, 193 / 255)
main_dot.penup()
main_dot.setposition(0, -radius)
main_dot.pendown()

vertical_dot = turtle.Turtle()
vertical_dot.shape("circle")
vertical_dot.color(248 / 255, 237 / 255, 49 / 255)
vertical_dot.penup()
vertical_dot.setposition(
    main_dot.xcor() + 2 * radius,
    main_dot.ycor(),
)

vertical_plot = vertical_dot.clone()
vertical_plot.hideturtle()
start_x = int(vertical_plot.xcor())
# Get range of x-values from position of dot to edge of screen
x_range = range(start_x, window.window_width() // 2 + 1)
# Create a list to store the y-values to draw at each
# point in x_range.
vertical_values = collections.deque(None for _ in x_range)
# You can populate the first item in this list
# with the dot's starting height
vertical_values[0] = vertical_plot.ycor()

horizontal_dot = turtle.Turtle()
horizontal_dot.shape("circle")
horizontal_dot.color(242 / 255, 114 / 255, 124 / 255)
horizontal_dot.penup()
horizontal_dot.setposition(
    main_dot.xcor(),
    main_dot.ycor() - radius,
)

horizontal_plot = horizontal_dot.clone()
horizontal_plot.hideturtle()
start_y = int(horizontal_plot.ycor())
y_range = range(start_y, -window.window_height() // 2 - 1, -1)
horizontal_values = collections.deque(None for _ in y_range)
horizontal_values[0] = horizontal_plot.xcor()

while True:
    frame_start = time.time()
    main_dot.circle(radius, angular_speed)

    vertical_dot.sety(main_dot.ycor())
    vertical_plot.clear()
    # Add new value at the start, and delete last value
    vertical_values.appendleft(vertical_dot.ycor())
    vertical_values.pop()
    # Plot all the y-values
    for x, y in zip(x_range, vertical_values):
        if y is not None:
            vertical_plot.setposition(x, y)
            vertical_plot.dot(5)

    horizontal_dot.setx(main_dot.xcor())
    horizontal_plot.clear()
    horizontal_values.appendleft(horizontal_dot.xcor())
    horizontal_values.pop()
    for x, y in zip(horizontal_values, y_range):
        if x is not None:
            horizontal_plot.setposition(x, y)
            horizontal_plot.dot(5)

    # Wait until minimum frame time reached
    while time.time() - frame_start < time_per_frame:
        pass
    window.update()
每秒的帧数是12,也就是说每帧的最小时间是 1/12 = 0.083s。在动画while循环开始时启动计时器。然后,您添加另一个while循环,该循环一直等到所需的时间过去后才结束主while循环迭代。
请注意,这并不能保证帧长度为 0.083 秒。如果while循环中的操作需要更长的时间来运行,那么帧将持续更长的时间。它确实保证一帧不能短于 0.083 秒。
如果您仍然注意到您的动画在初始帧之后变慢,您需要将帧速率设置为较低的值。您可以通过在代码中添加frame_overrun来检查您的帧是否超限:
# ...

while True:
    frame_start = time.time()
    frame_overrun = True
    main_dot.circle(radius, angular_speed)

    vertical_dot.sety(main_dot.ycor())
    vertical_plot.clear()
    # Add new value at the start, and delete last value
    vertical_values.appendleft(vertical_dot.ycor())
    vertical_values.pop()
    # Plot all the y-values
    for x, y in zip(x_range, vertical_values):
        if y is not None:
            vertical_plot.setposition(x, y)
            vertical_plot.dot(5)

    horizontal_dot.setx(main_dot.xcor())
    horizontal_plot.clear()
    horizontal_values.appendleft(horizontal_dot.xcor())
    horizontal_values.pop()
    for x, y in zip(horizontal_values, y_range):
        if x is not None:
            horizontal_plot.setposition(x, y)
            horizontal_plot.dot(5)

    # Wait until minimum frame time reached
    while time.time() - frame_start < time_per_frame:
        frame_overrun = False
    if frame_overrun:
        print("Frame overrun")
    window.update()
重温数学
使用 Python 可视化数学有助于更好地理解数学概念。现在,让我们将这个动画的观察结果与我们知道的数学联系起来。
根据正弦和余弦的一般定义,我们可以将直角三角形的对边、相邻和斜边与角 𝜃 联系起来:

在上图中,三角形的顶点与环绕圆圈的蓝点重合。圆的半径为R。蓝球离x轴的高度是R sin(𝜃),离y轴的水平距离是R cos(𝜃)。
你写的动画复制了这个结果。
您可以通过更改变量来更改正弦和余弦的幅度radius。您可以通过更改angular_speed来更改频率:
上:radius = 50,,angular_speed = 2。中:radius = 100, angular_speed = 2, 下:radius = 100,angular_speed = 4
最后的话
在本文中,您使用 Python 的turtle模块编写了一个程序来探索正弦和余弦如何与圆联系起来。通过跟踪圆点的垂直和水平位置,您已经演示了正弦和余弦函数。这些函数经常出现在许多数学应用程序中。
该turtle模块并不总是使用 Python 可视化数学的最佳工具。它很少是!
在NumPy等包的帮助下,可视化库(如Matplotlib)最适合于此。因此,如果您打算使用 Python 进行更多的数学可视化,您应该更加熟悉这些库!
def draw_cs():
(678条消息) Python绘图Turtle库,改变原点坐标,建立平面直角坐标系(一)_peipei12138的博客-CSDN博客