目录
本章导读
 ?
?
?环境配置

?
?0.2 设置样式
?
?如果想永久的设置样式,可以用下面#的方法
?0.3 图像另存为文件
?
?一,matplotilb库
?1.1 折线图
?
?
?
?绘制多条

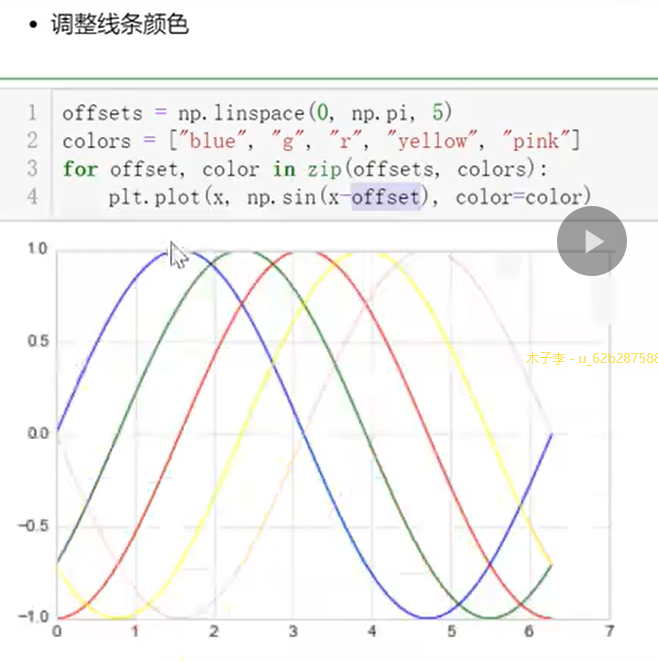
?1.1.1 调整线条颜色与风格
?
?
?
?

?

?
?
?

?1.1 调整坐标轴
? 
?
?
axis前俩个设置x 后俩个y

?紧凑
?
?扁平
?
?
?
?
?
?
?
?
?
?改变了字体大小
?
?
?
?

?frame的作用可以加个框框

?
?
?
?
?1.2 散点图

?
?
?


?
?![]()
from random import choice

class RandomWalk():
#     '''生成一个随机漫步的类'''

    def __init__(self,num_points=5000):
        self.num_points = num_points
        self.x_values = [0]
        self.y_values = [0]
    def fill_walk(self):
        while len(self.x_values) < self.num_points:
            x_direction = choice([-1,1])
            x_distance = choice([0,1,2,3,4])
            x_step = x_direction*x_distance

            y_direction = choice([-1,1])
            y_distance = choice([0,1,2,3,4])
            y_step = y_direction*y_distance

            if x_step ==0 or y_step == 0:
                continue
            next_x = self.x_values[-1] + x_step
            next_y = self.y_values[-1] + y_step
            self.x_values.append(next_x)
            self.y_values.append(next_y)


rw = RandomWalk(10000)
rw.fill_walk()
point_numbers = list(range(rw.num_points))
plt.figure(figsize=(12,6))   #设置画布的大小
plt.scatter(rw.x_values, rw.y_values, c=point_numbers,cmap="inferno",s=1)
plt.colorbar()
plt.scatter(0,0,c="green",s=100)
plt.scatter(rw.x_values[-1],rw.y_values[-1],c="red",s=100)

plt.xticks([])
plt.yticks([])
?1.3 柱形图
?
?
?
?
?
?
?![]()

?
 ?
?
?
?
?1.4 多子图
?![]()

?
?![]()
?
?

?
1.5直方图
?

?

?
?
?

?![]()
%matplotlib inline
import matplotlib.pyplot as plt
import numpy as np
mu ,si = 100,15
x = mu+si*np.random.randn(10000)

plt.hist(x,50,density=True, cumulative=True, color="r")
plt.xlabel("x")
plt.ylabel("y")
plt.xlim(50,165)
plt.ylim(0,1.1)
?
? ![]()
class Die():
#     """模拟一个骰子的类"""
    "模拟一个骰子的类"
    def __init__(self,num_sides=6):
        self.num_sides = num_sides

    def roll(self):
        return np.random.randint(1, self.num_sides+1)

die = Die()
results = []
for i in range(60000):
    result = die.roll()
    results.append(result)

plt.hist(results,bins=6,range=(0.75,6.75),align="mid",width=0.5)
plt.xlim(0,7)
'''重复两次投'''
die1 = Die()
die2 = Die()
results = []
for i in range(1000):
result = die1.roll()+die2.roll()
results.append(result)
plt.hist(results, bins=11, range=(1.75, 12.75), align="mid", width=0.5)
plt.xlim(1,13)
plt.xticks(np.arange(1,14))1.6 误差图
x=np.linspace(0,10,50)
dy=0.5
y=np.sin(x) + dy*np.random.random(50)

plt.errorbar(x,y,yerr=dy,fmt="*r")
?
?柱形误差图
menMeans = np.random.randint(10,30,size=5)
womenMeans = np.random.randint(10,30,size=5)
menStd = np.random.randint(1,6,size=5)
womenStd = np.random.randint(1,6,size=5)
# print( menMeans)
# print( womenStd)
ind = ["Gi","G2","G3","G4","G5"]
width = 0.35

p1 = plt.bar(ind, menMeans, width=width, label="Men",yerr=menStd)
p2 = plt.bar(ind, womenMeans, width=width, bottom=menMeans, label="WoMen", yerr=womenStd)

plt.ylabel("scores")
plt.title('score by group and gender')
plt.yticks(np.arange(0,81,10))
plt.legend()
?1.7 面向对象的风格介绍
?普通图
x = np.linspace(0,5,10)
y = x**2

fig = plt.figure(figsize=(8,4),dpi=80)  #画布大小8*4,像素dpi=80
axes = fig.add_axes([0.1,0.1,0.8,0.8])  #轴 left,bottom ,width,hight(range=0-1)

axes.plot(x,y,"--r")
axes.set_xlabel('x')
axes.set_ylabel('y')
axes.set_title('y=x^2')
?画中画
?

?多子图
?

?1.8 三维图像简介
?点与线
from mpl_toolkits import mplot3d

ax = plt.axes(projection="3d")
zline = np.linspace(0,15,1000)
xline = np.sin(zline)
yline = np.cos(zline)
ax.plot3D(xline,yline,zline)

zdata = 15*np.random.random(100)
xdata = np.sin(zdata)
ydata = np.cos(zdata)
# ax.plot3D(xdata,ydata,zdata)
ax.scatter3D(xdata, ydata, zdata,c=zdata, cmap="spring")
三维曲面
def f(x,y):
    return np.sin(np.sqrt(x**2+y**2))

x = np.linspace(-6,6,30)
y = np.linspace(-6,6,30)
X,Y = np.meshgrid(x,y)
Z = f(X,Y)

ax = plt.axes(projection="3d")
ax.plot_surface(X,Y,Z,cmap="viridis")

?seaborn库-文艺青年的最爱

?先看看plt的库
x = np.linspace(0,10,500)
y=np.cumsum(np.random.randn(500,6),axis=0)

with plt.style.context("classic"):
    plt.plot(x,y)
    plt.legend("ABCDEF",ncol=2,loc="upper left")
?
?来看看sns的
import seaborn as sns

x = np.linspace(0,10,500)
y=np.cumsum(np.random.randn(500,6),axis=0)

sns.set()
plt.plot(x,y)
plt.legend("ABCDEF",ncol=2,loc="upper left")
?
?
?![]()
iris = sns.load_dataset("iris")
iris.head()
?

?含有4个维度的量
sns.pairplot(data=iris,hue="species")?生成4*4个维度之间线性关系的图(与自己的是这3种花的概率分布)
Pandas中绘图函数概览
?
?
?
?
?
?
?
?
?
?
?

?
?
?
?
散点图

 ?
?
?房价和工资之间的相关性
?
![]()
?
?

?知识点回顾

?

