日常学习记录——pycharm+tensorflow简单图像识别
写在前面
使用pycharm+tensorflow实现对bus和taxi数据集进行识别和分类,具体参考文献如下:
1 具体实现教程: Python深度学习之图像识别。
2 开发平台搭建教程:Win-10 安装 TensorFlow-GPU。
3 实验数据集来源:深度学习训练自己的数据集(车辆图像识别分类)。
1 实验代码
import os
from PIL import Image
import numpy as np
import matplotlib.pyplot as plt
import tensorflow as tf
from tensorflow import keras
from sklearn.model_selection import train_test_split

# 导入bus图片
filedir = 'E:/My Word/Downloads/train/bus/'
os.listdir(filedir)
file_list1 = []
for root, dirs, files in os.walk(filedir):
    for file in files:
        if os.path.splitext(file)[1] == '.jpg':
            file_list1.append(os.path.join(root, file))
            print(root, file)
            print(len(root))

# 批量改变图片像素
for filename in file_list1:
    try:
        im = Image.open(filename)
        new_im = im.resize((128, 128))
        new_im.save('E:/My Word/CNN/bus_128/' + filename[31:-4] + '.jpg')
        print('图片' + filename[12:-4] + '.jpg' + '像素转换完成')
    except OSError as e:
        print(e.args)

# 重新建立新图像列表
filedir = 'E:/My Word/CNN/bus_128/'
os.listdir(filedir)

file_list_1 = []
for root, dirs, files in os.walk(filedir):
    for file in files:
        if os.path.splitext(file)[1] == '.jpg':
            file_list_1.append(os.path.join(root, file))

# 导入taxi图片
filedir = 'E:/My Word/Downloads/train/taxi/'
os.listdir(filedir)
file_list2 = []
for root, dirs, files in os.walk(filedir):
    for file in files:
        if os.path.splitext(file)[1] == '.jpg':
            file_list2.append(os.path.join(root, file))
            print(root, file)
            print(len(root))

# 批量改变图片像素
for filename in file_list2:
    try:
        im = Image.open(filename)
        new_im = im.resize((128, 128))
        new_im.save('E:/My Word/CNN/taxi_128/' + filename[31:-4] + '.jpg')
        print('图片' + filename[12:-4] + '.jpg' + '像素转换完成')
    except OSError as e:
        print(e.args)

# 重新建立新图像列表
filedir = 'E:/My Word/CNN/taxi_128/'
os.listdir(filedir)

file_list_2 = []
for root, dirs, files in os.walk(filedir):
    for file in files:
        if os.path.splitext(file)[1] == '.jpg':
            file_list_2.append(os.path.join(root, file))

# 合并列表数据
file_list_all = file_list_1 + file_list_2

# 将图片数据转为数组
M = []
width, height = 0, 0
for filename in file_list_all:
    im = Image.open(filename)
    width, height = im.size
    im_L = im.convert("L")
    Core = im_L.getdata()
    arr1 = np.array(Core, dtype='float32') / 255.0
    np.shape(arr1)
    list_img = arr1.tolist()
    M.extend(list_img)

X = np.array(M).reshape(len(file_list_all), width, height)
np.shape(X)

class_names = ['bus', 'taxi']
# 用字典存储标签信息
dict_label = {0: 'bus', 1: 'taxi'}
print(dict_label[0])
print(dict_label[1])
# 用列表输入标签,0表示bus,1表示taxi
label = [0] * len(file_list_1) + [1] * len(file_list_2)
y = np.array(label)

# 按照4:1划分训练集和数据集
train_images, test_images, train_labels, test_labels = train_test_split(X, y, test_size=0.2, random_state=0)

# 显示来自训练集的前25个图像,并显示类名
# 验证数据格式是否正确,准备构建神经网络
plt.figure(figsize=(10, 10))
for i in range(25):
    plt.subplot(5, 5, i + 1)
    plt.xticks([])
    plt.yticks([])
    plt.grid(False)
    plt.imshow(train_images[i], cmap=plt.cm.binary)
    plt.xlabel(class_names[train_labels[i]])
plt.show()

# 训练神经网络
# 第一个输入层有128个节点
# 第二层是两个节点的softmax层——返回2个概率分数的数组,其和为1.
# 每个节点包含一个分数,表示当前图像属于两个类别的概率。
model = keras.Sequential([
    keras.layers.Flatten(input_shape=(128, 128)),
    keras.layers.Dense(128, activation=tf.nn.relu),
    keras.layers.Dense(2, activation=tf.nn.softmax)
])

model.compile(optimizer=tf.keras.optimizers.Adam(),
              loss='sparse_categorical_crossentropy',
              metrics=['accuracy'])

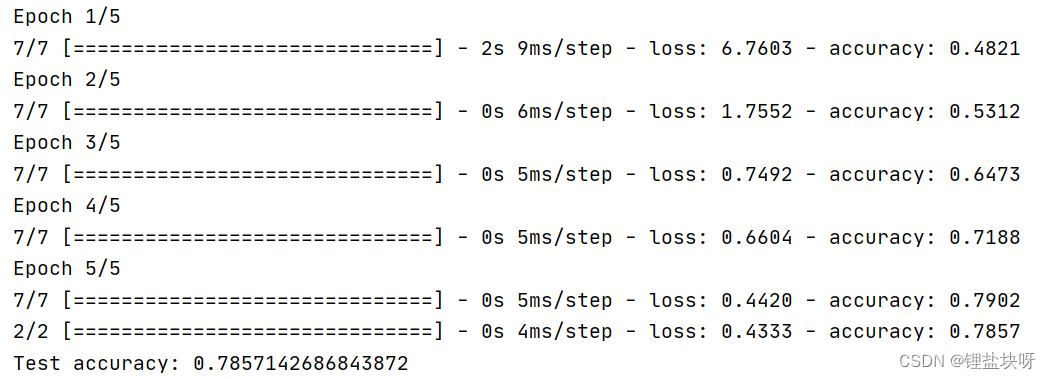
model.fit(train_images, train_labels, epochs=5)
test_loss, test_acc = model.evaluate(test_images, test_labels)
print('Test accuracy:', test_acc)


# 定义画图函数
def plot_image(i, predictions_array, true_label, img):
    predictions_array, true_label, img = predictions_array[i], true_label[i], img[i]
    plt.grid(False)
    plt.xticks([])
    plt.yticks([])
    plt.imshow(img, cmap=plt.cm.binary)
    predicted_label = np.argmax(predictions_array)
    if predicted_label == true_label:
        color = '#00bc57'
    else:
        color = 'red'
    plt.xlabel("{} {:2.0f}% ({})".format(class_names[predicted_label],
                                         100 * np.max(predictions_array),
                                         class_names[true_label]),
               color=color)


def plot_value_array(i, predictions_array, true_label):
    predictions_array, true_label = predictions_array[i], true_label[i]
    plt.grid(False)
    plt.xticks([])
    plt.yticks([])
    thisplot = plt.bar(range(len(class_names)), predictions_array,
                       color='#FF7F0E', width=0.2)
    plt.ylim([0, 1])
    predicted_label = np.argmax(predictions_array)

    thisplot[predicted_label].set_color('red')
    thisplot[true_label].set_color('#00bc57')


# 预测单个
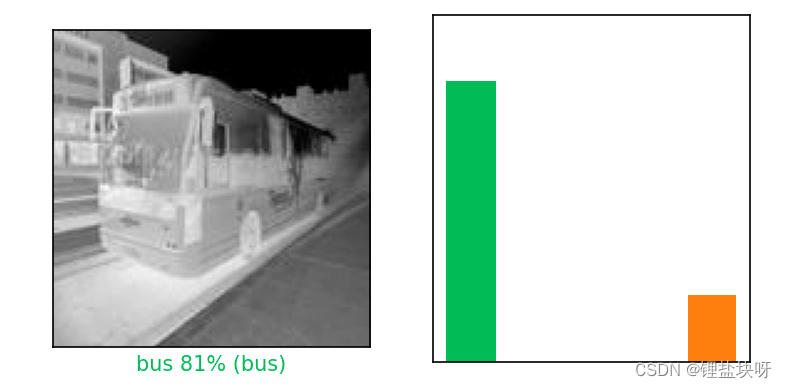
i = 29
plt.figure(figsize=(6, 3))
plt.subplot(1, 2, 1)
plot_image(i, predictions, test_labels, test_images)
plt.subplot(1, 2, 2)
plot_value_array(i, predictions, test_labels)
plt.show()

# 集中预测
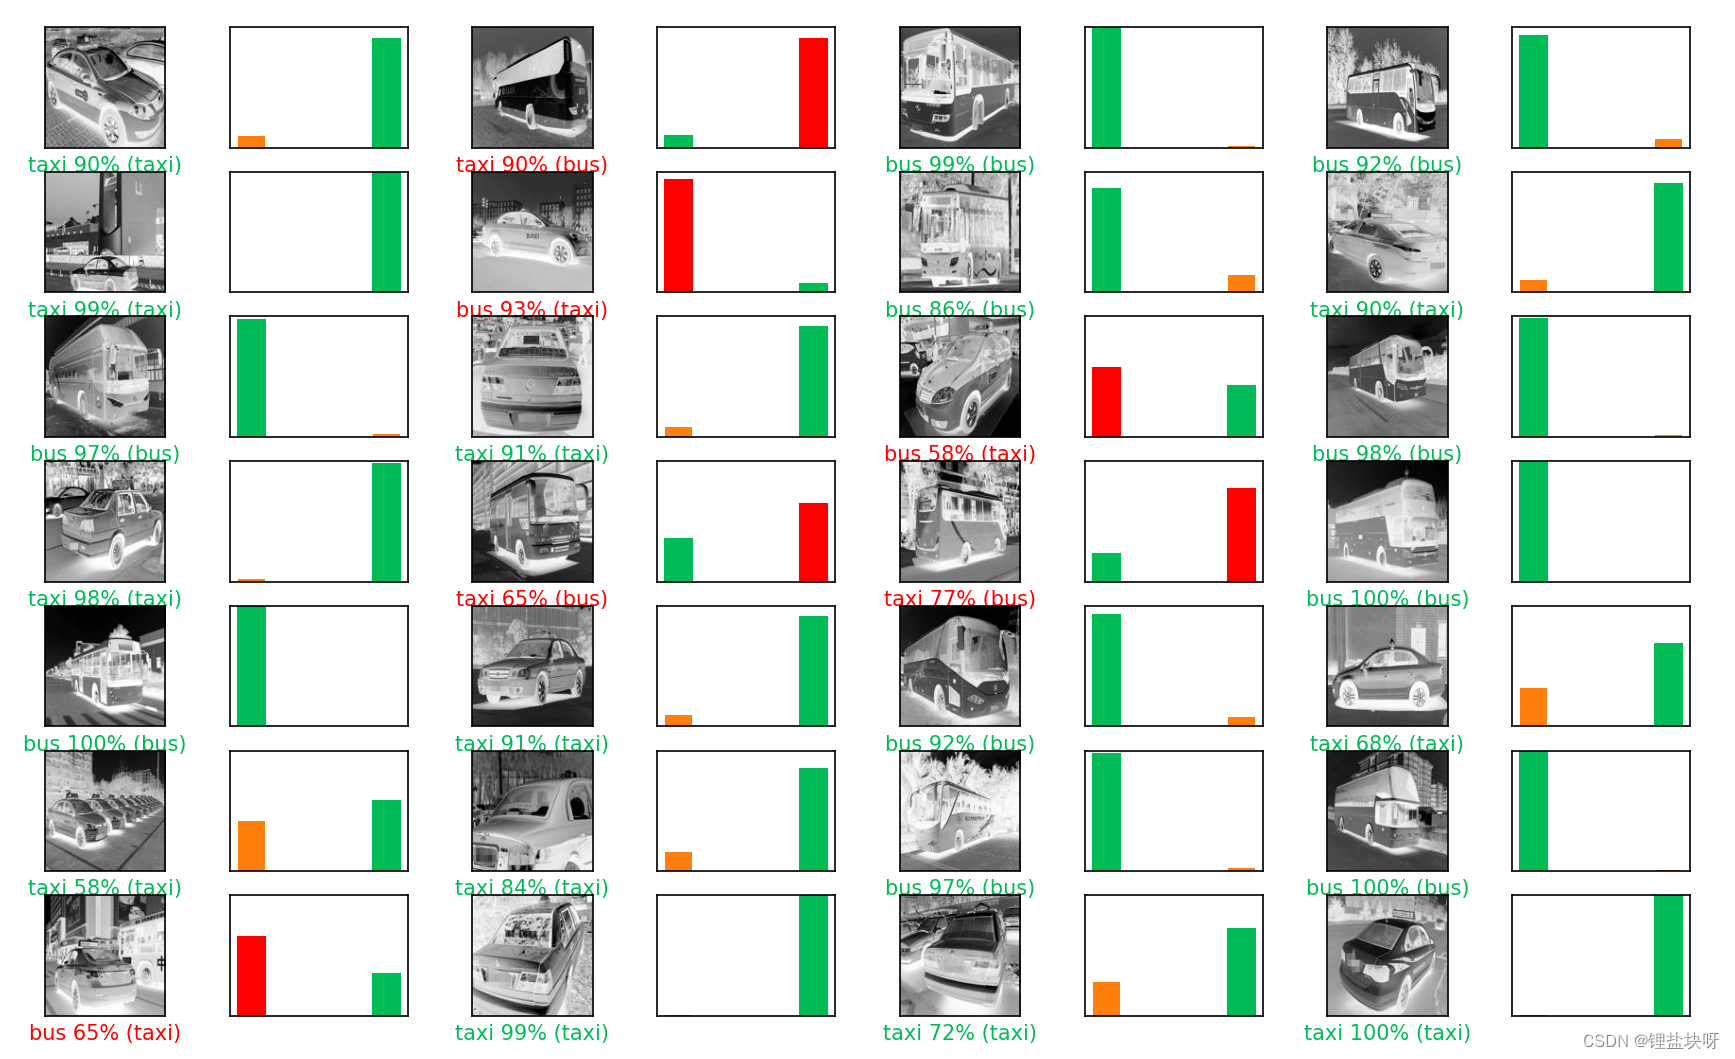
num_rows = 7
num_cols = 4
num_images = num_rows * num_cols
plt.figure(figsize=(2 * 2 * num_cols, 2 * num_rows))
for i in range(num_images):
    plt.subplot(num_rows, 2 * num_cols, 2 * i + 1)
    plot_image(i, predictions, test_labels, test_images)
    plt.subplot(num_rows, 2 * num_cols, 2 * i + 2)
    plot_value_array(i, predictions, test_labels)
plt.show()
2 实验结果
2.1 测试集的正确率

2.2 单个预测结果
对测试集第29张图片进行预测和判断:

2.3 集体预测结果
对测试集前32张图片进行预测:

总结与标记
1、总结:今天花了很多时间在配置开发环境上面,具体代码实现的时间和开发环境搭建的时间是差不多的。
2、标记:目前只是对bus和taxi进行了二分类识别的情况。