上期文章见:Python Cartopy地图投影【1】
上期文章内容纲要:
step1: 开始地图投影
step2: GeoAxes 的常用方法
2.1 add_feature:添加海岸线、河流、湖泊等地理特征
2.2 gridlines:添加网格线以及相应标签等
这期内容继续
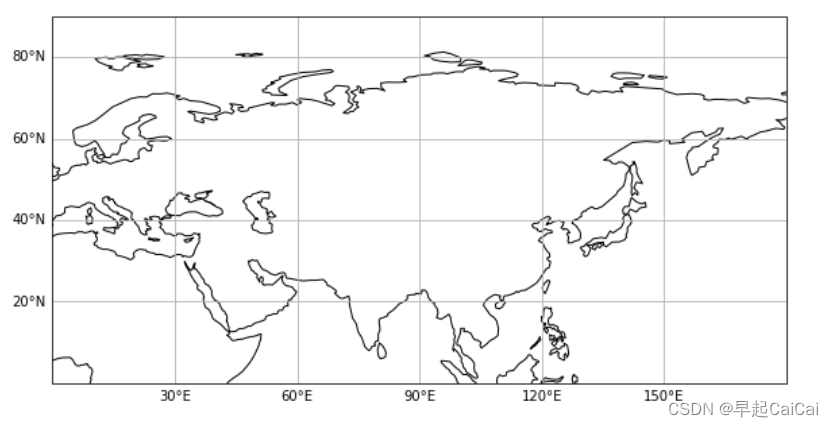
2.3 set_extent:设置地理边界
这个方法是用于设置GeoAxes的范围(上下左右边界)。
语法格式:
axes.gridlines(extents, crs=None)
在这里
extents:范围,格式为(x0, x1, y0, y1) ,分别对应左右下上的经纬度边界
crs: 投影。若不设置则默认为ax1的投影
设置边界范围的图【代码见最后】

2.4 set_boundary:裁剪子图形状
语法格式:
axes.set_boundary(path, transform=None)
关于这个函数的使用,我们将在接下来的兰伯特投影和极地投影中举例介绍。
3 三种常见地图投影与实用技巧
我们针对不同的研究范围需要使用不同的地图投影,以保证关注范围的图形变形最小。比如我们关注北极地区,那我们则通常使用极地投影,比如我们关注全球范围,则我们更多使用最基础的等距投影。所以我们要掌握这些常见投用的使用方法来应对不同的情况。
3.1 等距网格投影 PlateCarree
语法:
cartopy.crs.PlateCarree(central_longitude=0.0)
- central_longitude:中心经度。默认为 0°
见下图,中心经度分别为0度(左)和180度(右)【代码见最后】

需要说明的是,如果我们同时使用了 set_extent 方法来规定地图的范围(左右边界),那么我们实际上无需通过 central_longitude 来设置中心经度,因为会自动计算左右边界的中心值。
当我们没有特殊需求时,我们一般都是用这个投影方式来进行绘制的。
3.2 兰伯特投影 LambertConformal
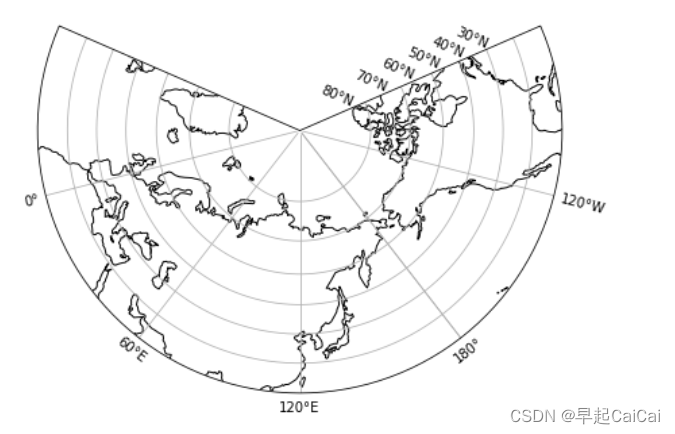
兰伯特投影一般用于展示中高纬度区域的图形,因为中高纬度区域在这种投影下变形较小。
语法:
cartopy.crs.LambertConformal(central_longitude=- 96.0, central_latitude=39.0, cutoff=- 30)
- central_longitude,central_latitude:投影中心的经度和纬度,默认分别为 96°W 和 39°N
- cutoff:最南的纬度,默认为 30°S
这张图其实也是360度,
这时候设置边界不能用set_extent 函数,可用set_boundary,上图提到

3.3 NorthPolarStereo (北)极地投影
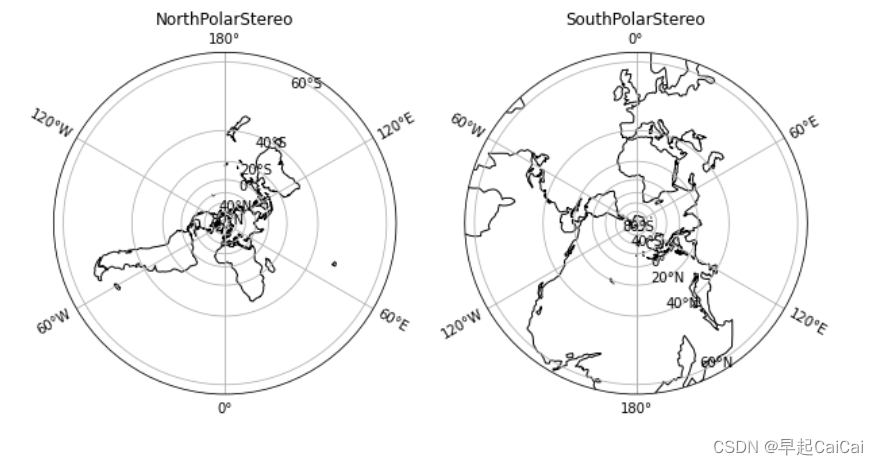
如果我们需要关注整个经度范围的高纬度区域时,我们会选择极地投影,特别是研究海冰,南北极气候的读者会非常频繁地运用到这个投影。这里我们以北极极地投影为例,若需调整为南极极地投影,只需将 North 关键字替换为 South。
语法:
cartopy.crs.NorthPolarStereo(central_longitude=0.0)
此时圆了【代码见最后】

代码
2.3
# 绘制东北半球地图
# 导入库
import matplotlib.pyplot as plt  # 调用matplotlib.pyplot模块,用于调用基础绘图函数
import cartopy.crs as ccrs  # 调用cartopy.crs模块,用于创建投影
import cartopy.feature as cfeature  # 调用cartopy.feature模块,引入默认地理信息
# 创建图形
fig = plt.figure(figsize=[10, 5])  # 设置图片大小10x5
# 创建1行1列的1个子图,使用等距网格投影
ax1 = fig.add_subplot(1, 1, 1, projection=ccrs.PlateCarree())
ax1.add_feature(cfeature.COASTLINE)  # 添加海岸线
gl = ax1.gridlines(
    draw_labels=True,
    dms=True,
    x_inline=False,
    y_inline=False)  # 绘制网格线
gl.top_labels = False  # 通过对gridliner对象,这里即为gl变量进行设置,关闭顶部标签
gl.right_labels = False  # 通过对gridliner对象,这里即为gl变量进行设置,关闭右侧标签
ax1.set_extent([0, 180, 0, 90])  # 将图形范围设置为东北半球
plt.show()
3.1
# 不同中心经度的等距网格投影
# 导入库
import matplotlib.pyplot as plt  # 调用matplotlib.pyplot模块,用于调用基础绘图
import cartopy.crs as ccrs  # 调用cartopy.crs模块,用于创建投影
import cartopy.feature as cfeature  # 调用cartopy.feature模块,引入默认地理信息
import cartopy.mpl.ticker as cticker  # 调用cartopy.mpl.ticker模块,用于修改经纬度刻度格式

# 创建图形
fig = plt.figure(figsize=[10, 5])  # 设置图片大小10x5
# 创建一个默认的等距网格投影子图
ax1 = fig.add_subplot(1, 2, 1, projection=ccrs.PlateCarree(
    central_longitude=0))  # 创建1行2列的1个子图,使用等距网格投影,中心经度0°
ax1.add_feature(cfeature.COASTLINE)  # 添加海岸线
# 创建一个中心经度为120°E的等距网格投影子图
ax2 = fig.add_subplot(1, 2, 2, projection=ccrs.PlateCarree(
    central_longitude=180))  # 创建1行1列的1个子图,使用等距网格投影,中心经度180°
ax2.add_feature(cfeature.COASTLINE)  # 添加海岸线
plt.show()
3.2
# 绘制兰伯特投影
# 导入库
import matplotlib.pyplot as plt  # 调用matplotlib.pyplot模块,用于调用基础绘图函数
import cartopy.crs as ccrs  # 调用cartopy.crs模块,用于创建投影
import cartopy.feature as cfeature  # 调用cartopy.feature模块,引入默认地理信息

# 创建图形
fig = plt.figure(figsize=[10, 5])  # 设置图片大小10x5
ax1 = fig.add_subplot(
    1, 1, 1, projection=ccrs.LambertConformal(
        central_longitude=120, cutoff=20))  # 创建兰伯特投影子图
ax1.add_feature(cfeature.COASTLINE)  # 添加海岸线
gl = ax1.gridlines(
    draw_labels=True,
    dms=True,
    x_inline=False,
    y_inline=False)  # 添加网格线
gl.top_labels = False  # 通过对gridliner对象,这里即为gl变量进行设置,关闭顶部标签
plt.show()
3.3
# 基础北极、南极极地投影绘制
# 导入库
import matplotlib.pyplot as plt  # 调用matplotlib.pyplot模块,用于调用基础绘图函数
import cartopy.crs as ccrs  # 调用cartopy.crs模块,用于创建投影

fig = plt.figure(figsize=[10, 5])  # 设置图片大小10x5

# 北极极地投影
# 创建1行2列的1个子图,使用北极地投影
ax1 = fig.add_subplot(1, 2, 1, projection=ccrs.NorthPolarStereo())
ax1.add_feature(cfeature.COASTLINE)  # 添加海岸线
gl1 = ax1.gridlines(draw_labels=True, x_inline=False, y_inline=True)  # 添加网格栅格线
ax1.set_title('NorthPolarStereo')

# 南极极地投影
# 创建1行2列的1个子图,使用南极地投影
ax2 = fig.add_subplot(1, 2, 2, projection=ccrs.SouthPolarStereo())
ax2.add_feature(cfeature.COASTLINE)  # 添加海岸线
gl2 = ax2.gridlines(draw_labels=True, x_inline=False, y_inline=True)  # 添加网格栅格线
ax2.set_title('SouthPolarStereo')
plt.show()