1. Motivation
-
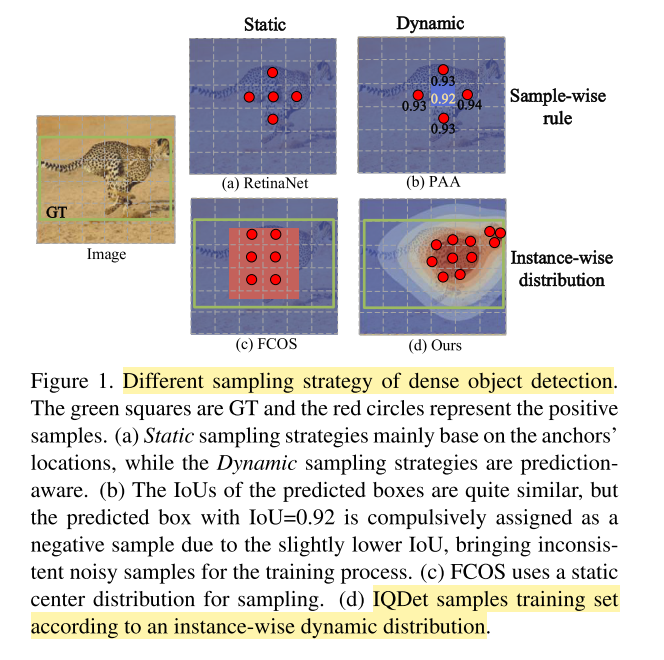
The improvements in sampling strategies can be divided into two tendencies.
(1) From Static to Dynamic.
(2) From Sample-wise to Instance-wise.
-
These sampling strategies might have a few limitations.
(1) Static rules are not learnable and prediction-aware (e.g. center region and anchor-based), which may be not always the best choice for some eccentric object.
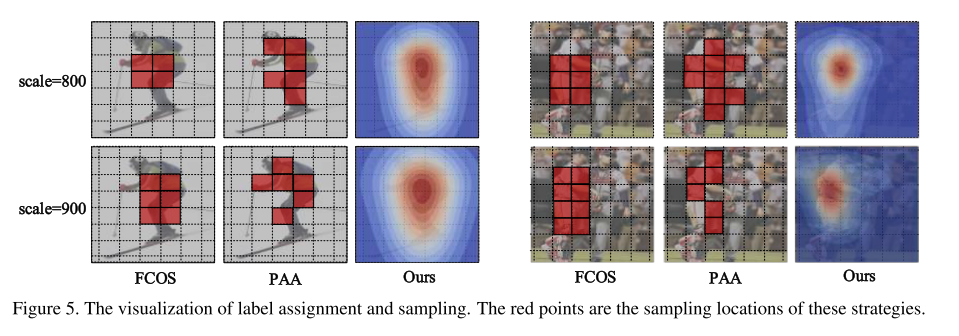
(2) Some Dynamic rules like PAA might suffer from the noisy samples and per-sample quality rules, without jointly formulating a quality distribution in spatial dimensions, as shown in Fig. 1(b).
(3) They sample uniformly over regu- lar grids of image owing to the dense prediction paradigm, which is difficult to assemble enough high-quality and diverse samples.
2. Contribution
- Our main contribution is to propose an instance-wise quality distribution, which is extracted from the regional feature of the ground-truth to approximate each predic- tion’s quality. It guides noise-robustly sampling and it is a prediction-aware strategy.
- Besides, we formulate an assignment and resampling strategy according to the distribution. It is adapted to the semantic pattern and scale of each instance and simulta- neously training with sufficient and high-quality samples.
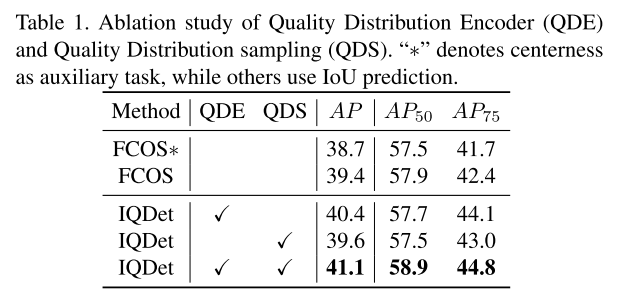
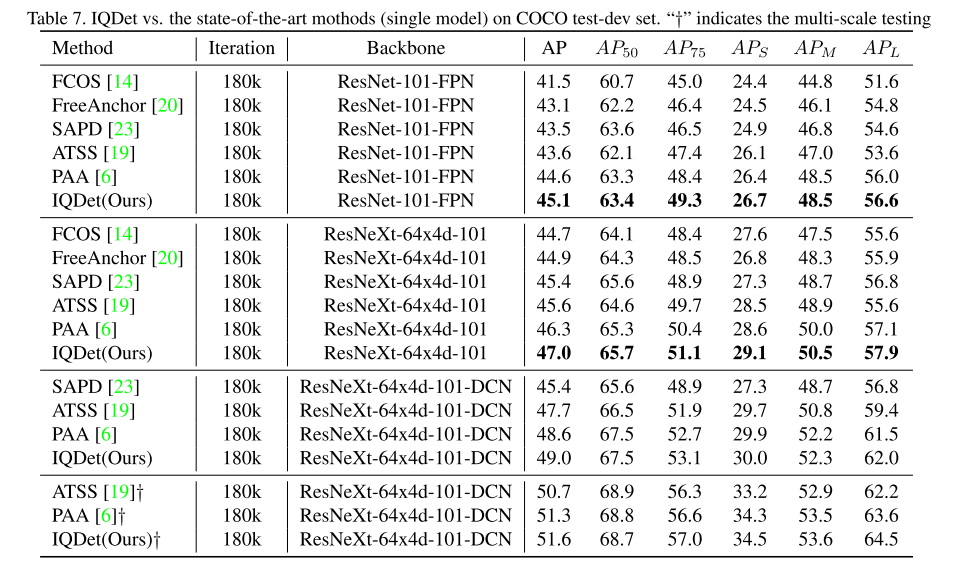
- We achieve state-of-the-art results on COCO dataset without bells and whistles. Our method leads to 2.8 AP improvements from 38.7 AP to 41.1 AP on single-stage method FCOS. ResNext-101-DCN based IQDet yields 51.6 AP, achieving state-of-the-art performance without introducing any additional overhead.
3. Method
3.1 Formulation of Quality Distribution Encoder
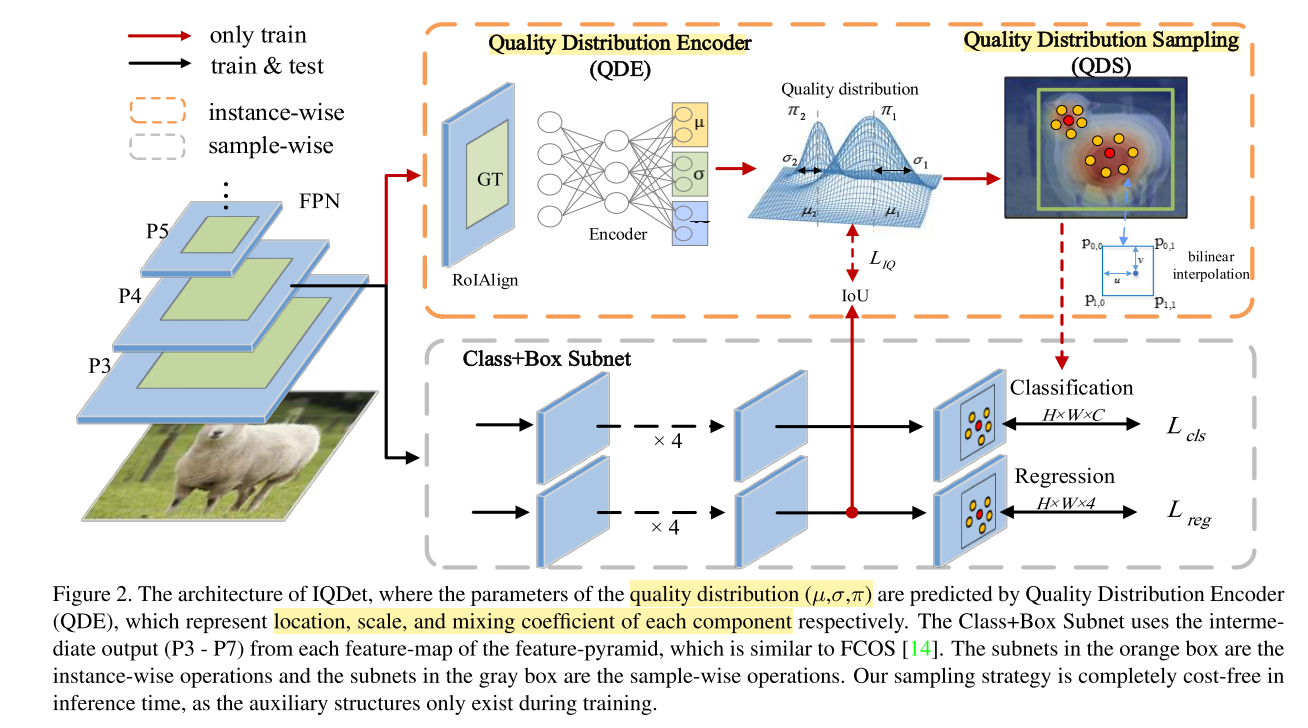
本文提出了一个新的学习分布的subnet,命名为Quality Distribution Encoder(QDE)。
具体做法,先根据gt的location提取gt的信息。这一步通过使用RoIAlign layer来实现,输入的RoI是GT box,作者认为提取GT信息的regional feature在空间维度上和分布的制定是对齐的。
-
To effectively encode the instance-wise feature, we first extract the feature of an object according to the GT location and it is realized by applying the RoIAlign layer to each pyramid feature, where the input RoI is the ground-truth box.
-
Specifically, the motivation of using GT feature is that extracting the regional feature of GT is properly aligning with the distribution assignment in spatial dimensions.
由于未知的分布不容易学习,basic idea是使用encoder将未知的分布映射为一个已知的分布,例如高斯混合模型GMM。
- It can form smooth approximations to arbitrarily shaped distribution.
- The individual component may model some underlying set of hidden classes.
对于每一个gt的质量分布的概率密度函数,可以由公式1表示,理解为gt的所有K个componet的GMM 函数加权共同作用的结果,其中式子中的 π , μ , σ \pi, \mu, \sigma π,μ,σ都是通过网络预测得到, d ? \vec d d应该可以直接由图像中的pred center到gt center求出。

- K和 θ \theta θ分别表示component number和encoder parameters。
- $\vec \pi $表示图片I中沿x和y空间维度上的混合参数mixing coefficient。
- d ? \vec d d表示物体内部到gt center采样的沿x和y方向的偏移量offsets。
每一个成分的混合表示表示为:
Φ
k
(
d
?
)
=
N
k
(
d
?
∣
μ
?
k
,
σ
?
k
)
=
e
?
(
d
?
?
μ
?
k
)
2
2
σ
?
k
2
\boldsymbol{\Phi}_k(\vec d) = N_k(\vec d|\vec \mu_k, \vec \sigma_k) = e^{- \frac{(\vec d - \vec \mu_k)^2}{2\vec \sigma^2_k}}
Φk?(d)=Nk?(d∣μ?k?,σk?)=e?2σk2?(d?μ?k?)2?
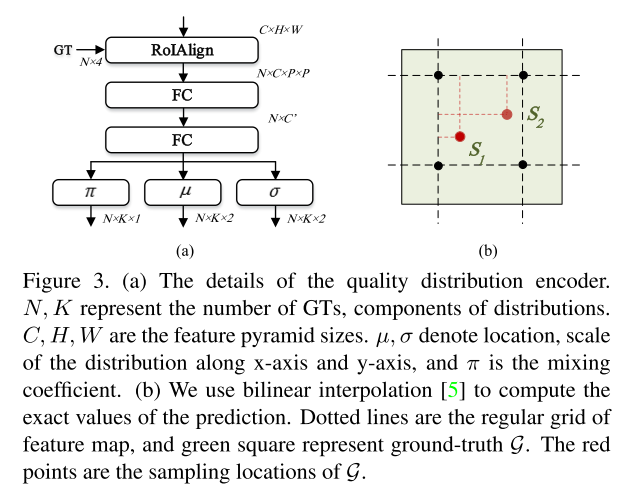
encoder的网络框架如图3所示。其中N表示一张图上gt的数量,K表示component的数量。输入为
C
×
H
×
W
C \times H \times W
C×H×W以及在每一fpn层特征图上的gt的缩放的坐标组成,
N
×
4
N \times 4
N×4。进行ROIAlign操作,再过2个FC层,得到
π
:
N
×
K
×
1
\pi:N \times K \times 1
π:N×K×1,
μ
:
N
×
K
×
2
\mu: N \times K \times 2
μ:N×K×2以及
σ
:
N
×
K
×
2
\sigma: N \times K \times 2
σ:N×K×2。其中
μ
\mu
μ代表location,
σ
\sigma
σ代表scale,
π
\pi
π代表mixing coefficient。
之前一直在想如何理解利用iou prediction来监督quality distribution。在看了下图2有点理解了,通过quality distribution函数计算出gt内部某一个pixel的quality,接着找到在box subnet中同样位置上,得到此时pixel的4个[l,t,r,b]的偏移量。这样就可以计算iou,起到”监督“的作用。
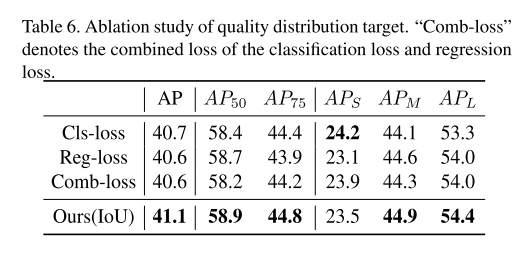
- Thus, we supervise the quality distribution by the IoU of the predicted boxes over the grid.
3.2 Quality Distribution for Sampling
基于3.1提出的quality distribution,作者在本节中制定了IQDet采样和样本匹配的策略,在分布中使用floating-number coordinate预测进行重采样resample,同时使用分布来表示这些预测值的质量,作者使用soft distribution来监督这种预测的得分值。
3.2.1 Resample in Spatial and Scale Dimensions
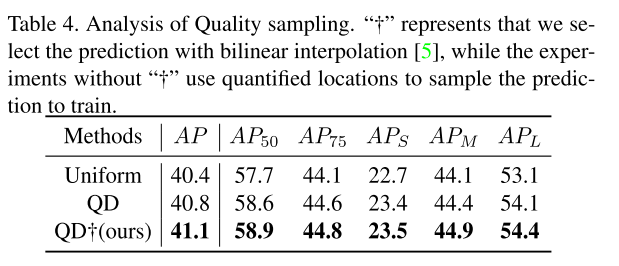
如图2所示,红色和橘色的圆形表示正样本,但是浮点数的location的预测值很难获得,本文不使用IOU,TOP K等之前的方法,作者认为这样子会导致训练的过拟合,以及导致正样本数量的减少。因此本文使用双线性插值的方法来计算预测的确切值。插值是在分类和回归的特征图上进行计算的。
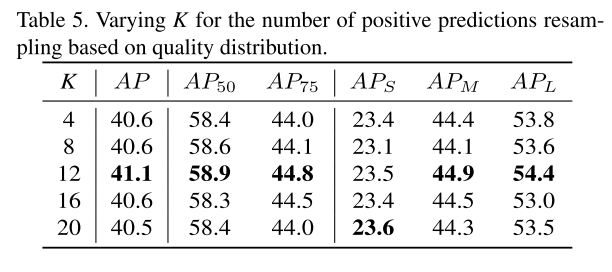
根据双线性插值得到的预测结果,作者通过质量分布的得分值,采样K个positive prediction,然后为每一个gt构建一个候选预测样本的bag。
对于负样本的选取,和baseline类似:
- we select the negative sample outside the GT box over the grid.
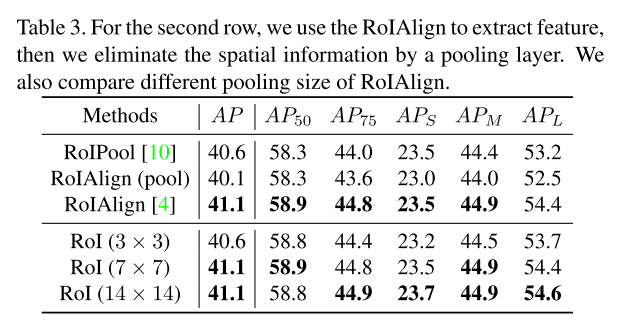
图3b表示,由于分类的特征图是非线性的分布,因此IQDet在不同grid point上反传不同的梯度。当pool-size设置为1的时候,对于每一个样本的插值和RoIAlign类似,这样做可以很好的对齐,保留每一个pixel空间的关联性。
总结来说,IQDet可以训练更多,更高质量的样本点。
- To sum up, compared with the previous strategies sampling over the grid, IQDet is able to train with more diverse and high-quality samples.
3.2.2 Soft Label Assignment
与之前的方法不同,本文使用quality distribution作为labels来监督分类的预测值。(我觉得这个和Vari Focal loss有点类似, 虽然文中没有明确提及如何操作,但应该是将gt target 1 根据质量分布进行一定的减少[0, 1],使得正样本的gt分类 target不一定是1,从而越接近于1的sample才容易被监督,区分正样本中的好坏,得到high-quality的sample。)
- For each sample selected from the quality distribution, we also calculate the label according to bilinear interpolation.
- Different from the label assignment in previous work, we use the quality distribution as the labels to supervise the classification prediction.
和之前的label assignment方法不同,IQDet不将样本划分为正负样本,而是对于每一个样本,制定quality distribution为一个soft label。带有high-quality value的预测更有可能被更高分类target监督。
-
Without dividing the samples into positive and negative samples, IQDet assigns the quality distribution as a soft label to each sample.
-
The predictions with high-quality value are more likely supervised by higher classification target.
对于在gt region外部的预测,作者将他们制定为确定的negative sample,也就是分类的target为0。
- For predictions located outside the ground-truth region, we assign them as negative samples for sure, which the classification targets are set to zero.
个人认为,相当于在所有的FPN层上,只有每层上的k个样本,他们的有gt的(target在0~1之间),而其余都被视作负样本,他们的target都是0。
-
Across all feature pyramid levels, only the K samples in terms of distribution values are supervised by the distribution, and the others are supervised as zero. For
-
For the regression branch, we use the offset of the sampling location with ground-truth as the regression target.
3.3 IQDet
作者使用FCOS作为Baseline。如图2所示,下方的结构都和fcos保持一致,上方的QDS的输入是每层FPN的特征图。
QDS提取了gt的regional feature,并且估算了一个质量分布quality distribution,质量分布用于知道采样和样本匹配策略。QDS是instance-wise,同时对采样得到的物体进行监督估算。
在图2下方的Class+Box Subnet,方法是sample-wsie的,每一个sample都分别被监督和估算。subnet的结构基本是FCOS一致,不过作者不适用centerness分支,而是使用predicted ious。
- For the LIQ loss shown in Fig. 2, we supervise the quality distribution by the IoUs of predicted boxes.
- As the loss function, we use the BCE loss between the target values and the distribution predictions

4. Experiment
4.1 Ablation Study
4.1.1 Quality Encoder and Quality Sampling
4.1.2 Quality Distribution Encoder
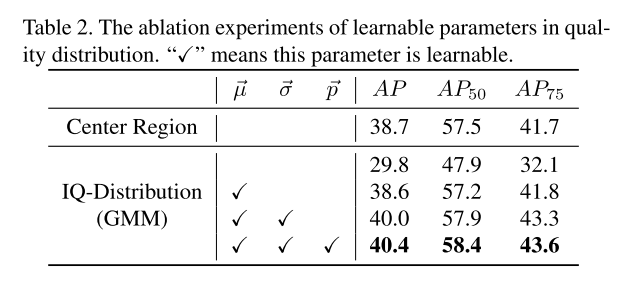
- Learnable Parameters of Quality Distribution
- Architecture of Encoder
4.1.3 Quality Distribution Sampling
- Quantified Sampling vs. Continuous Sampling
- Number of Positive Samples of Resampling
- Quality Distribution Target
4.2 Analysis of IQDet
4.3 Comparison with State-of-the-art Detectors
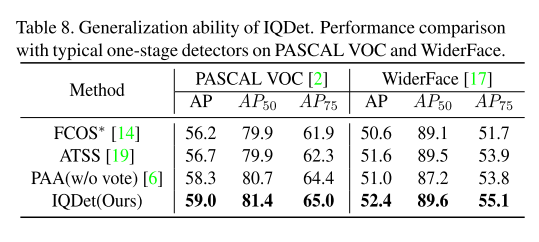
4.4 Generalization of IQDet.
