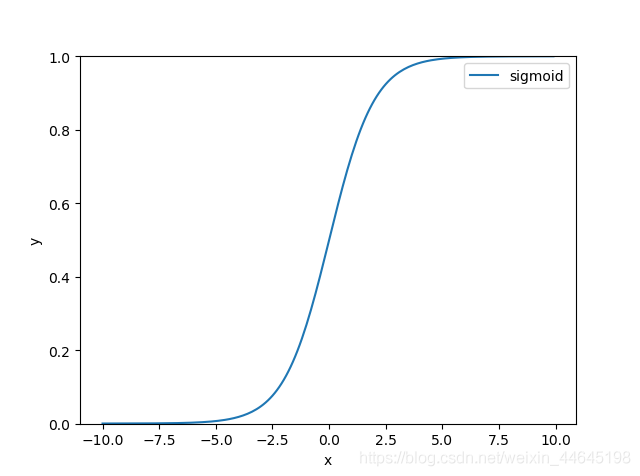
记录一下
import numpy as np
import math
import matplotlib.pyplot as plt


def sigmod():
    x = np.arange(-10, 10, 0.1)
    print(x)

    y = []
    for t in x:
        y_1 = 1 / (1 + math.exp(-t))
        y.append(y_1)
    print(y)
    plt.plot(x, y, label="sigmoid")
    plt.xlabel("x")
    plt.ylabel("y")
    plt.ylim(0, 1)#设置横纵坐标轴范围
    plt.legend()
    plt.show()

def Tanh():
    x = np.arange(-5, 5, 0.1)
    print(x)
    y = []
    for t in x:
        y_1 =  (1 - math.exp(-(2*t))) / (1 + math.exp(-(2*t)))
        y.append(y_1)
    print(y)
    plt.plot(x, y, label="Tanh")
    plt.xlabel("x")
    plt.ylabel("y")
    plt.ylim(-1, 1)#设置横纵坐标轴范围
    plt.legend()
    plt.show()

def relu():
    # 函数
    g = lambda z: np.maximum(0, z)

    start = -10  # 输入需要绘制的起始值(从左到右)
    stop = 10  # 输入需要绘制的终点值
    step = 0.01  # 输入步长
    num = (stop - start) / step  # 计算点的个数
    x = np.linspace(start, stop, int(num))
    y = g(x)

    #fig = plt.figure(1)
    plt.plot(x, y, label='relu')
    plt.grid(False)  # 显示网格

    plt.legend()  # 显示旁注
    # plt.show(fig)
    plt.show()

def leaky_relu():
   g = lambda z: np.maximum(0.01 * z, z)

   start = -150  # 输入需要绘制的起始值(从左到右)
   stop = 50  # 输入需要绘制的终点值
   step = 0.01  # 输入步长
   num = (stop - start) / step  # 计算点的个数
   x = np.linspace(start, stop, int(num))
   y = g(x)

   fig = plt.figure(1)
   plt.plot(x, y, label='Leaky ReLU')
   plt.grid(True)  # 显示网格

   plt.legend()  # 显示旁注
   plt.show(fig)

def SiLU():

   x = np.arange(-10, 10, 0.1)

   y = []
   for t in x:
       y_1 = t*(1 / (1 + math.exp(-t)))
       y.append(y_1)
   print(y)
   plt.plot(x, y, label="SiLU")
   plt.xlabel("x")
   plt.ylabel("y")
   plt.ylim(-1, 10)#设置横纵坐标轴范围
   plt.grid(True)  # 显示网格
   plt.legend()
   plt.show()
