- 时间:2021年7月27日
- 论文名称:Cellular Neural Networks: Theory
- 学习内容:学习细胞神经网络理论,基于Tensorflow实现论文的Fig9、Fig12
- 下一步学习计划:学习Matlab,并实现论文的Fig9、Fig12
- 源码地址:https://colab.research.google.com/drive/10E3O7qntXQ0tlFuCLTEbE-AMMHf5jZL0?usp=sharing
1.导入模块
import tensorflow as tf
import numpy as np
import matplotlib.pyplot as plt
import matplotlib as mpl
import matplotlib.ticker as ticker
from scipy.interpolate import make_interp_spline
!gdown --id 1fsKERl26TNTFIY25PhReoCujxwJvfyHn
zhfont = mpl.font_manager.FontProperties(fname='SimHei .ttf')
zhfont2 = mpl.font_manager.FontProperties(fname='New Times Roman .ttf')
2.设置初始状态

# 设置初始状态
epochs = 7
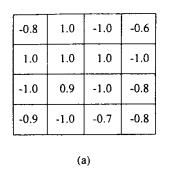
input_x = tf.constant([
	[
		[[-0.8],[1.0],[-1.0],[-0.6]],
		[[1.0],[1.0],[1.0],[-1.0]],
		[[-1.0],[0.9],[-1.0],[-0.8]],
		[[-0.9],[-1.0],[-0.7],[-0.8]],
	],
],dtype=tf.float32)
print(input_x.shape)

# 设置filters
filters = tf.constant([
  [[0.0],[1.0],[0.0]],
  [[1.0],[2.0],[1.0]],
  [[0.0],[1.0],[0.0]],
],dtype=tf.float32)
print(filters.shape)
bias = tf.constant(0.0,shape=[1])

filterinput = tf.reshape(filters, [3, 3, 1, 1])
print(filterinput.shape)
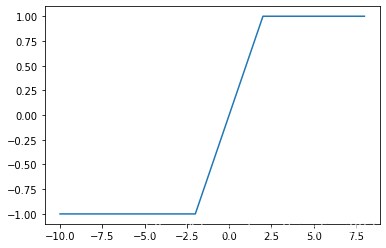
3.输出值的过滤函数
def sign(x):
  if x > 1:
    return 1
  elif x < -1:
    return -1
  else:
    return x

rng = [i for i in range(-10,10,2)]
y = [sign(x) for x in rng]
plt.plot(rng, y)

4.细胞神经网络卷积运算
论文公式:

def func(input_x):
  # x1:存储单个细胞的状态值
  x1 = []
  # y1:存储单个细胞的输出值
  x1 = []
  y1 = []
  A1 = np.zeros([4,4],dtype=float)
  A2 = np.zeros([4,4],dtype=float)

  # 记录初始状态值值并打印
  for i in range(4):
    for j in range(4):

      A1[i][j] = float(input_x[0][i][j][0])
  print("0时刻初始值矩阵:")
  print(A1)
  print('\n')
  x1.append(A1[1][1])


  # 记录初始输出值并打印
  for i in range(4):
    for j in range(4):
      A2[i][j] = sign(float(input_x[0][i][j][0]))
  print("0时刻输出值矩阵:")
  print(A2)
  print('\n')
  y1.append(A2[1][1])


  # 记录初始输出值的填充效果并打印
  A3 = np.pad(A2, ((1,1), (1,1)), 'edge')
  print("0时刻输出值矩阵的填充矩阵:")
  print('\n')
  print(A3)


  for k in range(epochs-1):

    input_x = tf.reshape(tf.convert_to_tensor(A3,dtype=tf.float32), [1, 6, 6, 1])
    # 卷积运算
    input_x = tf.nn.conv2d(input_x, filterinput, strides=[1,1,1,1], padding='VALID')+bias
    for i in range(4):
      for j in range(4):
        A1[i][j] = float(input_x[0][i][j][0]) + A2[i][j]*0.1 #2.2

    for i in range(4):
      for j in range(4):
        A2[i][j] = sign(float(input_x[0][i][j][0]))

    x1.append(A1[1][1])
    y1.append(A2[1][1])

    A3 = np.pad(A2, ((1,1), (1,1)), 'edge')
  print('X22的状态值:',x1)
  print('X22的输出值:',y1)
  return x1,y1
c_x,c_y = func(input_x)

5.数据可视化
# 可视化(拟合曲线)
plt.figure(dpi = 100)
T = np.array(range(epochs))
xnew = np.linspace(T.min(),T.max(),30)
c_x_power_smooth = make_interp_spline(T,c_x)(xnew)
plt.plot(xnew, c_x_power_smooth, label='y',linewidth = '0.7',color = 'red')
plt.plot(T, c_y,  label='x', linewidth = '0.7')
plt.xlabel(u"迭代次数",fontproperties=zhfont,fontsize=12)
plt.ylabel(u"数值",fontproperties=zhfont,fontsize=12)
plt.yticks(np.arange(0, epochs+1, 1),fontproperties = 'Times New Roman', size = 12)

plt.legend(fontsize=12)
plt.show()

6.多个初始状态对比分析

# 设置矩阵初始状态
input_x_a = tf.constant([
	[
		[[0.8],[0.7],[1.0],[-0.1]],
		[[1.0],[1.0],[1.0],[1.0]],
		[[1.0],[0.9],[0.7],[0.8]],
		[[-0.1],[1.0],[0.8],[1.8]],
	],
],dtype=tf.float32)

input_x_b = tf.constant([
	[
		[[0.8],[1.0],[1.0],[0.6]],
		[[1.0],[1.0],[1.0],[1.0]],
		[[-1.0],[0.9],[-1.0],[-0.8]],
		[[-0.9],[-1.0],[-0.7],[-0.8]],
	],
],dtype=tf.float32)

input_x_d = tf.constant([
	[
		[[-0.9],[-1.0],[1.0],[1.0]],
		[[-1.0],[1.0],[-1.0],[1.0]],
		[[1.0],[-1.0],[0.7],[0.8]],
		[[0.9],[1.0],[0.8],[1.0]],
	],
],dtype=tf.float32)

input_x_e = tf.constant([
	[
		[[-0.9],[-1.0],[-0.9],[-0.1]],
		[[-1.0],[1.0],[-1.0],[-1.0]],
		[[1.0],[-1.0],[1.0],[1.0]],
		[[0.7],[1.0],[1.0],[0.8]],
	],
],dtype=tf.float32)

input_x_f = tf.constant([
	[
		[[-0.8],[-0.9],[-1.0],[-0.6]],
		[[-1.0],[1.0],[-1.0],[-1.0]],
		[[-1.0],[-0.8],[-1.0],[-0.8]],
		[[-0.9],[-1.0],[-0.7],[-0.8]],
	],
],dtype=tf.float32)
a_x,a_y = func(input_x_a)
b_x,b_y = func(input_x_b)
d_x,d_y = func(input_x_d)
e_x,e_y = func(input_x_e)
f_x,f_y = func(input_x_f)
# 可视化(拟合曲线)
plt.figure(dpi = 100)
T = np.array(range(epochs))
xnew = np.linspace(T.min(),T.max(),30)
a_x_power_smooth = make_interp_spline(T,a_x)(xnew)
b_x_power_smooth = make_interp_spline(T,b_x)(xnew)
c_x_power_smooth = make_interp_spline(T,c_x)(xnew)
d_x_power_smooth = make_interp_spline(T,d_x)(xnew)
e_x_power_smooth = make_interp_spline(T,e_x)(xnew)
f_x_power_smooth = make_interp_spline(T,f_x)(xnew)

plt.plot(xnew, a_x_power_smooth, linewidth = '0.7')
plt.plot(xnew, b_x_power_smooth, linewidth = '0.7')
plt.plot(xnew, c_x_power_smooth, linewidth = '0.7')
plt.plot(xnew, d_x_power_smooth, linewidth = '0.7')
plt.plot(xnew, e_x_power_smooth, linewidth = '0.7')
plt.plot(xnew, f_x_power_smooth, linewidth = '0.7')

plt.xlabel(u"迭代次数",fontproperties=zhfont,fontsize=12)
plt.ylabel(u"数值",fontproperties=zhfont,fontsize=12)
plt.yticks(np.arange(-(epochs+1), epochs+2, 2),fontproperties = 'Times New Roman', size = 12)

plt.text(3, 6.6, '(a)')
plt.text(3, 4.4, '(b)')
plt.text(3, 2.6, '(c)')
plt.text(3, -1.5, '(d)')
plt.text(3, -3.6, '(e)')
plt.text(3, -5.6, '(f)')

plt.show()
