代码
加载数据
import tensorflow as tf
from tensorflow import keras

fashion_mnist = keras.datasets.fashion_mnist
(X_train_full, y_train_full), (X_test, y_test) = fashion_mnist.load_data()
创建测试集
并且将像素强度降低到0-1范围
X_valid, X_train = X_train_full[:5000] / 255., X_train_full[5000:] / 255.
y_valid, y_train = y_train_full[:5000], y_train_full[5000:]
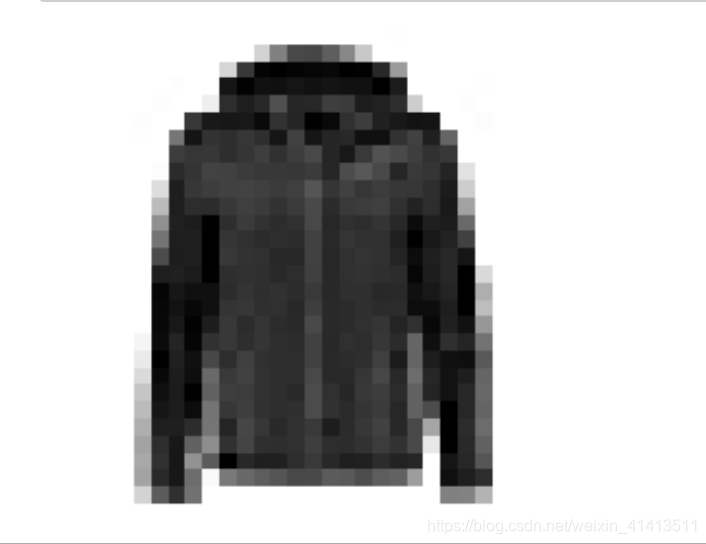
简单查看数据
import matplotlib.pyplot as plt
plt.imshow(X_train[0], cmap="binary")
plt.axis('off')
plt.show()
X_train_full.shape

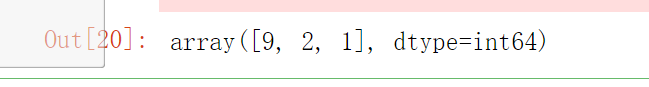
y_train

使用类名列表来告诉我们识别结果
class_names = ["T-shirt/top", "Trouser", "Pullover", "Dress", "Coat",
               "Sandal", "Shirt", "Sneaker", "Bag", "Ankle boot"]

class_names[y_train[0]]

训练数据
定义神经网络
model = keras.models.Sequential([
    keras.layers.Flatten(input_shape=[28, 28]),
    keras.layers.Dense(300, activation="relu"),
    keras.layers.Dense(100, activation="relu"),
    keras.layers.Dense(10, activation="softmax")
])
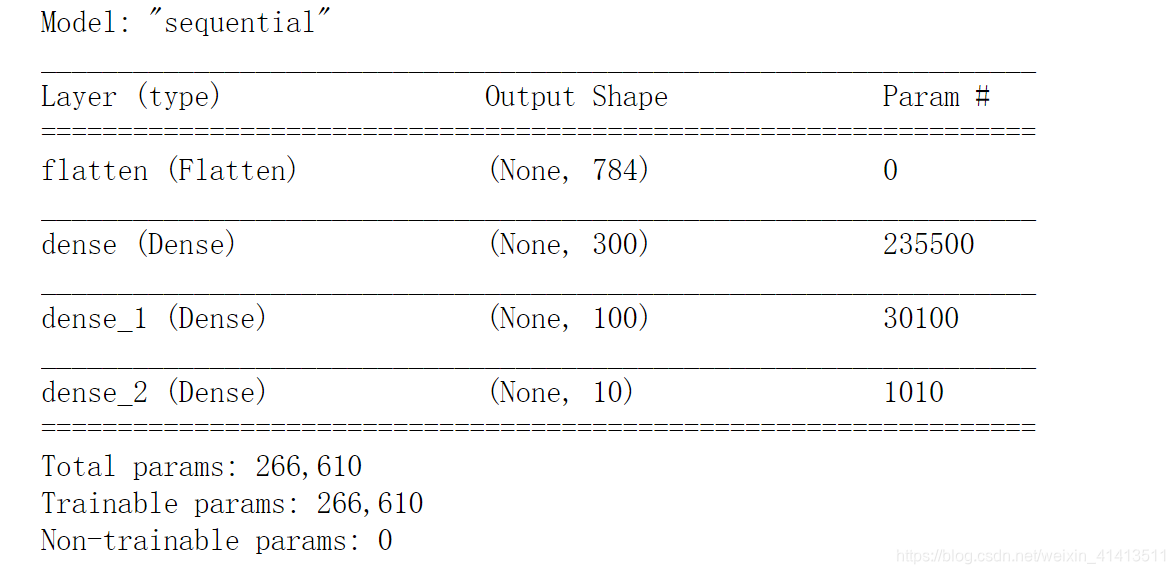
显示模型的所有层
model.summary()
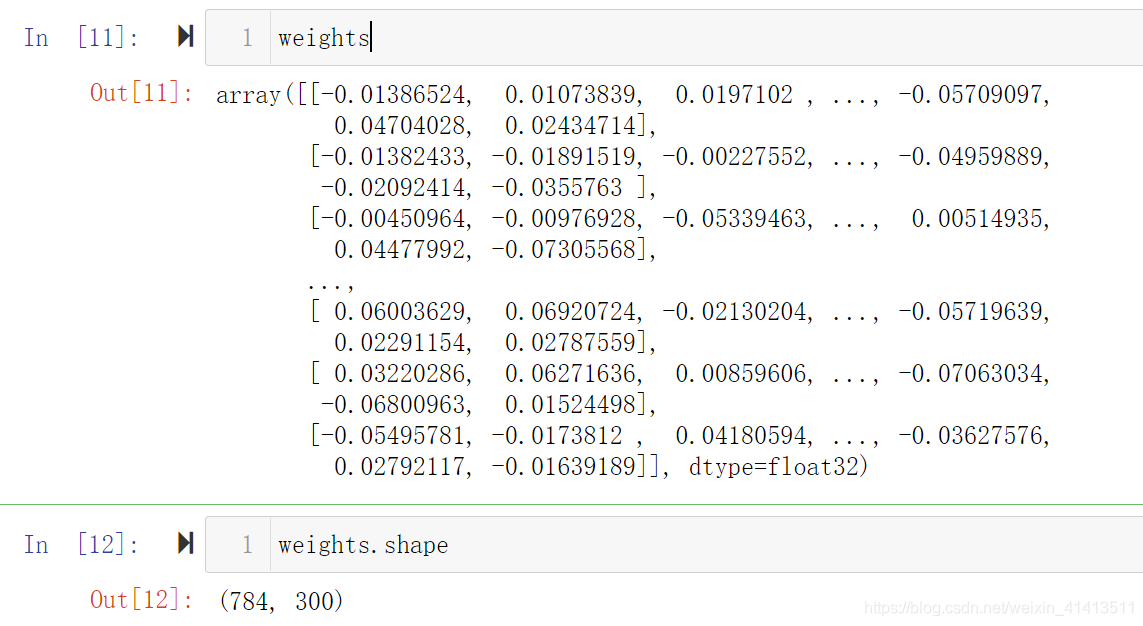
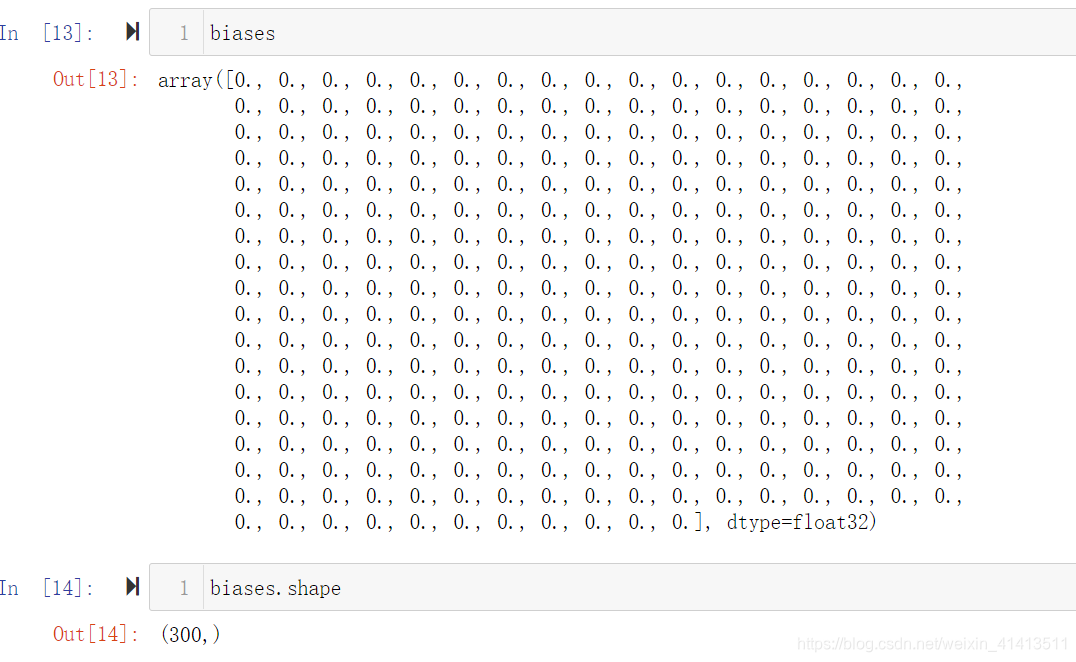
访问层所有参数
hidden1 = model.layers[1]
weights, biases = hidden1.get_weights()
指定损失函数等参数
model.compile(loss="sparse_categorical_crossentropy",
              optimizer="sgd",
              metrics=["accuracy"])
训练模型
history = model.fit(X_train, y_train, epochs=30,
                    validation_data=(X_valid, y_valid))
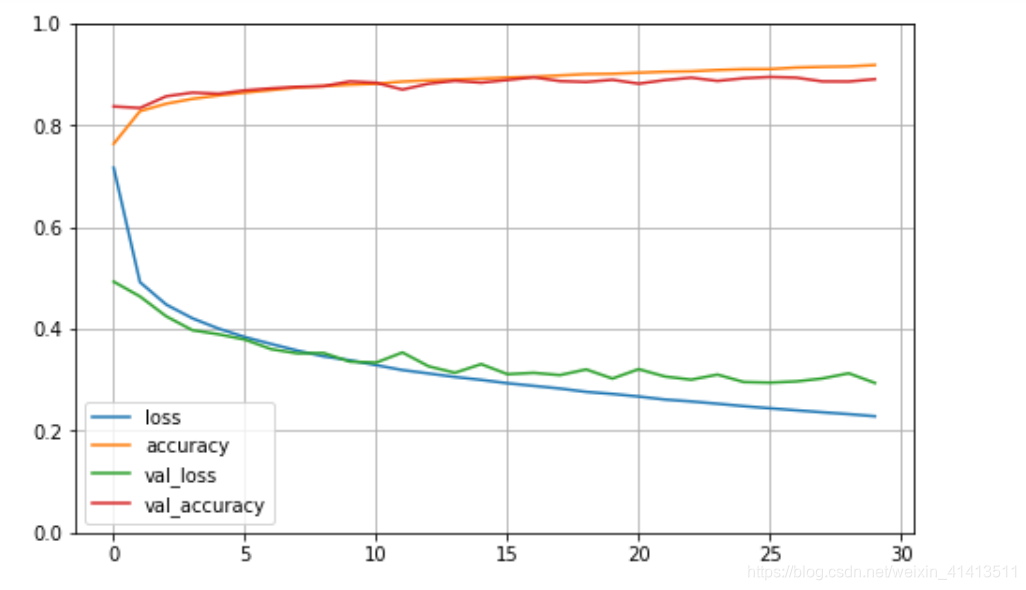
如果想查看每个轮次结束时测得的平均验证损失和准确率
import pandas as pd

pd.DataFrame(history.history).plot(figsize=(8, 5))
plt.grid(True)
plt.gca().set_ylim(0, 1)
plt.show()
在测试集上评估
model.evaluate(X_test, y_test)

预测
X_new = X_test[:3]
y_proba = model.predict(X_new)
y_proba.round(2)
输出各个类的概率
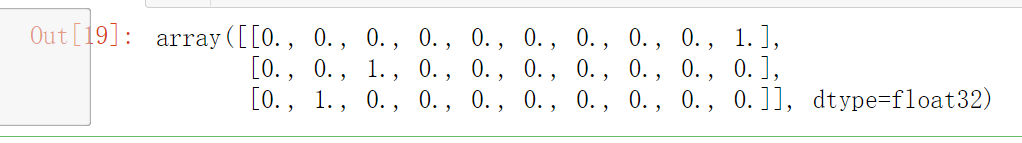
y_pred = model.predict_classes(X_new) # deprecated
y_pred