1.概述
1.1概念? ? ? ??
?????????神经网络(neual networks)是人工智能研究领域的一部分,当前最流行的神经网络是深度卷积神经网络(deep convolutional neural networks, CNNs),虽然卷积网络也存在浅层结构,但是因为准确度和表现力等原因很少使用。目前提到CNNs和卷积神经网络,学术界和工业界不再进行特意区分,一般都指深层结构的卷积神经网络,层数从”几层“到”几十上百“不定。CNNs目前在很多很多研究领域取得了巨大的成功,例如: 语音识别,图像识别,图像分割,自然语言处理等。
1.2网络结构
1.2.1卷积
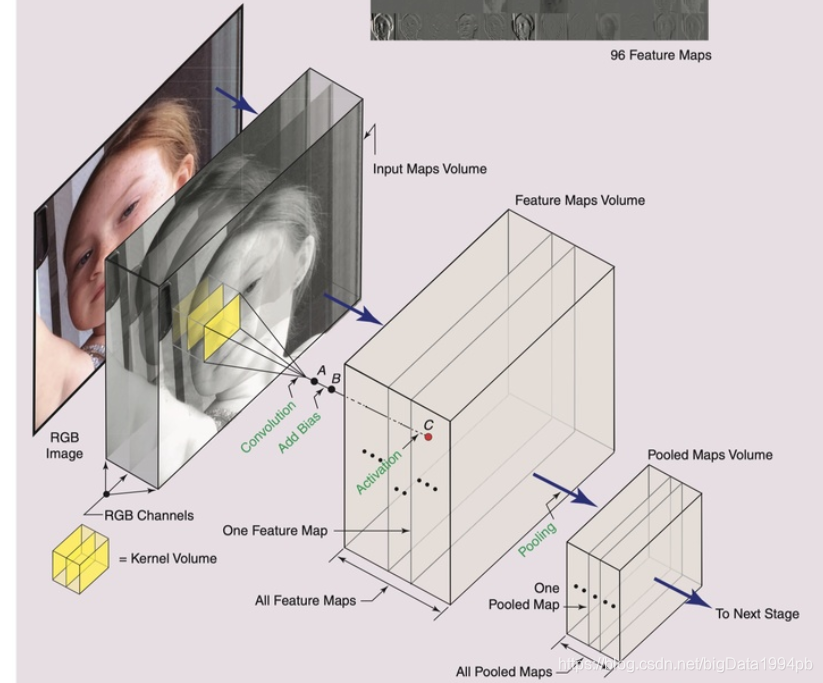
????????基础的CNN由?卷积(convolution),?激活(activation), and?池化(pooling)三种结构组成。CNN输出的结果是每幅图像的特定特征空间。当处理图像分类任务时,我们会把CNN输出的特征空间作为全连接层或全连接神经网络(fully connected neural network, FCN)的输入,用全连接层来完成从输入图像到标签集的映射,即分类。当然,整个过程最重要的工作就是如何通过训练数据迭代调整网络权重,也就是后向传播算法。目前主流的卷积神经网络(CNNs),比如VGG, ResNet都是由简单的CNN调整,组合而来。

例如采用277*277的RGB图像, 采用96个11*11*3的kernels同时扫描,很容易得到输出的feature maps是96个267*267的二维 feature map, 267*267是单个图像feature map的x,y轴大小,96是卷积核个数,原本的3通道在积分的时候会被作为一个元素加起来。 如上图,这些feature map可视化之后,可以看到4 和35表示边缘特征,23是模糊化的输入,10和16在强调灰度变化,39强调眼睛,45强调红色通道的表现。
?1.2.2池化
????????池化(pooling),是一种降采样操作(subsampling),主要目标是降低feature maps的特征空间,或者可以认为是降低feature maps的分辨率。因为feature map参数太多,而图像细节不利于高层特征的抽取。
??????????????????????????????????????????????
?
目前主要的pooling操作有:
- 最大值池化 Max pooling:如上图所示,2 * 2的max pooling就是取4个像素点中最大值保留
- 平均值池化 Average pooling: 如上图所示, 2 * 2的average pooling就是取4个像素点中平均值值保留
- L2池化 L2 pooling: 即取均方值保留
????????Pooling操作会降低参数,降低feature maps的分辨率,但是这种暴力降低在计算力足够的情况下是不是必须的,并不确定。目前一些大的CNNs网络只是偶尔使用pooling.
????????以上是一个CNN stage的基本结构,需要强调的是,这个结构是可变的,目前大部分网络都是根据基本结构堆叠调整参数,或跳层连接而成。CNN的输出是feature maps,它不仅仅可以被输入全连接网络来分类,也可以接入另外一个“镜像”的CNN,如果输入图像维度与这个新的CNN输出feature maps特征维度相同,即这个新接入的CNN在做上采样, upsampling, 得到的图像可以认为是在做像素级的标注,图像分割。
2.实现
2.1数据集

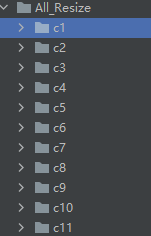
?一共11个动作,每个动作30个图像
2.2实现
import pathlib
import tensorflow as tf
from tensorflow import keras
from tensorflow.keras import layers,models,Model,Sequential
from tensorflow.keras.layers import Conv2D,BatchNormalization,Activation,Dense,Flatten,Dropout,MaxPooling2D
import numpy as np
import matplotlib.pylab as plt

# 准备数据
data_dir = "All_Resize"
data_dir = pathlib.Path(data_dir) # 读出的是c1-c10文件夹
image_count = len(list(data_dir.glob("*/*")))# 读出的是图像的个数

print("图片的综述为:", image_count)

# 参数设定
batch_size = 4
image_height = 64
image_wijdth = 64
epochs = 10

# 构建一个ImageDataGenerator
# 由于训练集和测试集在一个文件夹里所以构建一个ImageDataGenerator即可
train_data_gen = tf.keras.preprocessing.image.ImageDataGenerator(
    rescale=None, # 重放缩因子,默认为None. 如果为None或0则不进行放缩,否则会将该数值乘到数据上(在应用其他变换之前)
    rotation_range=45, # 随机选择的范围
    shear_range=0.2, # 浮点数。剪切强度(以弧度逆时针方向剪切角度)。
    validation_split=0.2, # 以8:2的比例进行划分训练集和测试集
    horizontal_flip=True # 布尔值。随机水平翻转。
)

# 划分数据集
train_ds = train_data_gen.flow_from_directory(
    directory=data_dir,
    target_size=(image_height, image_wijdth),
    batch_size=batch_size,
    class_mode='categorical', # 默认为"categorical. 该参数决定了返回的标签数组的形式
    shuffle=True,
    subset='training'
)

print(train_ds.image_shape)

test_ds = train_data_gen.flow_from_directory(
    directory=data_dir,
    target_size=(image_height, image_wijdth),
    batch_size=batch_size,
    class_mode='categorical',
    subset='validation',
    shuffle=True
)

# 构建CNN网络:3层卷积池化层+Flatten+全连接层
model = tf.keras.Sequential([
    tf.keras.layers.Conv2D(16, 3, padding="same", activation="relu",
                           input_shape=(image_height, image_wijdth, 3)),
    tf.keras.layers.MaxPooling2D(pool_size=(2, 2),padding='same', strides=1),

    tf.keras.layers.Conv2D(32, 3, activation="relu"),
    tf.keras.layers.MaxPooling2D(pool_size=(2, 2), strides=1, padding='same'),

    tf.keras.layers.Conv2D(64, 3, activation="relu"),
    tf.keras.layers.MaxPooling2D(pool_size=(2, 2), strides=1, padding='same'),

    tf.keras.layers.Conv2D(128, 3, activation="relu"),
    tf.keras.layers.MaxPooling2D(pool_size=(2, 2), strides=1, padding='same'),

    tf.keras.layers.Flatten(),

    tf.keras.layers.Dense(100, activation="relu"), # 如果选取1024下面选取512,本人的电脑跑不了,参数14亿个
    tf.keras.layers.Dense(100, activation="relu"),
    tf.keras.layers.Dense(11, activation="softmax"),
])

# model.summary() # 输出模型的架构

# 模型的编译
model.compile(optimizer="adam",
              loss=tf.keras.losses.BinaryCrossentropy(),
              metrics=["acc"])

# 模型的运行
history = model.fit(
    train_ds,
    validation_data=test_ds,
    epochs=epochs
)
# 保存模型
# model.save_weights('CNN_model.h5')
model.summary() # 输出模型的架构

# 查看可训练的对象
print(model.trainable_variables)

# file = open('./weight_CNN.txt',)
# for v in model.trainable_variables:
#     file.write(str(v.name)+'\n')
#     file.write(str(v.shape)+'\n')
#     file.write(str(v.numpy())+'\n')
# file.close()

#############   show    ##################
# 显示训练集和测试集的ACC和Loss
"""
history的作用:
进行准确率和损失值的可视化,就是将acc和loss使用matplot画出来。
我们在使用model.fit()函数进行训练时,同步记录了训练集和测试集的损失和准确率。
可以使用history进行调用
"""
acc = history.history['acc']
val_acc = history.history['val_acc']

loss = history.history['loss']
val_loss = history.history['val_loss']

#  打印acc和loss,采用一个图进行显示。
#  将acc打印出来。
plt.subplot(1, 2, 1)  # 将图像分为一行两列,将其显示在第一列
plt.plot(acc, label='Training Accuracy')
plt.plot(val_acc, label='Validation Accuracy')
plt.title('Training and Validation Accuracy')
plt.legend()

plt.subplot(1, 2, 2)  # 将其显示在第二列
plt.plot(loss, label='Training Loss')
plt.plot(val_loss, label='Validation Loss')
plt.title('Training and Validation Loss')
plt.legend()
plt.show()
2.3训练结果
由于为了节省时间,只迭代10,如果迭代200次训练结果在95%左右

?