机器学习训练营-基于逻辑回归的分类预测学习笔记
本学习笔记为阿里云天池龙珠计划机器学习训练营的学习内容,学习链接
学习知识点概要
- 了解逻辑回归的理论
- 掌握逻辑回归的sklearn函数调用,并应用到鸢尾花数据集预测
- 基于梯度下降,实现一种简单的逻辑回归模型
学习内容
-
分类和回归是监督学习中两个基本问题。相比于回归问题,分类问题更多地是基于一些输出为离散值的问题。比如,根据各种因素预测房屋价格是回归问题,而根据各种因素预测得是否患有某种疾病是分类问题。
-
如果使用使用线性回归解决分类问题,容易受到极端样本的影响使得分类误差较大,且线性回归的输出会超出[0,1]的范围
-
使用logistic回归,其假设函数如下:
h θ ( x ) = g ( θ T x ) g ( z ) = 1 1 + e ? z h_{\theta}(x)=g(\theta^Tx) \\g(z)=\frac{1}{1+e^{-z}} hθ?(x)=g(θTx)g(z)=1+e?z1?
其中 g ( z ) g(z) g(z)称为Sigmoid函数该回归函数的输出可以理解为 P ( y = 1 ∣ x ; θ ) P(y=1|x;\theta) P(y=1∣x;θ)
-
使得h(x)=0.5的x组成了决策界限,这是假设函数的特征,取决于参数而非数据集。
-
使用梯度下降法可以调整逻辑回归的参数,计算代价为
J ( θ ) = 1 m ∑ i = 1 m c o s t ( h θ ( x ( i ) , y ( i ) ) ) J(\theta)=\frac{1}{m}\sum^{m}_{i=1}cost(h_{\theta}(x^{(i)},y^{(i)})) J(θ)=m1?i=1∑m?cost(hθ?(x(i),y(i)))
其中cost函数如下(使J为凸函数)
c o s t ( h θ ( x ) , y ) = { ? log ? ( h θ ( x ) ) y = 1 ? log ? ( 1 ? h θ ( x ) ) y = 0 cost(h_\theta(x),y)= \begin{cases} -\log(h_\theta(x)) & y=1\\ -\log(1-h_\theta(x)) & y=0 \end{cases} cost(hθ?(x),y)={?log(hθ?(x))?log(1?hθ?(x))?y=1y=0?
由于y只能是0或者1,故cost函数又可以写成
c o s t ( h θ ( x ) , y ) = ? y log ? ( h θ ( x ) ) ? ( 1 ? y ) log ? ( 1 ? h θ ( x ) ) cost(h_\theta(x),y)=-y\log(h_\theta(x))-(1-y)\log(1-h_\theta(x)) cost(hθ?(x),y)=?ylog(hθ?(x))?(1?y)log(1?hθ?(x))该式使用极大似然估计得到
将logistic的假设函数和代价函数带入梯度下降的公式,求导,与线性回归的梯度下降公式一样:
θ j : = θ j ? α 1 m ∑ i = 1 m ( h θ ( x ( i ) ) ? y ( i ) ) x j ( i ) \theta_j := \theta_j - \alpha\frac{1}{m}\sum_{i=1}^{m}(h_{\theta}(x^{(i)})-y^{(i)})x^{(i)}_j θj?:=θj??αm1?i=1∑m?(hθ?(x(i))?y(i))xj(i)? -
相比于梯度下降法,还有更多优化算法,如示例中使用的L-BFGS算法,能够自动调整学习率,并且收敛地更快。更多算法细节在以后讨论。
sklearn中的逻辑回归模型+L-BFGS算法
##  基础函数库
import numpy as np
import pandas as pd
## 导入画图库
import matplotlib.pyplot as plt
import seaborn as sns

## 导入数据
from sklearn.datasets import load_iris
## 导入逻辑回归模型函数
from sklearn.linear_model import LogisticRegression
## 为了正确评估模型性能,将数据划分为训练集和测试集,并在训练集上训练模型,在测试集上验证模型性能。
from sklearn.model_selection import train_test_split
## 从sklearn中导入逻辑回归模型
from sklearn.linear_model import LogisticRegression

data = load_iris()  # 得到数据特征
iris_target = data.target  # 得到数据对应的标签
iris_features = pd.DataFrame(
    data=data.data, columns=data.feature_names)  # 利用Pandas转化为DataFrame格式

## 测试集大小为20%, 80%/20%分
x_train, x_test, y_train, y_test = train_test_split(iris_features,
                                                    iris_target,
                                                    test_size=0.2,
                                                    random_state=2020)
## 定义 逻辑回归模型
clf = LogisticRegression(random_state=0, solver='lbfgs')
## 训练模型
clf.fit(x_train, y_train)

## 查看其对应的w
print('the weight of Logistic Regression:', clf.coef_)
## 查看其对应的w0
print('the intercept(w0) of Logistic Regression:', clf.intercept_)

## 在训练集上预测
train_predict = clf.predict(x_train)
## 在测试集上预测
test_predict = clf.predict(x_test)

from sklearn import metrics

## 利用accuracy(准确度)【预测正确的样本数目占总预测样本数目的比例】评估模型效果
print('The accuracy of the Logistic Regression is:',
      metrics.accuracy_score(y_train, train_predict))
print('The accuracy of the Logistic Regression is:',
      metrics.accuracy_score(y_test, test_predict))
自己写的一个基于梯度下降的逻辑回归模型
##  基础函数库
import numpy as np
import pandas as pd
## 导入画图库
import matplotlib.pyplot as plt
import seaborn as sns

## 导入数据
from sklearn.datasets import load_iris
## 导入逻辑回归模型函数
from sklearn.linear_model import LogisticRegression
## 为了正确评估模型性能,将数据划分为训练集和测试集,并在训练集上训练模型,在测试集上验证模型性能。
from sklearn.model_selection import train_test_split
## 导入自己的模型
from my_module import logistic_regression

data = load_iris()  # 得到数据特征
iris_target = data.target  # 得到数据对应的标签
iris_features = pd.DataFrame(
    data=data.data, columns=data.feature_names)  # 利用Pandas转化为DataFrame格式

## 测试集大小为20%, 80%/20%分
x_train, x_test, y_train, y_test = train_test_split(iris_features,
                                                    iris_target,
                                                    test_size=0.2,
                                                    random_state=2020)

## 自定义逻辑回归模型
clf2 = logistic_regression(3, x_train, y_train, 0.03, 1500)
## 训练模型
clf2.fit()

## 查看自定义回归模型的参数
print('the theta of my logistic regression:', clf2.theta)
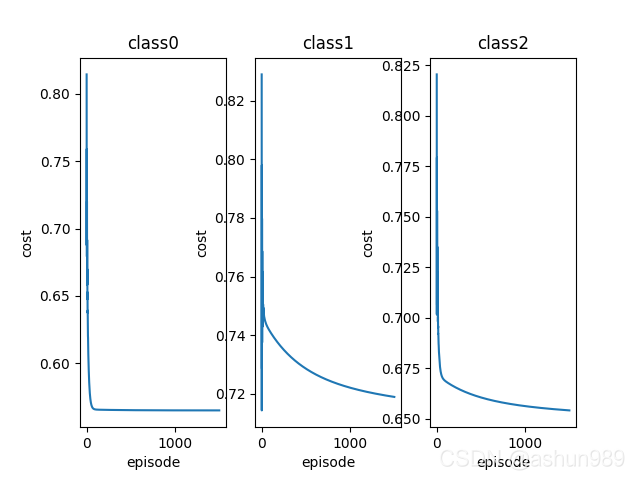
## 查看梯度下降效果
e = np.arange(clf2.episode)
for i in range(np.shape(clf2.cost)[0]):
    plt.subplot(1, 3, i + 1)
    plt.xlabel('episode')
    plt.ylabel('cost')
    plt.title('class' + str(i))
    plt.plot(e, clf2.cost[i, :])
plt.show()

## 在训练集预测
my_train_predict = clf2.predict(x_train)
## 在测试集预测
my_test_predict = clf2.predict(x_test)

from sklearn import metrics

## 利用accuracy(准确度)【预测正确的样本数目占总预测样本数目的比例】评估模型效果
print('The accuracy of my logistic regression is:',
      metrics.accuracy_score(y_train, my_train_predict))
print('The accuracy of my logistic regression is:',
      metrics.accuracy_score(y_test, my_test_predict))
from matplotlib.pyplot import show
import numpy as np
import math

from numpy.core.fromnumeric import shape


def calCost(theta, x, y, costFunction):
    J = 0
    m = np.shape(x)[0]
    for i in range(m):
        J = J + costFunction(theta, x[i, :], y[i])
    J = J / m
    return J


def gradientDescent(theta, x, y, alpha, episode, costFunction):
    new_theta = theta.copy()
    m = np.shape(x)[0]
    cost = np.zeros(shape=[1, episode])
    for i in range(episode):
        new_theta = new_theta - alpha / m * (np.dot(x.T, (np.dot(x, new_theta) - y)))
        cost[0, i] = calCost(new_theta, x, y, costFunction)
    return new_theta, cost


class logistic_regression:
    def __init__(self, classify_num, data, target, alpha, episode):
        self.num = classify_num
        self.alpha = alpha
        self.episode = episode
        self.cost = np.zeros(shape=[classify_num, episode])
        self.theta = np.zeros(shape=[np.shape(data)[1] + 1, classify_num])
        self.x = np.concatenate((np.ones(shape=[np.shape(data)[0], 1]), data),
                                axis=1)
        self.y = np.stack((target, target, target), axis=1)
        for i in range(np.shape(target)[0]):
            for j in range(classify_num):
                if self.y[i, j] != j:
                    self.y[i, j] = 0
                else:
                    self.y[i, j] = 1

    def fit(self):
        for i in range(self.num):
            self.theta[:, i], self.cost[i, :] = gradientDescent(
                self.theta[:, i], self.x, self.y[:, i], self.alpha,
                self.episode, self.costFunction)

    def predict(self, data):
        m = np.shape(data)[0]
        x = np.concatenate((np.ones(shape=[m, 1]), data), axis=1)
        y = np.dot(x, self.theta)
        p = np.zeros(shape=[m, 1])
        for i in range(m):
            p[i, 0] = np.argmax(y[i, :])
        return p

    @staticmethod
    def costFunction(theta, x, y):
        h = 1 / (1 + math.exp(np.dot(-x, theta)))
        cost = -y * math.log(h) - (1 - y) * math.log(1 - h)
        return cost
该模型需要手动调整学习率,绘制的代价函数随迭代次数的变化图像表明了梯度下降模型已经基本收敛

预测结果准确率的评估对比
由于这里划分方法是留出法,需要多次随机划分
| L-BFGS模型\组数 | 1 | 2 | 3 | 4 | 5 | 平均 |
|---|---|---|---|---|---|---|
| 训练集 | 0.975 | 0.983 | 0.975 | 0.975 | 0.975 | 0.977 |
| 测试集 | 1.000 | 0.867 | 1.0 | 1.0 | 0.967 | 0.967 |
| 梯度下降模型\组数 | 1 | 2 | 3 | 4 | 5 | 平均 |
|---|---|---|---|---|---|---|
| 训练集 | 0.842 | 0.875 | 0.875 | 0.833 | 0.842 | 0.853 |
| 测试集 | 0.833 | 0.700 | 0.733 | 0.833 | 0.833 | 0.786 |
学习问题与解答
-
L-BFGS的算法原理和实现是怎样的?为什么要把w和w0分开?观察结果参数,
# L-BFGS
[[ 9.28640502  2.93982978 -12.2262348]
 [-0.42811624  0.22521439  0.20290185]
 [ 0.90216543 -0.31280638 -0.58935906]
 [-2.35892743 -0.04278544  2.40171287]
 [-1.01037377 -0.76316802  1.77354179]]
# 梯度下降
[[ 0.06767668  0.5332828  -0.2890481 ]
 [ 0.06512361  0.1378264  -0.09343083]
 [ 0.26193529 -0.35682446  0.14645065]
 [-0.22339017  0.1606885   0.04149944]
 [-0.06379443 -0.44162421  0.47936581]]
显然在w0上差别很大,梯度下降陷入了一个局部最优
学习思考与总结
目前python使用还不是很熟练,即用即查。对于机器学习,仍是管中窥豹,还要多多学习。