文章目录
CV::Point以及CV::Scalar
Point表示的是2D平面上的一个点(x, y),使用方式如下:
第一种
Point p1;
p1.x = 100;
p1.y = 50;
p1表示的就是坐标为(100,50)的点。
第二种
Point p2 = Point(100, 80);
p2表示的是坐标为(100,80)的点。同样 Point(100,80)也可直接表示坐标为(100,80)的点。
Scalar表示的是一个四个元素的向量,使用方式为:Scalar(b, g, r);
b表示的是blue;
g表示的是green;
r表示的是red。
可以用来表示图像对应个数通道对应的值。
Scalar()参数的个数可以是一个、两个、三个或四个(图像几个通道就有几个参数)。
画直线cv::line()
void Mylines(int x, int y)
{
	Point p1 = Point(20, 20);//直线起点
	Point p2;//直线终点
	p2.x = x;
	p2.y = y;
	Scalar color = Scalar(255, 0, 0);//直线颜色为蓝色
	line(bgImage, p1, p2, color, 1, LINE_AA);//在图像bgImage上画一条从p1到p2,颜色为color,粗细为1的反锯齿类型直线
}
Line(CvArr* img, CvPoint pt1, CvPoint pt2, CvScalar color, int thickness=1, int line_type=8, int shift=0 )
第一个参数img表示需要画线的图片
第二个参数pt1表示的是直线起点坐标
第三个参数pt2表示的是直线终点坐标
第四个参数color表示的是直线的颜色,用Scalar来表示颜色值
第五个参数thickness表示线条粗细
第六个参数line_type表示直线类型,有LINE_4、LINE_8、LINE_AA
LINE_4是4联通直线
LINE_8是8联通直线
LINE_AA是反锯齿直线
如果对直线没有要求 ,一般使用LINE_8,其算法最简单,所用时间最少,如果想要直线更清晰漂亮,可以使用反锯齿LINE_AA,但是其相应的运算时间也最长。
画椭圆cv::elipse()
void MyElipes()
{
	Scalar color = Scalar(0,255,0);
	ellipse(bgImage, Point(bgImage.cols / 2, bgImage.rows / 2), Size(bgImage.cols / 4, bgImage.rows / 8), 90, 0, 120, color, 2, LINE_8);
}
ellipse(img, center, axes, angle, startAngle, endAngle, color, thickness, lineType, shift)
img:要在上面画椭圆的图像
center:椭圆的中心——Point类型
axes:椭圆的轴长,格式为 Size (长轴长度的一半, 短轴长度的一半)
angle:椭圆沿水平方向逆时针旋转的角度
startAngle:沿长轴顺时针方向开始显示的角度
endAngle:沿长轴顺时针结束显示的角度
color:表示的是线条的颜色
thickness:椭圆边框的粗细,cv.FILLED 表示绘制实心椭圆
lineType:椭圆边框的类型
shift:坐标精确到小数点后第几位,默认为0
画矩形cv::rectangle()
void MyRectangle()
{
	Rect rect = Rect(20, 20, 50, 50);
	Scalar color = Scalar(255,20,50);
	rectangle(bgImage, rect, color, 2, LINE_8);
}
void rectangle(Mat& img, Point pt1,Point pt2,const Scalar& color, int thickness=1, int lineType=8, int shift=0)
和直线类似,这里的pt1和pt2分别表示的是矩形左上角坐标和右下脚坐标。
画圆cv::circle()
void MyCircle()
{
	Scalar color = Scalar(100, 200, 50);
	Point center = Point(bgImage.cols / 2, bgImage.rows / 2);
	circle(bgImage,center, 100, color, 2, LINE_8);
}
circle(img, center, radius, color, thickness, lineType, shift);
img:要在上面画圆的图像
center:圆的圆心
radius:圆的半径
color:圆的颜色
thickness:圆边框的粗细,cv.FILLED 表示绘制实心圆
lineType:圆边框的类型
shift:坐标精确到小数点后几位,默认为0
画填充多边形cv::fillpoly()
void MyPlygon()
{
	Point pts[1][5];
	pts[0][0] = Point(100, 100);
	pts[0][1] = Point(100, 200);
	pts[0][2] = Point(200, 200);
	pts[0][3] = Point(200, 100);
	pts[0][4] = Point(100, 100);

	const Point* ppts[] = { pts[0] };
	int npt[] = { 5 };
	Scalar color = Scalar(255, 255, 0);
	fillPoly(bgImage, ppts, npt, 1, color, LINE_8);
}
绘制多边形的函数中需要用到一个二维数组,这个二维数组中每一行存储的是一个多边形的所有顶点,一个二维数组中可以存储多个多边形的顶点。
在使用的时候需要创建一个指针数组,数组中每一个指针指向存储多边形顶点的二维数组中的一行。
fillPoly(Mat& img, const Point** ppts, const int* npts, int ncontours, const Scalar& color, int lineType=8);
- img是要在上面画图的图像
- ppts是一个指向多边形数组的指针,必须用const来修饰,上面的程序中pts是一个二维数组,ppts是指向这个数组的指针
- npts是多边形顶点个数的数组名
- ncontours是绘制多边形的个数
- color是填充的颜色
如果想要绘制多个多边形,可以这样:
void MyPlygon()
{
	Point pts[2][5];
	pts[0][0] = Point(100, 100);
	pts[0][1] = Point(100, 200);
	pts[0][2] = Point(200, 200);
	pts[0][3] = Point(200, 100);
	pts[0][4] = Point(100, 100);

	pts[1][0] = Point(200, 200);
	pts[1][1] = Point(200, 300);
	pts[1][2] = Point(300, 300);
	pts[1][3] = Point(200, 200);

	const Point* ppts[] = { pts[0], pts[1] };
	int npt[] = { 5, 4 };
	Scalar color = Scalar(0, 255, 255);
	fillPoly(bgImage, ppts, npt, 2, color, LINE_8);//ppts包含两个存储多边形坐标的数组,npt对应存储两个对应多边形的顶点个数,2表示绘制两个多边形
}
绘制文字cv::putText()
putText(bgImage, "Hello openCV", Point(50, 100), CV_FONT_HERSHEY_COMPLEX, 0.7, Scalar(12, 255, 80), 1, 8);
void cv::putText(
	cv::Mat& img, // 待绘制的图像
	const string& text, // 待绘制的文字
	cv::Point origin, // 文本框的左下角
	int fontFace, // 字体 (如cv::FONT_HERSHEY_PLAIN)
	double fontScale, // 尺寸因子,值越大文字越大
	cv::Scalar color, // 线条的颜色(RGB)
	int thickness = 1, // 线条宽度
	int lineType = 8, // 线型(4邻域或8邻域,默认8邻域)
	bool bottomLeftOrigin = false // true='origin at lower left'
);
具体的详细解释可以看这篇博客
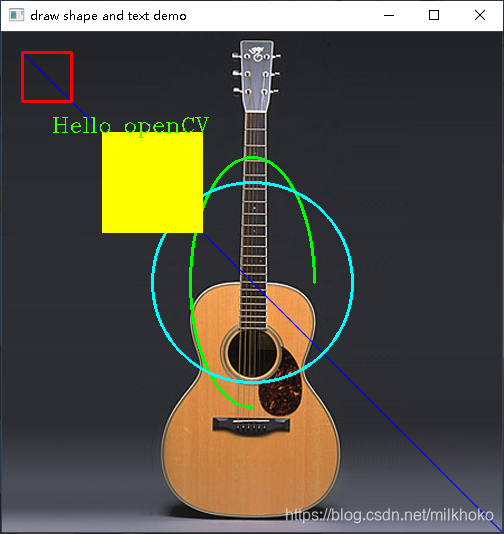
完整程序和运行结果
// Project9.cpp : 此文件包含 "main" 函数。程序执行将在此处开始并结束。
//

#include <iostream>
#include <opencv2/opencv.hpp>

using namespace std;
using namespace cv;

Mat bgImage;
const char* drawdemo_win = "draw shape and text demo";

void Mylines(int x, int y)
{
	Point p1 = Point(20, 20);
	Point p2;
	p2.x = x;
	p2.y = y;
	Scalar color = Scalar(255, 0, 0);
	line(bgImage, p1, p2, color, 1, LINE_AA);
}

void MyRectangle()
{
	Rect rect = Rect(20, 20, 50, 50);
	Scalar color = Scalar(0,0,255);
	rectangle(bgImage, rect, color, 2, LINE_8);
}

void MyElipes()
{
	Scalar color = Scalar(0,255,0);
	ellipse(bgImage, Point(bgImage.cols / 2, bgImage.rows / 2), Size(bgImage.cols / 4, bgImage.rows / 8), 90, 0, 270, color, 2, LINE_8);
}

void MyCircle()
{
	Scalar color = Scalar(255, 255, 0);
	Point center = Point(bgImage.cols / 2, bgImage.rows / 2);
	circle(bgImage,center, 100, color, 2, LINE_8);
}

void MyPlygon()
{
	Point pts[1][5];
	pts[0][0] = Point(100, 100);
	pts[0][1] = Point(100, 200);
	pts[0][2] = Point(200, 200);
	pts[0][3] = Point(200, 100);
	pts[0][4] = Point(100, 100);

	const Point* ppts[] = { pts[0] };
	int npt[] = { 5 };
	Scalar color = Scalar(0, 255, 255);
	fillPoly(bgImage, ppts, npt, 1, color, LINE_8);
}

int main()
{
    std::cout << "Hello World!\n";
	bgImage = imread("A:/opencvproject/002.jpg");
	if (!bgImage.data)
	{
		cout << "image is empty" << endl;
		return -1;
	}
	Mylines(bgImage.rows, bgImage.cols);
	MyRectangle();
	MyElipes();
	MyCircle();
	MyPlygon();
	putText(bgImage, "Hello openCV", Point(50, 100), CV_FONT_HERSHEY_COMPLEX, 0.7, Scalar(12, 255, 80), 1, 8);
	namedWindow(drawdemo_win, CV_WINDOW_AUTOSIZE);
	imshow(drawdemo_win, bgImage);
	waitKey(0);
	return 0;
}
