1.简介
本文介绍的场景热力图分为两种,一种是在深度学习中查看网络中的激活区域,通过加入热力图使得可以根据区域的更新区域可视化学习的区域具体的理解可以参考论文:《Learning Deep Features for Discriminative Localization》;另一种则是根据已有的数据和标签来和原图绘制热力图。下面分别介绍一下这两种热力图。
2.CAM类激活的热力图的原理
类激活图仅仅是在不同空间位置处存在这些视觉图案的加权线性和。通过简单地将类激活映射上采样到输入图像的大小,我们可以识别与特定类别最相关的图像区域。用数学语言解释如下图:
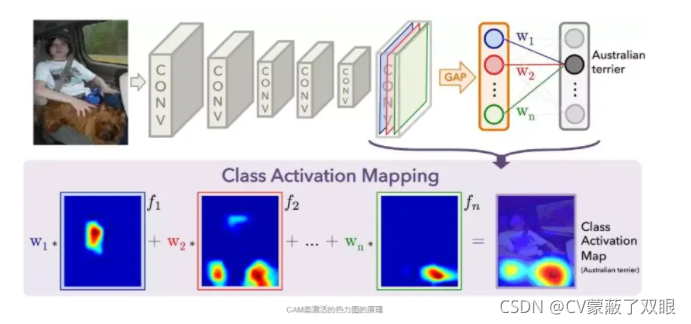
GAP就是把特征图转换成特征向量,每一层特征图用一个值表示,所以如果这个特征图的深度是512,那么这个特征向量的长度就是512。我们的输出是Australian terrier,澳大利亚梗。我们用Australian terrier这个类对应的权重乘上特征图对应的层,用热力图归一化,即下面一排热力图:W1蓝色层+W2红色层+…+Wn*绿色层=类激活映射(CAM),所以说CAM是一个加权线性和。具体的函数公式如下图:
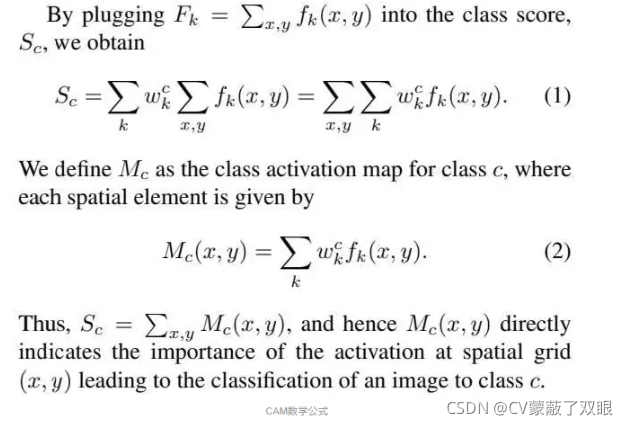
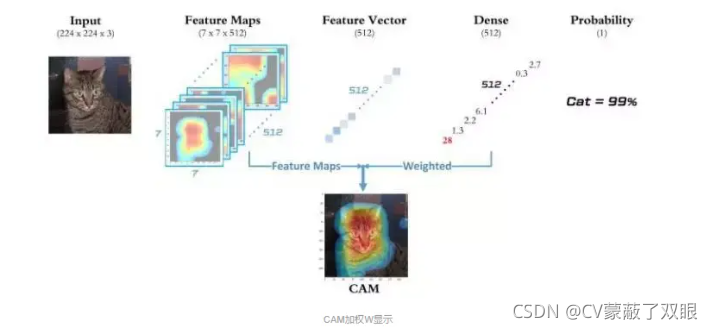
经过上面的公式W加权的特征图集重叠而成的一个特征图,模型做出分类决策的依据来源于W 矩阵。那么如何进行可视化呢?W矩阵本身只是一堆大小不一的权值而已,并不直观。不过我们可以注意到, W 矩阵对图像的理解基于对特征向量的加权,而特征向量背后是一个个特征图,因此可以跳过特征向量,直接将这些特征图用 W加权,再重叠合成为一张特征图,就可以很直观的看到到底模型是通过看哪片区域来做出判断的。
详细的coding 如下展示 :
from keras.applications.vgg16 import VGG16
from keras import backend as K

model = VGG16(weights = 'imagenet')
from keras.preprocessing import image
from keras.applications.vgg16 import preprocess_input, decode_predictions
import numpy as np

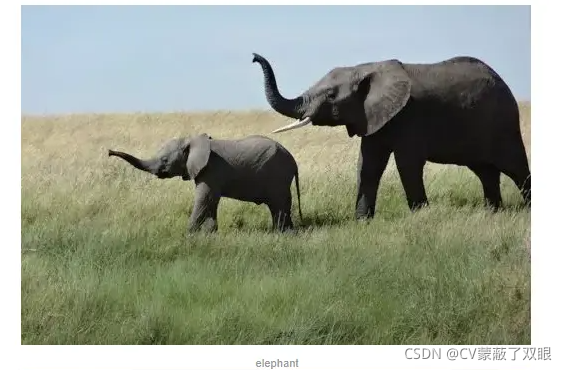
img_path = 'imgs/elephant.png'
# 大 小 为 224×224 的 Python图像库(PIL,Python imaginglibrary)图像
img = image.load_img(img_path,target_size=(224,224))
# 形 状 为 (224, 224, 3) 的float32 格式的 Numpy 数组
x = image.img_to_array(img)
# 添加一个维度,将数组转换为(1, 224, 224, 3) 形状的批量
x = np.expand_dims(x,axis = 0)
# 对批量进行预处理(按通道进行颜色标准化)
x = preprocess_input(x)
preds = model.predict(x)
print('Predicted:',decode_predictions(preds,top=3)[0])
Predicted: [('n02504458', 'African_elephant', 0.7816769), ('n01871265', 'tusker', 0.20359665), ('n02504013', 'Indian_elephant', 0.014230473)]
np.argmax(preds[0])
386
# 使用 Grad-CAM 算法
#预测向量中的非洲象元素
african_elephant_output = model.output[:, 386]
#得到指定层的输出特征图,这是Vgg16最后一个卷积层
last_conv_layer = model.get_layer('block5_conv3')
# 得到非洲象在block5_conv3输出特征图的梯
grads = K.gradients(african_elephant_output,last_conv_layer.output)[0]
#(512,)的向量,每个元素是特征图通道的梯度平均大小
pooled_grads = K.mean(grads, axis=(0, 1, 2))
#访问pooled_grads:对于给定的样本图像,pooled_grads和block5_conv3层的输出特征图
iterate = K.function([model.input],
                     [pooled_grads, last_conv_layer.output[0]])

pooled_grads_value, conv_layer_output_value = iterate([x])

#将特征图数组中的每个通道*这个通道对“大象”类别的重要程度。
for i in range(512):
     conv_layer_output_value[:, :, i] *= pooled_grads_value[i]

#得到特征图的逐个通道平均值即类激活热力图
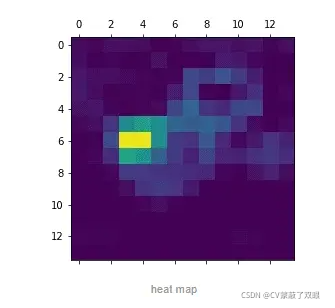
heatmap = np.mean(conv_layer_output_value, axis=-1)
#绘制热力图
import matplotlib.pyplot as plt

heatmap = np.maximum(heatmap, 0)
heatmap /= np.max(heatmap)
plt.matshow(heatmap)
plt.show()
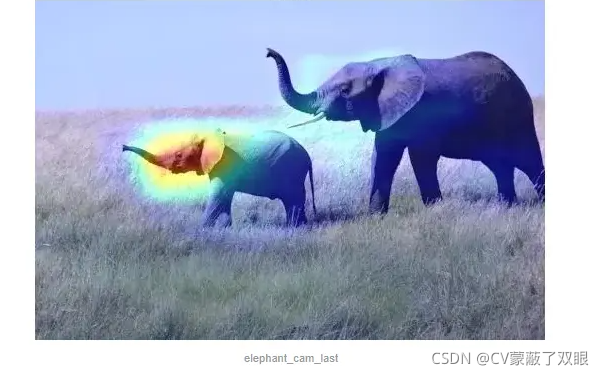
# 最后,我们可以用 OpenCV 来生成一张图像,将原始图像叠加在刚刚得到的热力图上
import CV2
img = CV2.imread(img_path)
heatmap = CV2.resize(heatmap, (img.shape[1], img.shape[0]))
heatmap = np.uint8(255 * heatmap)
# 将热力图应用于原始图像
heatmap = CV2.applyColorMap(heatmap, CV2.COLORMAP_JET)
# 这里的 0.4 是热力图强度因子
superimposed_img = heatmap * 0.4 + img
CV2.imwrite('elephant_cam_last.jpg', superimposed_img)
3.使用已有的数据绘制热力图
def get_patient_df(patient_id):
    return data.loc[data['patient_id']== patient_id,:]
n_rows = 5
n_cols = 3
n_imgs = n_rows*n_cols
colors = ['pink', 'red']

fig, ax = plt.subplots(n_rows,n_cols,figsize=(20, 22))

patient_ids = np.random.choice( data.patient_id.unique(), size=n_imgs, replace=False)

for row in range(n_rows):
    for col in range(n_cols):
        patient_id = patient_ids[col + n_cols*row]
        patient_df = get_patient_df(patient_id)

        ax[row,col].scatter(patient_df.x.values, \
                            patient_df.y.values, \
                            c=patient_df.target.values,\
                            cmap=ListedColormap(colors), s=20)
        ax[row,col].set_title("patient " + patient_id)

4.总结
分三篇内容介绍了不同的热力图,相信大家在最后的文章中一定有它的身影,关于热力图的其他应用还需要大家再去开发,这里只是简单的介绍一下用法。
5.参考
https://www.bilibili.com/read/cv4020256/
https://blog.csdn.net/guaguastd/article/details/107479653
https://blog.csdn.net/weixin_43453533/article/details/97927826
https://www.kaggle.com/amerii/breast-cancer-classification-guide-pca-svms
https://www.kaggle.com/midouazerty/breast-cancer-images-classification
https://www.kaggle.com/allunia/breast-cancer