直方图的介绍
-
在OpenCV中,我们可以使用直方图对我们图像的像素点进行统计操作。像素点的区间0-255也就是直方图的横坐标,像素点的个数也就是直方图的纵坐标。
-
通常我们会使用cv2.calcHist(images,channels,mask,histSize,ranges)函数。
- images: 原图像图像格式为 uint8 或 ?oat32。当传入函数时应 用中括号 [] 括来例如[img]
- channels: 同样用中括号括来它会告函数我们统幅图 像的直方图。如果入图像是灰度图它的值就是 [0]如果是彩色图像 的传入的参数可以是 [0][1][2] 它们分别对应着 BGR。
- mask: 掩模图像。统整幅图像的直方图就把它为 None。但是如 果你想统图像某一分的直方图的你就制作一个掩模图像并 使用它。
- histSize:BIN 的数目,也使用中括号。
- ranges: 像素值范围常为 [0-256]。
-
代码示例
img = cv2.imread('cat.jpg',0) #0表示灰度图
hist = cv2.calcHist([img],[0],None,[256],[0,256])
hist.shape
(256, 1)
plt.hist(img.ravel(),256);
plt.show()

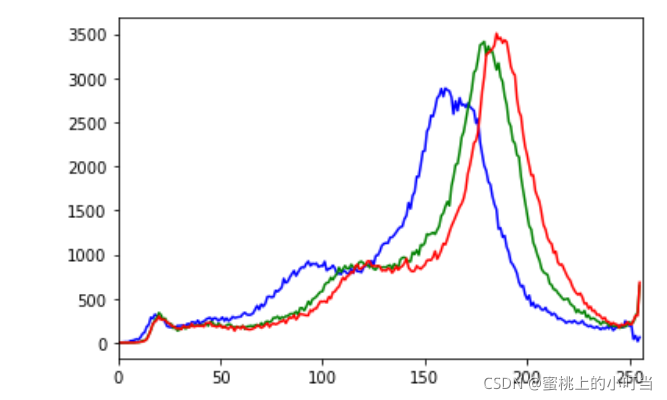
- 三个颜色通道所呈现的直方图统计
img = cv2.imread('cat.jpg')
color = ('b','g','r')
for i,col in enumerate(color):
    histr = cv2.calcHist([img],[i],None,[256],[0,256])
    plt.plot(histr,color = col)
    plt.xlim([0,256])

- mask掩码操作
# 创建mask
mask = np.zeros(img.shape[:2], np.uint8)
print (mask.shape)
#保存什么值就把什么值设为255
mask[100:300, 100:400] = 255
#与操作
masked_img = cv2.bitwise_and(img, img, mask=mask)
hist_full = cv2.calcHist([img], [0], None, [256], [0, 256])
hist_mask = cv2.calcHist([img], [0], mask, [256], [0, 256])
plt.subplot(221), plt.imshow(img, 'gray')
plt.subplot(222), plt.imshow(mask, 'gray')
plt.subplot(223), plt.imshow(masked_img, 'gray')
plt.subplot(224), plt.plot(hist_full), plt.plot(hist_mask)
plt.xlim([0, 256])
plt.show()

直方图均衡化
均衡化原理
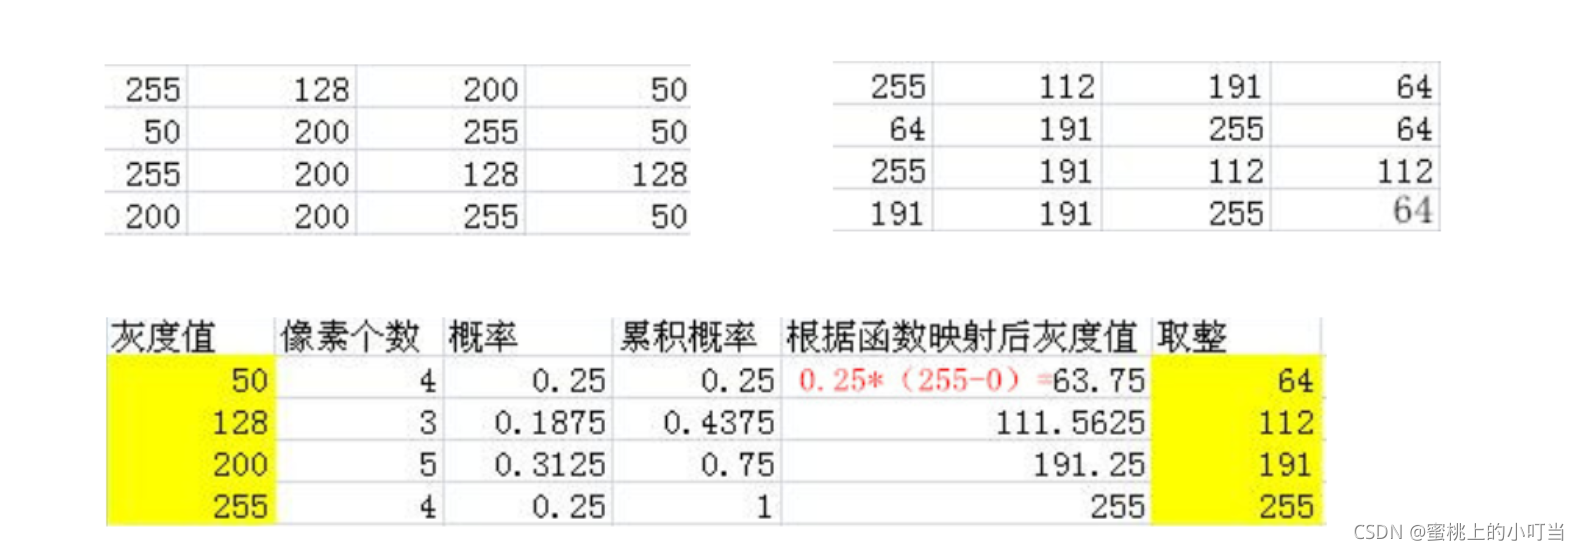
- 直方图均衡化原理:统计出来的像素点的值之间的差距比较大,我们需要缩小像各个像素点之间的值得差距,这就叫均衡化。具体示例见下图:

- 左上表格为原始的像素值,右上表格是均衡化之后的像素值。具体实现为下面的表格。
- 计算步骤首先计算出各个像素点的概率值,计算出累计概率,然后通过映射函数计算出灰度值,最后取整就得到均衡化之后的结果。
均衡化操作
- 在OpenCV中如何实现均衡化呢?这里我们使用cv2.equalizeHist(img) 这个函数,具体代码实现如下:
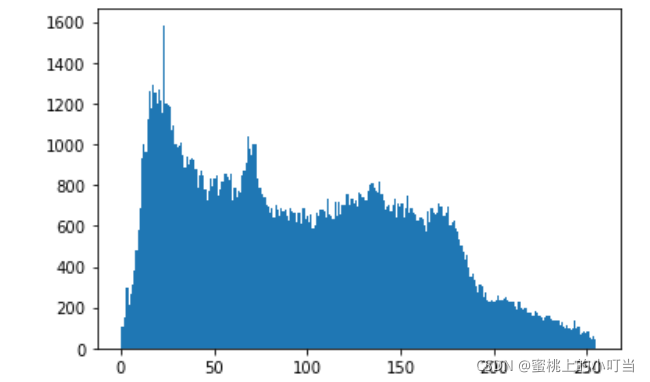
#均衡化前
img = cv2.imread('clahe.jpg',0) #0表示灰度图 #clahe
plt.hist(img.ravel(),256);
plt.show()

#均衡化后
equ = cv2.equalizeHist(img)
plt.hist(equ.ravel(),256)
plt.show()

- 均衡化图片前后对比
res = np.hstack((img,equ))
cv_show(res,'res')

- 虽然图片变亮眼了,但是却丢失了一些细节。我们可以使用自适应均衡化的操作,例如将图片分格之后进行均衡化操作。代码如下:
clahe = cv2.createCLAHE(clipLimit=2.0, tileGridSize=(8,8))
res_clahe = clahe.apply(img)
res = np.hstack((img,equ,res_clahe))
cv_show(res,'res')
