使用Excel分析身高体重表
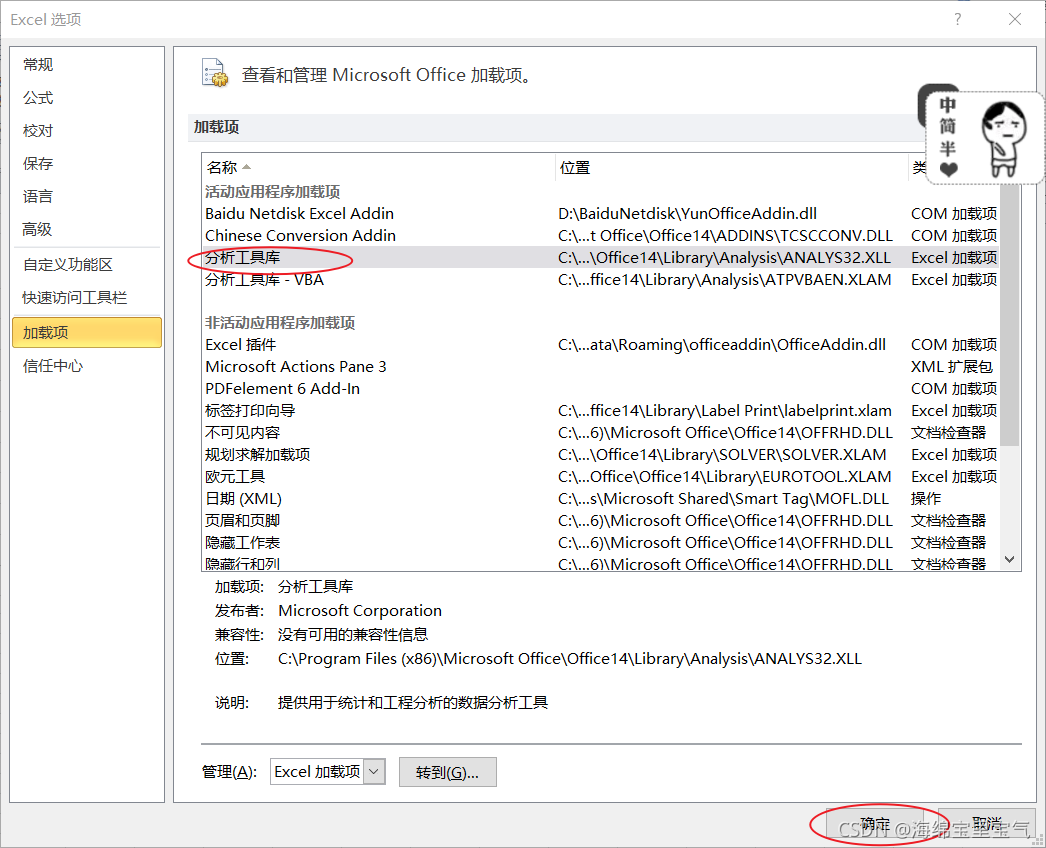
要使用excel分析数据首先要在文件->选项->加载项->分析工具库打开数据分析功能(默认是没有打开的)
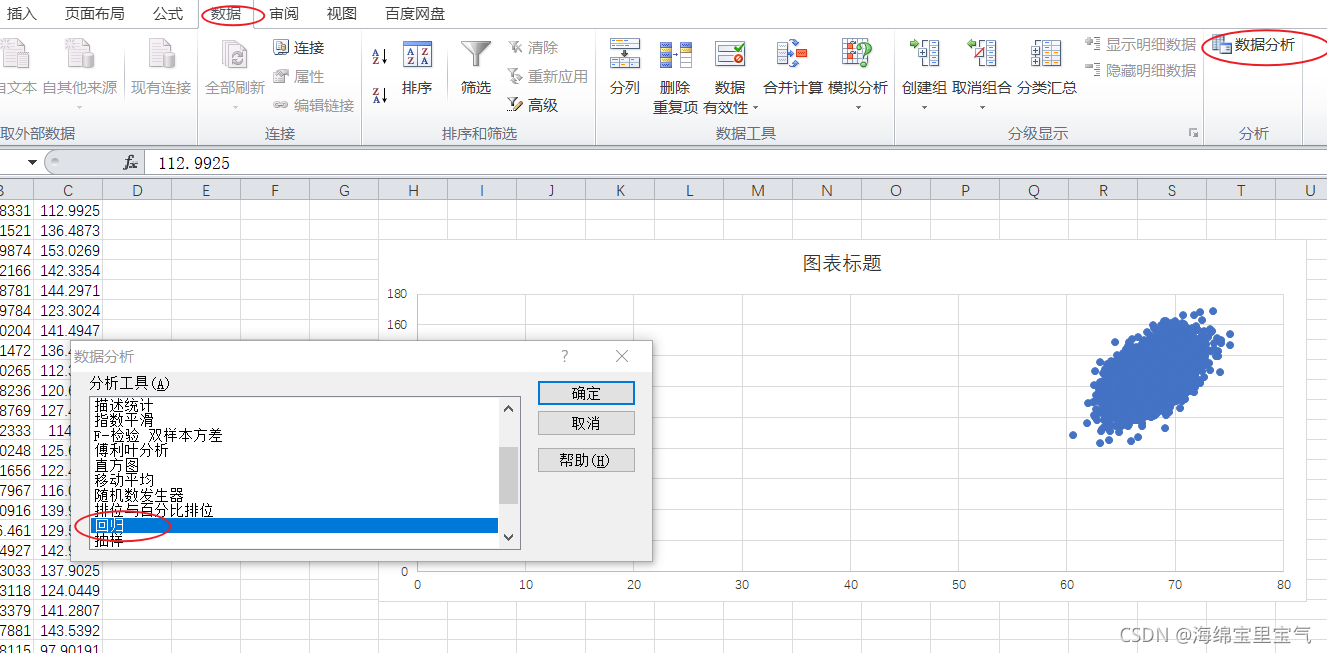
选择数据->数据分析->回归
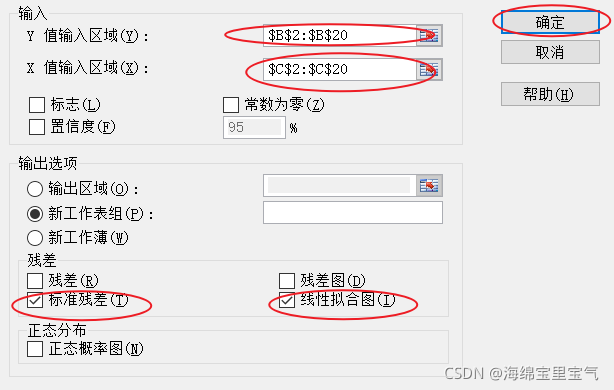
选择x,y的值,勾选标准残差和线性拟合图
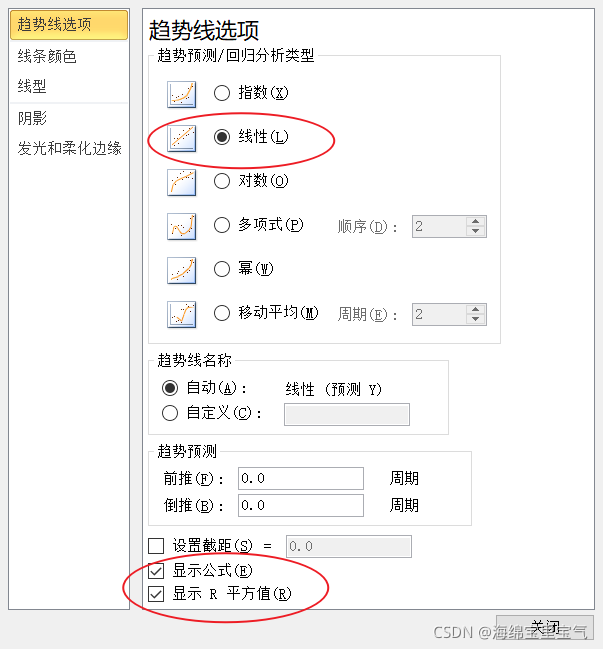
右键拟合图选择现价趋势线->线性->显示公式->显示R的平方值->确定
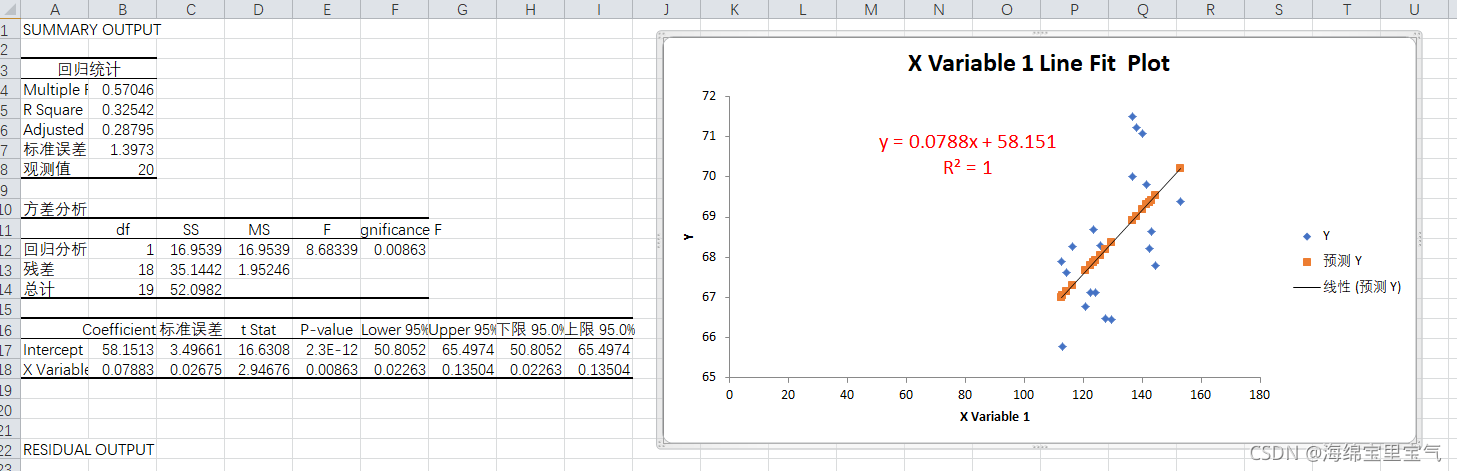
选取20组数据进行分析
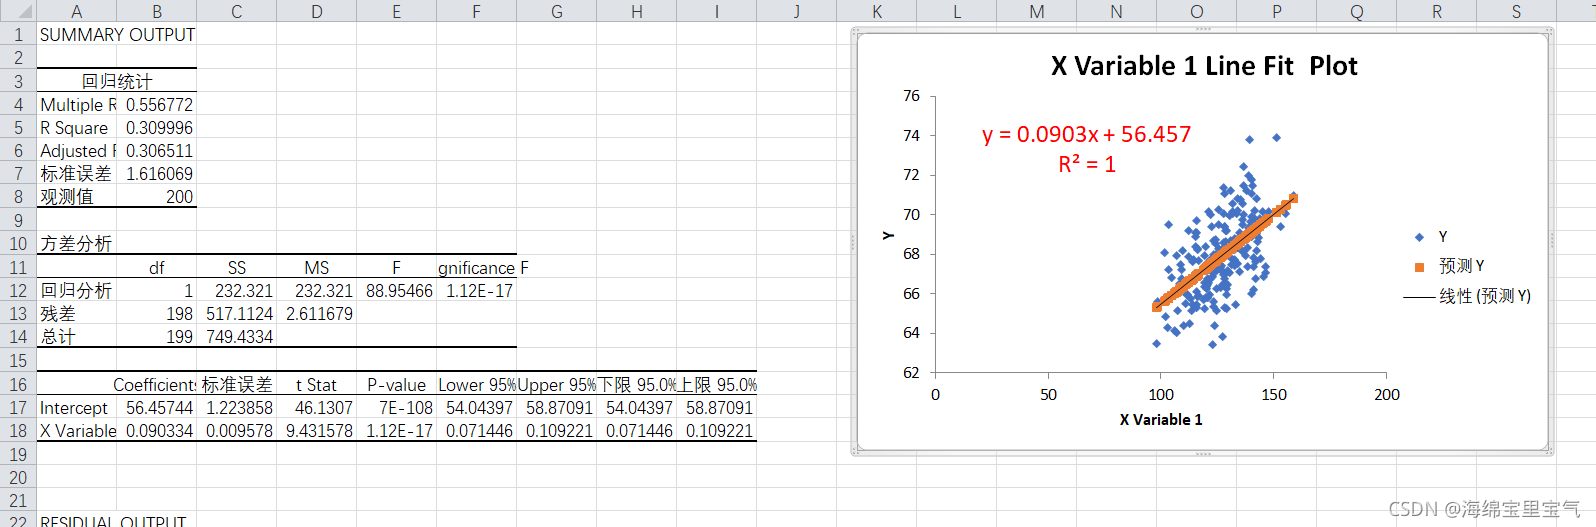
选取200组数据进行分析
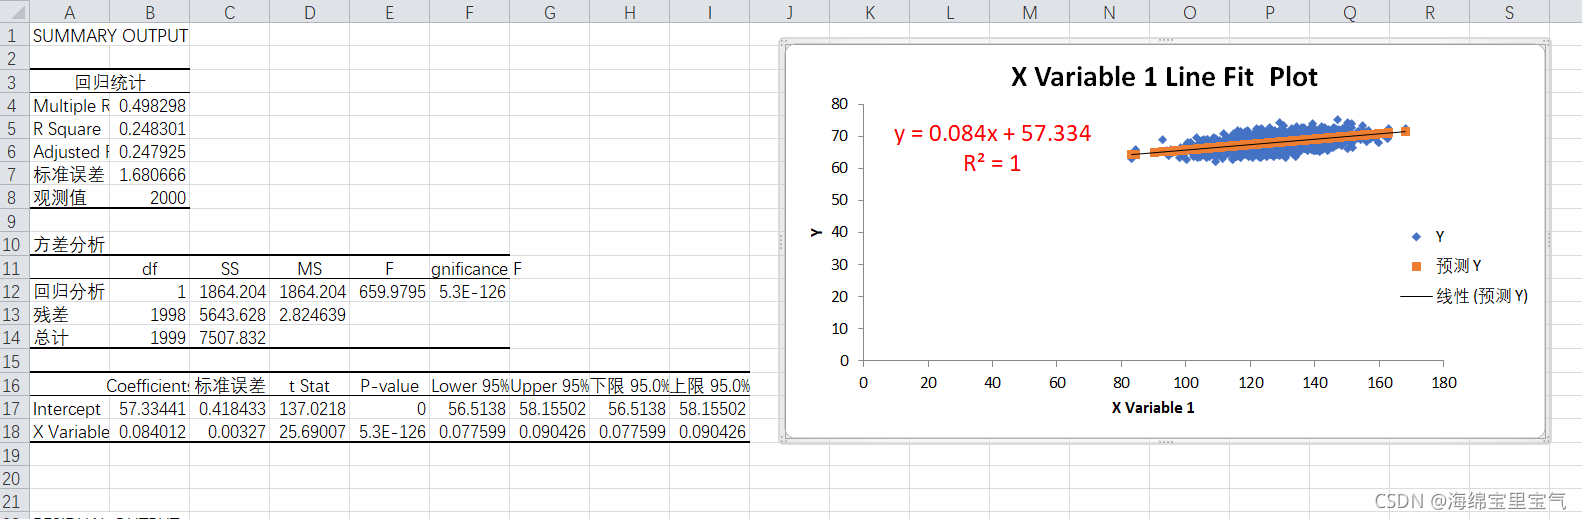
选取2000组数据进行分析
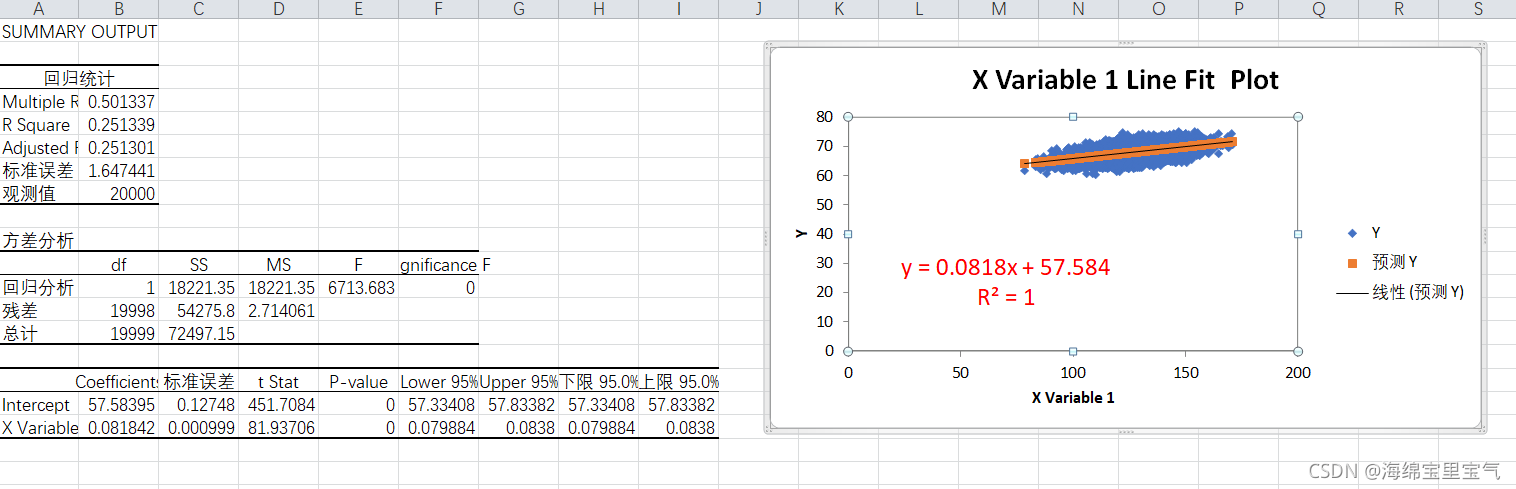
选取20000组数据进行分析
用jupyter notebook编程使用最小二乘法分析身高体重表
在jupyter的web网页中新建python3文件
注意数据文件的编码方式要是utf-8,如果是gbk会报错
#用jupyter编程(不借助第三方库),用最小二乘法,
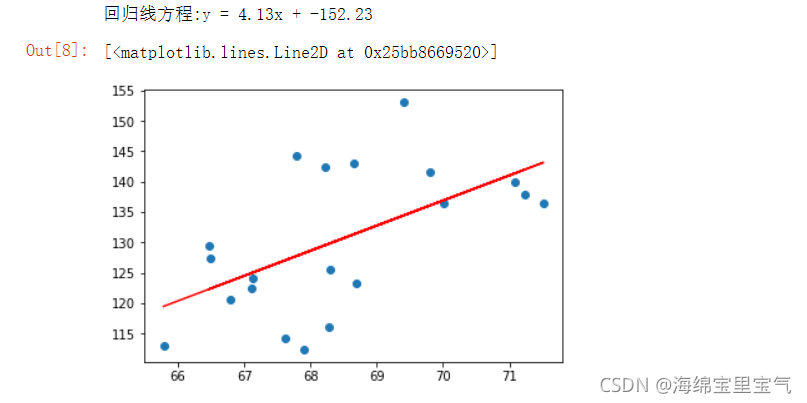
#当体重X变量取20个的时候
import numpy as np
import matplotlib.pyplot as plt
%matplotlib inline
points = np.genfromtxt("D:\Download\weights_heights.csv",delimiter=",")
#points
#提取points中的两列数据,分别作为x,y
# 回归方程y = ax + b 求a 和 b
x=points[1:21,1];
y=points[1:21,2];
x_mean = np.mean(x)
y_mean = np.mean(y)
xsize = x.size
zi = (x * y).sum() - xsize * x_mean *y_mean
mu = (x ** 2).sum() - xsize * x_mean ** 2
# 参数a b
a = zi / mu
b = y_mean - a * x_mean
# 这里对参数保留两位有效数字
a = np.around(a,decimals=2)
b = np.around(b,decimals=2)
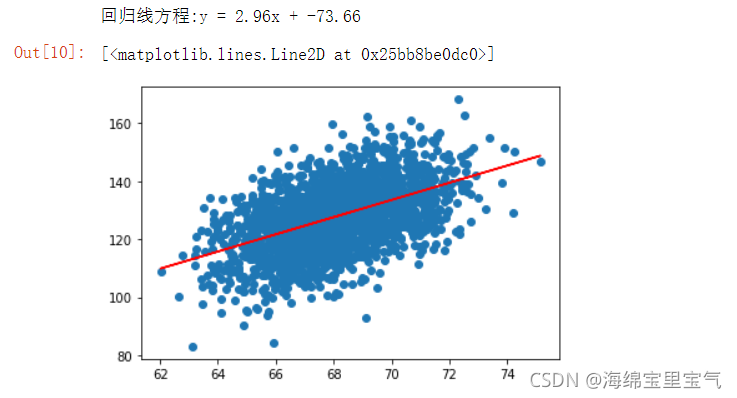
print(f'回归线方程:y = {a}x + {b}')
#借助第三方库skleran画出拟合曲线
y1 = a*x + b
plt.scatter(x,y)
plt.plot(x,y1,c='r')
选取20组数据进行分析
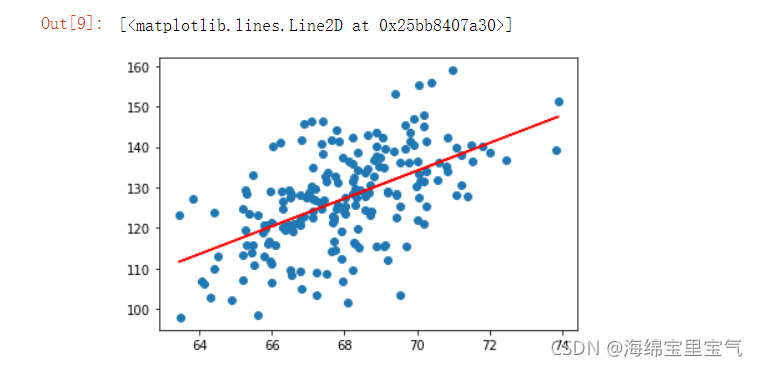
选取200组数据进行分析
选取2000组数据进行分析
选取20000组数据进行分析
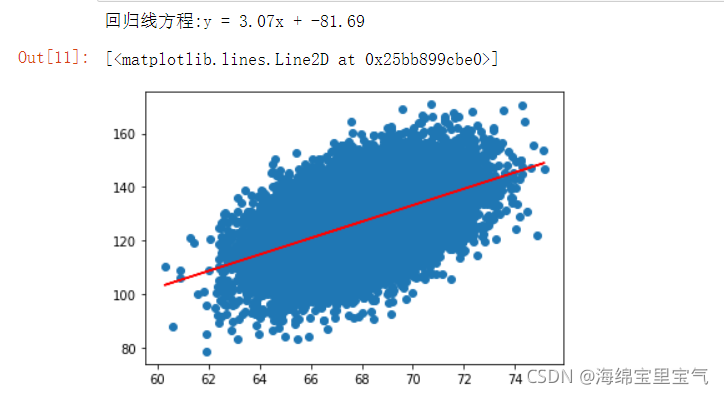
用jupyter notebook编程借助skleran分析身高体重表
import pandas;
import matplotlib;
from pandas.plotting import scatter_matrix;
data = pandas.read_csv("D:\Download\weights_heights.csv",engine='python',encoding='utf-8')
#绘制多个变量两两之间的散点图:scatter_matrix()方法
font = {
'family' : 'SimHei'
}
matplotlib.rc('font', **font)
scatter_matrix(
data[["Height", "Weight"]],
figsize=(10, 10), diagonal='kde'
) #diagonal参数表示变量与变量本身之间的绘图方式,kde代表直方图
#求相关系数矩阵
data[["Height", "Weight"]].corr()
x = data[["Height"]]
y = data[["Weight"]]
from sklearn.linear_model import LinearRegression
#建模
lrModel = LinearRegression()
#训练模型
lrModel.fit(x, y)
#评分
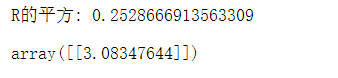
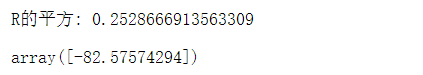
R2=lrModel.score(x, y)
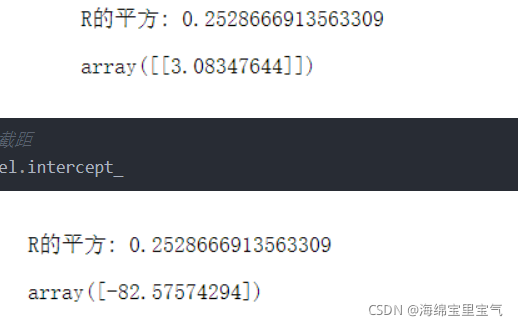
print("R的平方:",R2)
#查看参数
lrModel.coef_
#查看截距
lrModel.intercept_
总结
综上可以看出excel的拟合误差较大,最小二乘法拟合效果与skleran分析拟合效果相近。