本教程代码开源:GitHub 欢迎star
文章目录
一、法线估计
1. 参数说明
由于 PCL 中几乎所有类都继承自基本pcl::PCLBase类,因此pcl::Feature类以两种不同的方式接受输入数据:
一个完整的点云数据集,通过setInputCloud (PointCloudConstPtr &) -强制
任何特征估计类都将尝试估计给定输入云中每个点的特征。
点云数据集的子集,通过setInputCloud (PointCloudConstPtr &)和setIndices (IndicesConstPtr &) 给出-可选
任何特征估计类都将尝试估计给定输入云中每个点的特征,该点在给定索引列表中具有索引。默认情况下,如果没有给出一组索引,则将考虑云中的所有点。
此外,可以通过附加调用**setSearchSurface (PointCloudConstPtr &)**指定要使用的点邻居集。此调用是可选的,当未给出搜索面时,默认使用输入点云数据集。
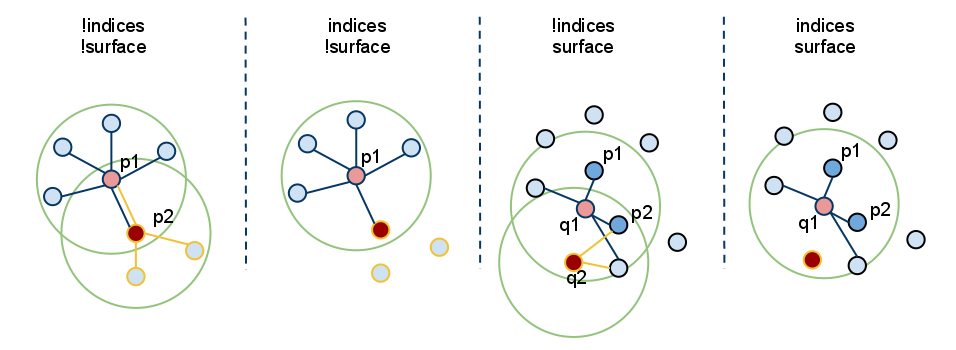
因为**setInputCloud()*总是需要的,所以我们可以使用<setInputCloud(), setIndices(), setSearchSurface()>*创建最多四种组合。假设我们有两个点云,P={p_1, p_2, …p_n} 和 Q={q_1, q_2, …, q_n}。下图显示了所有四种情况:

-
setIndices() = false, setSearchSurface() = false - 这无疑是 PCL 中最常用的情况,其中用户只是输入单个 PointCloud 数据集并期望在云中的所有点估计某个特征。
由于我们不希望根据是否给出一组索引和/或搜索表面来维护不同的实现副本,因此每当索引 = false 时,PCL 都会创建一组内部索引(作为std::vector)基本上指向整个数据集(索引=1…N,其中 N 是云中的点数)。
在上图中,这对应于最左边的情况。首先,我们估计 p_1 的最近邻居,然后是 p_2 的最近邻居,依此类推,直到我们用尽 P 中的所有点。
-
setIndices() = true, setSearchSurface() = false - 如前所述,特征估计方法只会计算那些在给定索引向量中有索引的点的特征;
在上图中,这对应于第二种情况。在这里,我们假设 p_2 的索引不是给定的索引向量的一部分,因此不会在 p2 估计邻居或特征。
-
setIndices() = false, setSearchSurface() = true - 与第一种情况一样,将对作为输入给出的所有点的特征进行估计,但是,在setSearchSurface() 中给出的底层相邻表面将用于获取输入的最近邻点,而不是输入云本身;
在上图中,这对应于第三种情况。如果 Q={q_1, q_2} 是另一个作为输入给出的云,不同于 P,并且 P 是 Q 的搜索表面,那么 q_1 和 q_2 的邻居将从 P 计算。
-
setIndices() = true, setSearchSurface() = true - 这可能是最罕见的情况,其中索引和搜索表面都被给出。在这种情况下,将使用setSearchSurface() 中给出的搜索表面信息,仅为<input,indices> 对中的一个子集估计特征。
最后,在上图中,这对应于最后一个(最右边)的情况。在这里,我们假设 q_2 的索引不是为 Q 给出的索引向量的一部分,因此不会在 q2 估计邻居或特征。
应该使用**setSearchSurface()**时最有用的例子是,当我们有一个非常密集的输入数据集,但我们不想估计其中所有点的特征,而是估计使用pcl_keypoints 中的方法发现的某些关键点=时,或者在云的下采样版本(例如,使用pcl::VoxelGrid过滤器获得)。在这种情况下,我们通过setInputCloud()传递下采样/关键点输入,并将原始数据作为setSearchSurface() 传递。
2. 例子
输入一旦确定,就可使用查询点的相邻点来估计局部特征表示,这表示捕获查询点周围的底层采样表面的几何形状。描述表面几何形状的一个重要问题是首先推断其在坐标系中的方向,即估计其法线。表面法线是表面的重要属性,在许多领域(例如计算机图形应用程序)中大量使用,以应用生成阴影和其他视觉效果的正确光源(有关更多信息,请参阅[RusuDissertation])。
代码见01_3DFeaturesWork.py
- 为输入数据集中的所有点估计一组表面法线
# 估计法线
# 输入数据集中的所有点估计一组表面法线
ne = pcl.features.NormalEstimation.PointXYZ_Normal()
ne.setInputCloud(cloud)
tree = pcl.search.KdTree.PointXYZ()
ne.setSearchMethod(tree)

cloud_normals = pcl.PointCloud.Normal()
ne.setRadiusSearch(0.003)
ne.compute(cloud_normals)
print(cloud_normals.size())
- 为输入数据集中的点子集估计一组表面法线。
ne = pcl.features.NormalEstimation.PointXYZ_Normal()
ne.setInputCloud(cloud)
tree = pcl.search.KdTree.PointXYZ()
ne.setSearchMethod(tree)
ind = pcl.PointIndices()
[ind.indices.append(i) for i in range(0, cloud.size() // 2)]
ne.setIndices(ind)
cloud_normals = pcl.PointCloud.Normal()
ne.setRadiusSearch(0.003)
ne.compute(cloud_normals)
print(cloud_normals.size())
-
为输入数据集中的所有点估计一组表面法线,但使用另一个数据集估计它们的最近邻
在这里,我们使用点云的下采样点云作为输入点云,使用原点云作为SearchSurface。
ne = pcl.features.NormalEstimation.PointXYZ_Normal()
cloud_downsampled = pcl.PointCloud.PointXYZ()  # 获取一个降采样的点云 方法比较多,这里使用voxelized方法
vox = pcl.filters.VoxelGrid.PointXYZ()
vox.setInputCloud(cloud)
vox.setLeafSize(0.005, 0.005, 0.005)
vox.filter(cloud_downsampled)
ne.setInputCloud(cloud_downsampled)
ne.setSearchSurface(cloud)
tree = pcl.search.KdTree.PointXYZ()
ne.setSearchMethod(tree)
cloud_normals = pcl.PointCloud.Normal()
ne.setRadiusSearch(0.003)
ne.compute(cloud_normals)
print(cloud_normals.size())
下图分别为原始电云和下采样点云。

详细内容可参考how-3d-features-work,本文档不再赘述。
二、使用积分图像的法线估计
在本教程中,我们将学习如何使用积分图像计算有组织的点云的法线。
1. 代码
见04_normal_estimation_using_integral_images.py
# 加载点云
cloud = pcl.PointCloud.PointXYZ()
reader = pcl.io.PCDReader()
reader.read("../../data/table_scene_mug_stereo_textured.pcd", cloud)
# 估计法线
normals = pcl.PointCloud.Normal()
ne = pcl.features.IntegralImageNormalEstimation.PointXYZ_Normal()
ne.setNormalEstimationMethod(ne.AVERAGE_3D_GRADIENT)
ne.setMaxDepthChangeFactor(0.02)
ne.setNormalSmoothingSize(10.0)
ne.setInputCloud(cloud)
ne.compute(normals)

# # 可视化
# viewer = pcl.visualization.PCLVisualizer("viewer")
# viewer.setBackgroundColor(0.0, 0.0, 0.0)
# viewer.addPointCloud(cloud, "sample cloud")  # 显示点云
# # viewer.addPointCloudNormals(cloud, normals)  # 显示点云和法线 该函数bug未修复~
#
# while not viewer.wasStopped():
#     viewer.spinOnce(10)

# 使用pyvista可视化
p = pv.Plotter()
cloud = pv.wrap(cloud.xyz)
p.add_mesh(cloud, point_size=1, color='g')
p.camera_position = 'iso'
p.enable_parallel_projection()
p.show_axes()
p.show()
在可视化法线时,遇到了一下错误:
In..\Rendering\Core\vtkActor.cxx, line 43. Error: no override found for vtkactor
查看了pclpy的官方Issue,发现有人提过这个Issue,这个bug还未修复
issue:https://github.com/davidcaron/pclpy/issues/58
感觉pclpy在可视化这一块儿bug比较多(目前已发现的有:无法可视化mesh、带法线的点云),在python中可视化功能可使用pyvista代替。事实上,作者可能也意识到了这个问题,在最新的pclpy v1.12.0移除了可视化模块。
2. 说明
这里只挑重要的几行代码说一下。
# 估计法线
normals = pcl.PointCloud.Normal()
ne = pcl.features.IntegralImageNormalEstimation.PointXYZ_Normal()
ne.setNormalEstimationMethod(ne.AVERAGE_3D_GRADIENT)
ne.setMaxDepthChangeFactor(0.02)
ne.setNormalSmoothingSize(10.0)
ne.setInputCloud(cloud)
ne.compute(normals)
可以使用以下常规估计方法:
enum NormalEstimationMethod
{
  COVARIANCE_MATRIX,
  AVERAGE_3D_GRADIENT,
  AVERAGE_DEPTH_CHANGE
};
COVARIANCE_MATRIX 模式创建 9 个积分图像,以根据其局部邻域的协方差矩阵计算特定点的法线。AVERAGE_3D_GRADIENT 模式创建 6 个积分图像来计算水平和垂直 3D 梯度的平滑版本,并使用这两个梯度之间的叉积计算法线。AVERAGE_DEPTH_CHANGE 模式仅创建单个积分图像并根据平均深度变化计算法线。
三、点特征直方图(PFH)
理论部分请参考RusuDissertation 。在此不再赘述。
1. 代码
点特征直方图作为pcl_features库的一部分在 PCL 中实现。
默认的 PFH 实现使用 5 个分箱细分(例如,四个特征值中的每一个都将使用其值区间中的这么多分箱),并且不包括距离(如上所述 - 尽管如果需要,用户可以调用computePairFeatures方法来获取距离),这会生成一个 125 字节 5 3 5^3 53的浮点值数组 ( )。这些存储在pcl::PFHSignature125点类型中。
以下代码片段将为输入数据集中的所有点估计一组 PFH 特征。
见05_PHF_descriptors.py
import pclpy
from pclpy import pcl
import numpy as np
import sys

if __name__ == '__main__':
    # 生成点云数据
    # 加载点云
    cloud = pcl.PointCloud.PointXYZ()
    reader = pcl.io.PCDReader()
    reader.read("../../data/bunny.pcd", cloud)
    print(cloud.size())
    # 构造法线估计类
    ne = pcl.features.NormalEstimation.PointXYZ_Normal()
    ne.setInputCloud(cloud)

    tree = pcl.search.KdTree.PointXYZ()
    ne.setSearchMethod(tree)

    normals = pcl.PointCloud.Normal()
    ne.setRadiusSearch(0.03)
    # 计算法线
    ne.compute(normals)
    print(normals.size())

    # 构造PFH estimation类,把cloud和normals传递进去
    pfh = pcl.features.PFHEstimation.PointXYZ_Normal_PFHSignature125()
    pfh.setInputCloud(cloud)
    pfh.setInputNormals(normals)
    # 或者,如果cloud是PointNormal类型,执行pfh.setInputNormals(cloud);

    # 构造一个kd树
    # 它的内容将根据给定的输入点云填充到对象内部(因为没有给出其他搜索面)。
    tree = pcl.search.KdTree.PointXYZ()
    pfh.setSearchMethod(tree)

    # 输出
    pfhs = pcl.PointCloud.PFHSignature125()

    # 使用5cmm球形范围内的邻居点
    # 注意:在这里使用的半径必须大于用来估计表面法线的半径!!
    pfh.setRadiusSearch(0.05)

    # 计算特征
    pfh.compute(pfhs)

    print(pfhs.size())  # pfhs与cloud size应该相同
来自PFHEstimation类的实际计算调用在内部不执行任何操作,但它做了下面的事:
for each point p in cloud P
  1. get the nearest neighbors of p
  2. for each pair of neighbors, compute the three angular values
  3. bin all the results in an output histogram
要从 k 邻域计算单个 PFH 表示,PCL 可以使用:
computePointPFHSignature (const pcl::PointCloud<PointInT> &cloud,
                          const pcl::PointCloud<PointNT> &normals,
                          const std::vector<int> &indices,
                          int nr_split,
                          Eigen::VectorXf &pfh_histogram);
但是pclpy尚未实现该函数。
出于效率原因,PFHEstimation中的计算方法不检查法线是否包含 NaN 或无限值。将这些值传递给**compute()将导致未定义的输出。建议至少在设计处理链或设置参数时检查法线。这可以通过在调用compute()**之前插入以下代码来完成:
for i in range(normals.size()):
 if not pcl.common.isFinite(normals.at(i)):
     print('normals[%d] is not finite\n', i)
在生产代码中,应设置预处理步骤和参数,以便法线有限否则会引发错误。
经过测试,pclpy的isFinite()函数似乎不支持pcl.PointCloud.Normal()类型的点,emmmmm,pclpy的bug还是有点多啊
参考:https://pcl.readthedocs.io/projects/tutorials/en/latest/pfh_estimation.html#pfh-estimation
四、快速点特征直方图(FPFH)描述符
理论部分请参考:RusuDissertation,在此不再赘述。
1. PFH 和 FPFH 之间的差异
PFH 和 FPFH 配方之间的主要区别总结如下:
- p q p_q pq?从图中可以看出,FPFH 并没有完全互连 的所有邻居,因此缺少一些可能有助于捕获查询点周围几何的值对;
- PFH 对查询点周围的精确确定的表面进行建模,而 FPFH 包括r半径球体之外的附加点对(尽管最多2r远);
- 由于重新加权方案,FPFH结合了SPFH值并重新捕获了一些点相邻值对;
- FPFH的整体复杂度大大降低,从而使其在实时应用中使用成为可能;
- 结果直方图通过去相关值来简化,即简单地创建d 个单独的特征直方图,每个特征维度一个,并将它们连接在一起(见下图)。

2. 代码
默认的 FPFH 实现使用 11 个分箱细分(例如,四个特征值中的每一个都将使用来自其值区间的这么多分箱)和去相关方案(见上文:特征直方图单独计算并合并),结果为 33 -byte 浮点值数组。这些存储在pcl::FPFHSignature33点类型中。
以下代码片段将为输入数据集中的所有点估计一组 FPFH 特征。
见06_FPFH_descriptors.py
import pclpy
from pclpy import pcl
import numpy as np
import sys

if __name__ == '__main__':
    # 生成点云数据
    # 加载点云
    cloud = pcl.PointCloud.PointXYZ()
    reader = pcl.io.PCDReader()
    reader.read("../../data/bunny.pcd", cloud)
    print(cloud.size())
    # 构造法线估计类
    ne = pcl.features.NormalEstimation.PointXYZ_Normal()
    ne.setInputCloud(cloud)

    tree = pcl.search.KdTree.PointXYZ()
    ne.setSearchMethod(tree)

    normals = pcl.PointCloud.Normal()
    ne.setRadiusSearch(0.03)
    # 计算法线
    ne.compute(normals)
    print(normals.size())

    # 构造FPFH estimation类,把cloud和normals传递进去
    fpfh = pcl.features.FPFHEstimation.PointXYZ_Normal_FPFHSignature33()
    fpfh.setInputCloud(cloud)
    fpfh.setInputNormals(normals)
    # 或者,如果cloud是PointNormal类型,执行fpfh.setInputNormals(cloud);

    # 构造一个kd树
    # 它的内容将根据给定的输入点云填充到对象内部(因为没有给出其他搜索面)。
    tree = pcl.search.KdTree.PointXYZ()
    fpfh.setSearchMethod(tree)

    # 输出
    pfhs = pcl.PointCloud.FPFHSignature33()

    # 使用5cmm球形范围内的邻居点
    # 注意:在这里使用的半径必须大于用来估计表面法线的半径!!
    fpfh.setRadiusSearch(0.05)

    # 计算特征
    fpfh.compute(pfhs)
    print(pfhs.size())  # pfhs与cloud size应该相同
来自FPFHEstimation类的实际计算调用在内部不执行任何操作,但做了下面的事情:
for each point p in cloud P
  1. pass 1:
     1. get the nearest neighbors of :math:`p`
     2. for each pair of :math:`p, p_i` (where :math:`p_i` is a neighbor of :math:`p`, compute the three angular values
     3. bin all the results in an output SPFH histogram
  2. pass 2:
     1. get the nearest neighbors of :math:`p`
     3. use each SPFH of :math:`p` with a weighting scheme to assemble the FPFH of :math:`p`:
同样的,出于效率原因,FPFHEstimation中的计算方法不检查法线是否包含 NaN 或无限值。将这些值传递给**compute()将导致未定义的输出。建议至少在设计处理链或设置参数时检查法线。这可以通过在调用compute()**之前插入以下代码来完成:
for i in range(normals.size()):
 if not pcl.common.isFinite(normals.at(i)):
     print('normals[%d] is not finite\n', i)
在生产代码中,应设置预处理步骤和参数,以便法线有限否则会引发错误。
经过测试,pclpy的isFinite()函数似乎不支持pcl.PointCloud.Normal()类型的点,emmmmm,pclpy的bug还是有点多啊
五、估计一组点的VFH特征
理论部分请参阅:使用 VFH 描述符和/或[VFH] 的集群识别和 6DOF 姿态估计 在此不再赘述。
1. 代码
视点特征直方图作为pcl_features 库的一部分在 PCL 中实现 。
默认的 VFH 实现对三个扩展的 FPFH 值中的每一个使用 45 个分箱细分,再加上每个点和质心之间的距离的另外 45 个分箱细分和视点组件的 128 个分箱细分,从而产生一个 308 字节的浮点数组值。它们存储在pcl::VFHSignature308点类型中。
PFH/FPFH 描述符和 VFH 之间的主要区别在于,对于给定的点云数据集,只会估计单个 VFH 描述符,而生成的 PFH/FPFH 数据将具有与点数相同的条目数云端。
以下代码片段将为输入数据集中的所有点估计一组 VFH 特征。
cloud = pcl.PointCloud.PointXYZ()
reader = pcl.io.PCDReader()
reader.read("../../data/bunny.pcd", cloud)
print(cloud.size())
# 构造法线估计类
ne = pcl.features.NormalEstimation.PointXYZ_Normal()
ne.setInputCloud(cloud)

tree = pcl.search.KdTree.PointXYZ()
ne.setSearchMethod(tree)

normals = pcl.PointCloud.Normal()
ne.setRadiusSearch(0.03)
# 计算法线
ne.compute(normals)
print(normals.size())

cloud_normals = pcl.PointCloud.PointNormal().from_array(
    np.hstack((cloud.xyz, normals.normals, normals.curvature.reshape(-1, 1))))
for i in range(cloud_normals.size()):
    if not pcl.common.isFinite(cloud_normals.at(i)):
        print('cloud_normals[%d] is not finite\n', i)

        # 构造VFH estimation类,把cloud和normals传递进去
        vfh = pcl.features.VFHEstimation.PointXYZ_Normal_VFHSignature308()
        vfh.setInputCloud(cloud)
        vfh.setInputNormals(normals)
        # 或者,如果cloud是PointNormal类型,执行vfh.setInputNormals(cloud);

        # 构造一个kd树
        # 它的内容将根据给定的输入点云填充到对象内部(因为没有给出其他搜索面)。
        tree = pcl.search.KdTree.PointXYZ()
        vfh.setSearchMethod(tree)

        # 输出
        vfhs = pcl.PointCloud.VFHSignature308()

        # 计算特征
        vfh.compute(vfhs)

        print(vfhs.size())  # pfhs的size应该为1
2. 可视化VFH特征
PCL里面可以使用PCLHistogramVisualization类来可视化,python环境下选择就比较多了,下面使用Matplotlib来进行绘制。
# 使用matplotlib绘制直方图
plt.plot(vfhs.histogram[0])
plt.show()

参考: ( 1 , 2 ) http://www.willowgarage.com/sites/default/files/Rusu10IROS.pdf
六、基于转动惯量和偏心率的描述符(存在bug)
在本教程中,我们将学习如何使用pcl::MomentOfInertiaEstimation类来获取基于偏心率和转动惯量的描述符。此类还允许提取云的轴对齐和定向边界框。但请记住,提取的 OBB 不是最小可能的边界框。
理论部分请参考:Moment of inertia and eccentricity based descriptors
或访问基于转动惯量和偏心率的描述符
1. 代码
本教程点云文件: here
# 加载点云
cloud = pcl.PointCloud.PointXYZ()
reader = pcl.io.PCDReader()
reader.read("../../data/min_cut_segmentation_tutorial.pcd", cloud)

print(cloud.size())

feature_extractor = pcl.features.MomentOfInertiaEstimation.PointXYZ()
feature_extractor.setInputCloud(cloud)
feature_extractor.compute()

moment_of_inertia = pcl.vectors.Float()
eccentricity = pcl.vectors.Float()

min_point_AABB = pcl.point_types.PointXYZ()
max_point_AABB = pcl.point_types.PointXYZ()
min_point_OBB = pcl.point_types.PointXYZ()
max_point_OBB = pcl.point_types.PointXYZ()
position_OBB = pcl.point_types.PointXYZ()

rotational_matrix_OBB = np.zeros((3, 3), np.float)
major_value, middle_value, minor_value = 0.0, 0.0, 0.0
major_vector = np.zeros((3, 1), np.float)
middle_vector = np.zeros((3, 1), np.float)
minor_vector = np.zeros((3, 1), np.float)
mass_center = np.zeros((3, 1), np.float)

feature_extractor.getMomentOfInertia(moment_of_inertia)
feature_extractor.getEccentricity(eccentricity)
feature_extractor.getAABB(min_point_AABB, max_point_AABB)
feature_extractor.getEigenValues(major_value, middle_value, minor_value)    # 后面这三行似乎都不怎么管用,使用numpy数组直接作为参数的函数似乎都有这个问题。
feature_extractor.getEigenVectors(major_vector, middle_vector, minor_vector)
feature_extractor.getMassCenter(mass_center)


viewer = pcl.visualization.PCLVisualizer('3D Viewer')
viewer.setBackgroundColor(0.0, 0.0, 0.0)
viewer.addCoordinateSystem(1.0)
viewer.initCameraParameters()
viewer.addPointCloud(cloud, 'simple cloud')
viewer.addCube(min_point_AABB.x, max_point_AABB.x, min_point_AABB.y, max_point_AABB.y,
               min_point_AABB.z, max_point_AABB.z, 1.0, 1.0, 0.0, 'AABB')
viewer.setShapeRenderingProperties(5, 1, 'AABB')  # 点云用线框表示

position = np.array([[position_OBB.x], [position_OBB.y], [position_OBB.z]],
                    np.float)
quat = pclpy.pcl.vectors.Quaternionf()
viewer.addCube(position, quat, max_point_OBB.x - min_point_OBB.x,
               max_point_OBB.y - min_point_OBB.y, max_point_OBB.z - min_point_OBB.z, "OBB")
viewer.setShapeRenderingProperties(5, 1, "OBB")

center = pcl.point_types.PointXYZ()
center.x, center.y, center.z = mass_center[0], mass_center[1], mass_center[2]

x_axis = pcl.point_types.PointXYZ()
x_axis.x, x_axis.y, x_axis.z = major_vector[0] + mass_center[0],\
                               major_vector[1] + mass_center[1],\
                               major_vector[2] + mass_center[2]

y_axis = pcl.point_types.PointXYZ()
y_axis.x, y_axis.y, y_axis.z = middle_vector[0] + mass_center[0],\
                               middle_vector[1] + mass_center[1],\
                               middle_vector[2] + mass_center[2]

z_axis = pcl.point_types.PointXYZ()
z_axis.x, z_axis.y, z_axis.z = minor_vector[0] + mass_center[0], \
                               minor_vector[1] + mass_center[1], \
                               minor_vector[2] + mass_center[2]
viewer.addLine(center, x_axis, 1.0, 0.0, 0.0,  "major eigen vector")
viewer.addLine(center, y_axis, 0.0, 1.0, 0.0, "middle eigen vector")
viewer.addLine(center, z_axis, 0.0, 0.0, 1.0, "minor eigen vector")

while not viewer.wasStopped():
    viewer.spinOnce(10)
2. 说明
现在让我们研究一下这段代码的目的是什么。前几行将被省略,因为它们很明显。
# 加载点云
cloud = pcl.PointCloud.PointXYZ()
reader = pcl.io.PCDReader()
reader.read("../../data/min_cut_segmentation_tutorial.pcd", cloud)
只是从 .pcd 文件加载云。
feature_extractor = pcl.features.MomentOfInertiaEstimation.PointXYZ()
feature_extractor.setInputCloud(cloud)
feature_extractor.compute()
这是pcl::MomentOfInertiaEstimation类的实例化。紧接着我们设置输入点云并开始计算过程。
moment_of_inertia = pcl.vectors.Float()
eccentricity = pcl.vectors.Float()

min_point_AABB = pcl.point_types.PointXYZ()
max_point_AABB = pcl.point_types.PointXYZ()
min_point_OBB = pcl.point_types.PointXYZ()
max_point_OBB = pcl.point_types.PointXYZ()
position_OBB = pcl.point_types.PointXYZ()

rotational_matrix_OBB = np.zeros((3, 3), np.float)
major_value, middle_value, minor_value = 0.0, 0.0, 0.0
major_vector = np.zeros((3, 1), np.float)
middle_vector = np.zeros((3, 1), np.float)
minor_vector = np.zeros((3, 1), np.float)
mass_center = np.zeros((3, 1), np.float)
这是我们声明存储描述符和边界框所需的所有必要变量。
feature_extractor.getMomentOfInertia(moment_of_inertia)
feature_extractor.getEccentricity(eccentricity)
feature_extractor.getAABB(min_point_AABB, max_point_AABB)
feature_extractor.getEigenValues(major_value, middle_value, minor_value)    # 后面这三行似乎都不怎么管用,使用numpy数组直接作为参数的函数似乎都有这个问题。
feature_extractor.getEigenVectors(major_vector, middle_vector, minor_vector)
feature_extractor.getMassCenter(mass_center)
获取描述符和其他属性。
注意,getEigenValues(),getEigenVectors(),getMassCenter()这三个函数似乎没有起作用,使用numpy数组直接作为参数的函数似乎都有这个问题,前面几例子中求质心的时候也碰到过。
所以事实上,本教程只对 AABB进行了可视化,对于OBB,暂不能实现。后续有时间了,可以用numpy实现一下。
viewer = pcl.visualization.PCLVisualizer('3D Viewer')
viewer.setBackgroundColor(0.0, 0.0, 0.0)
viewer.addCoordinateSystem(1.0)
viewer.initCameraParameters()
viewer.addPointCloud(cloud, 'simple cloud')
viewer.addCube(min_point_AABB.x, max_point_AABB.x, min_point_AABB.y, max_point_AABB.y,
               min_point_AABB.z, max_point_AABB.z, 1.0, 1.0, 0.0, 'AABB')
viewer.setShapeRenderingProperties(5, 1, 'AABB')  # 点云用线框表示
创建PCLVisualizer用于结果可视化的类实例。在这里,我们还添加了云和 AABB 以进行可视化。我们设置渲染属性,以便使用线框显示立方体,因为默认使用实心立方体。
position = np.array([[position_OBB.x], [position_OBB.y], [position_OBB.z]],
                    np.float)
quat = pclpy.pcl.vectors.Quaternionf()
viewer.addCube(position, quat, max_point_OBB.x - min_point_OBB.x,
               max_point_OBB.y - min_point_OBB.y, max_point_OBB.z - min_point_OBB.z, "OBB")
viewer.setShapeRenderingProperties(5, 1, "OBB")
OBB 的可视化稍微复杂一些。所以在这里我们从旋转矩阵创建一个四元数,设置 OBB 位置并将其传递给可视化器。
这里旋转矩阵转四元数尚未实现。
center = pcl.point_types.PointXYZ()
center.x, center.y, center.z = mass_center[0], mass_center[1], mass_center[2]

x_axis = pcl.point_types.PointXYZ()
x_axis.x, x_axis.y, x_axis.z = major_vector[0] + mass_center[0],\
                               major_vector[1] + mass_center[1],\
                               major_vector[2] + mass_center[2]

y_axis = pcl.point_types.PointXYZ()
y_axis.x, y_axis.y, y_axis.z = middle_vector[0] + mass_center[0],\
                               middle_vector[1] + mass_center[1],\
                               middle_vector[2] + mass_center[2]

z_axis = pcl.point_types.PointXYZ()
z_axis.x, z_axis.y, z_axis.z = minor_vector[0] + mass_center[0], \
                               minor_vector[1] + mass_center[1], \
                               minor_vector[2] + mass_center[2]
viewer.addLine(center, x_axis, 1.0, 0.0, 0.0,  "major eigen vector")
viewer.addLine(center, y_axis, 0.0, 1.0, 0.0, "middle eigen vector")
viewer.addLine(center, z_axis, 0.0, 0.0, 1.0, "minor eigen vector")
特征向量可视化。
3. 运行
运行代码:
进入代码所在文件夹后,输入
python 08_moment_of_inertia.py

只有AABB的结果。
参考:https://pcl.readthedocs.io/projects/tutorials/en/latest/index.html#features