波士顿房价数据链接:https://pan.baidu.com/s/1JPrcNl1AgNCKEHCjOGyHvQ?
提取码:1234
import matplotlib.pyplot as plt
from sklearn.model_selection import train_test_split
from sklearn import metrics  #评价函数库
import pandas as pd
import numpy as np
from sklearn.ensemble import RandomForestRegressor #导入随机森林
from sklearn.model_selection import GridSearchCV  #网格搜索验证
from sklearn import tree
import pydotplus #绘制随机森林
from IPython.display import Image,display #显示图像
%matplotlib inline  #在当前环境中显示图像
df = pd.read_csv("D:/波士顿房价预测/boston_housing_data.csv")
df.dropna(inplace=True) #消除空值
x = df.drop(["MEDV"],axis = 1) #x选取前13个特征
y = df["MEDV"] #y选取房价
x_train,x_test,y_train,y_test = train_test_split(x,y,random_state = 0)#定义网格搜索
param_grid = {
"n_estimators":[5,10,20,100,200], #数值均可预设
"max_depth":[3,5,7],
"max_features":[0.6,0.7,0.8,1]
}
rf = RandomForestRegressor()
grid = GridSearchCV(rf,param_grid=param_grid,cv = 3) #在网格搜索前提下训练,调参助手——找到最优参数
grid.fit(x_train,y_train) #训练grid.best_params_ #查看最好参数![]()
model = grid.best_estimator_  #选中最好的参数作为模型参数
model
plt.figure(figsize=(20,20))

estimator = model.estimators_[9]  #显示第9颗树
data = tree.export_graphviz(
    estimator,
    out_file=None,
    filled=True,
    rounded=True
)
graph = pydotplus.graph_from_dot_data(data)
graph
display(Image(graph.create_png()))
model.feature_importances_ #特征重要度分析,数值越大,影响越大
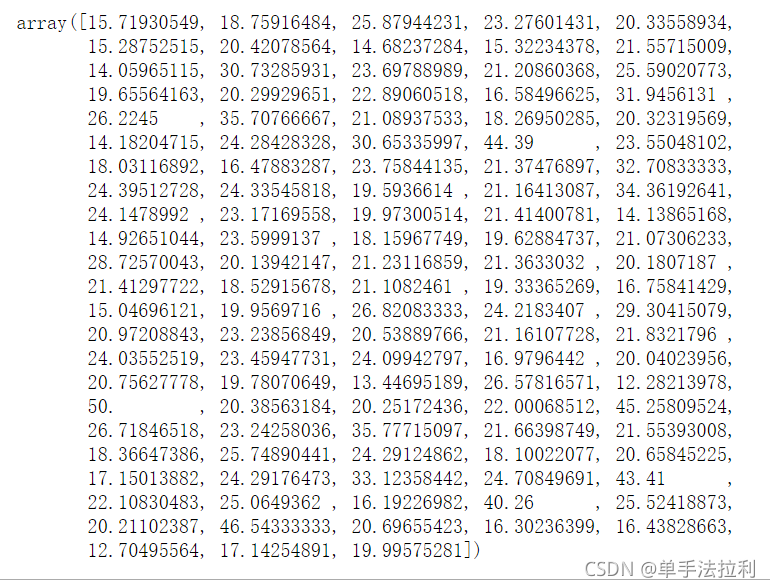
model.predict(x_test) #预测
#计算mse均分误差,开根号得均方根误差
MSE = metrics.mean_squared_error(y_test,model.predict(x_test))
MSE