目标
- 使用各种低通滤波模糊图像
- 将定制的滤波应用于图像(2D卷积)
2D卷积(图像过滤)
与一维信号一样,还可以使用各种低通滤波器(LPF),高通滤波器(HPF)等对图像进行滤波。LPF有助于消除噪声,使图像模糊等。HPF滤波器有助于在图像中找到边缘。
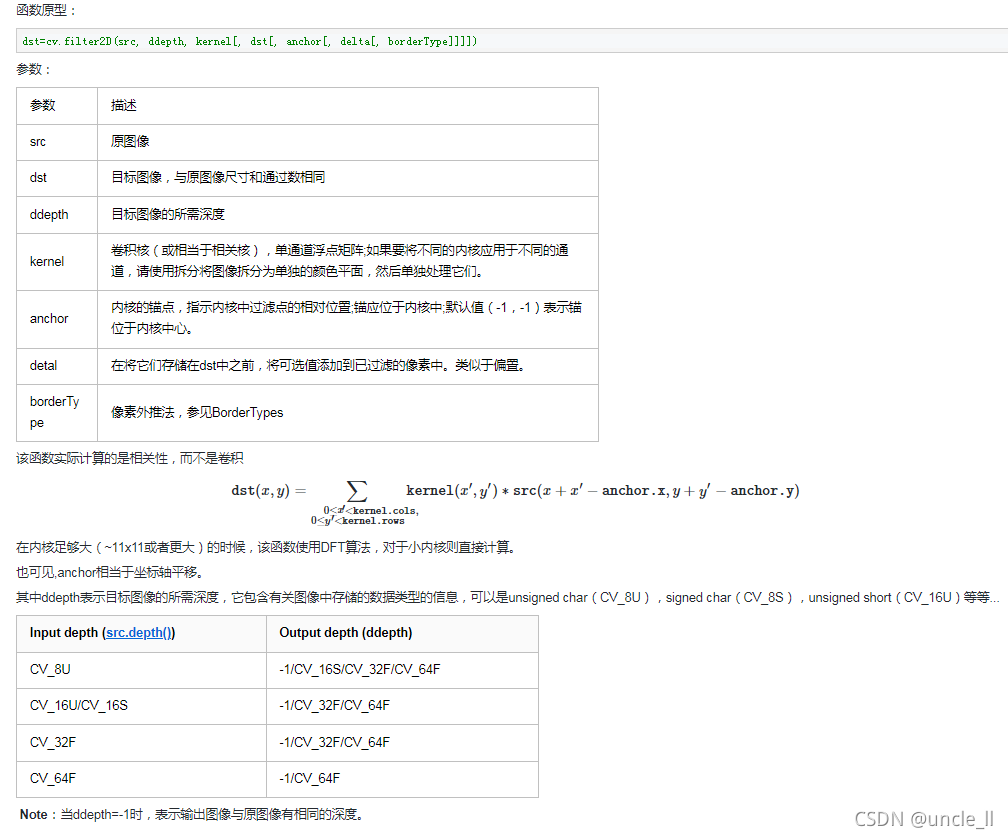
OpenCV提供了一个函数cv2.filter2D来将内核与图像进行卷积。

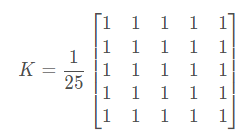
例如,我们将尝试对图像进行平均滤波。5x5平均滤波器内核如下所示:

操作如下:
保持这个内核在一个像素上,将所有低于这个内核的25个像素相加,取其平均值,然后用新的平均值替换中心像素。它将对图像中的所有像素继续此操作。试试这个代码,并检查结果:
import cv2
import numpy as np
from matplotlib import pyplot as plt

img = cv2.imread('origin.png')
kernel = np.ones((5,5), np.float32) / 25
dst = cv2.filter2D(img, -1, kernel)  # 当ddepth=-1时,表示输出图像与原图像有相同的深度
plt.subplot(121)
plt.imshow(img)
plt.title('origin')
plt.xticks([])
plt.yticks([])
plt.subplot(122)
plt.imshow(dst)
plt.title('average')
plt.xticks([])
plt.yticks([])
plt.show()
结果:

图像模糊(图像平滑)
通过将图像与低通滤波器内核进行卷积来实现图像模糊。这对于消除噪音很有用。它实际上从图像中消除了高频部分(例如噪声,边缘)。因此,在此操作中边缘有些模糊。(有一些模糊技术也可以不模糊边缘)。OpenCV主要提供四种类型的模糊技术。
1.平均模糊
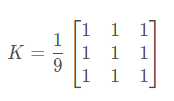
这是通过将图像与归一化框滤镜进行卷积来完成的。它仅获取内核区域下所有像素的平均值,并替换中心元素。这是通过功能cv2blur()或cv2.boxFilter()完成。应该指定内核的宽度和高度。3x3归一化框式过滤器如下所示:

注意
如果不想使用标准化的框式过滤器,请使用cv2.boxFilter()。将参数normalize = False传递给函数。
用法: cv2.blur(src, ksize[, dst[, anchor[, borderType]]])
參數:
src: It is the image whose is to be blurred.
ksize: A tuple representing the blurring kernel size.
dst: It is the output image of the same size and type as src.
anchor: It is a variable of type integer representing anchor point and it’s default value Point is (-1, -1) which means that the anchor is at the kernel center.
borderType: It depicts what kind of border to be added. It is defined by flags like cv2.BORDER_CONSTANT, cv2.BORDER_REFLECT, etc
返回值: It returns an image.
查看下面的示例演示,其内核大小为5x5:
import cv2
import numpy as np

from matplotlib import pyplot as plt

img = cv2.imread('origin.png')
blur = cv2.blur(img, (5, 5))
plt.subplot(121)
plt.imshow(img)
plt.title('origin')
plt.xticks([])
plt.yticks([])
plt.subplot(122)
plt.imshow(blur)
plt.title('blur')
plt.xticks([])
plt.yticks([])
plt.show()
结果:

2.高斯模糊
在这种情况下,代替blur滤波器,使用高斯核。这是通过功能cv2.GaussianBlur() 完成的。应指定内核的宽度和高度,该宽度和高度应为正数和奇数。还应指定X和Y方向的标准偏差,分别为sigmaX和sigmaY。如果仅指定sigmaX,则将sigmaY与sigmaX相同。如果两个都为零,则根据内核大小进行计算。高斯模糊对于从图像中去除高斯噪声非常有效
注意
高斯滤波函数cv2.GaussianBlur()。GaussianBlur的第三个参数sigmaX可以影响模糊效果。
sigmaX小,表现在高斯曲线上就是曲线越高越尖,表现在滤波效果上就是模糊程度小;
sigmaX大,表现在高斯曲线上就是曲线越矮越平缓,表现在滤波效果上就是模糊程度大;
# GaussianBlur
import cv2
import numpy as np

from matplotlib import pyplot as plt

img = cv2.imread('origin.png')
gauss = cv2.GaussianBlur(img, (5, 5), 0)
plt.subplot(121)
plt.imshow(img)
plt.title('origin')
plt.xticks([])
plt.yticks([])
plt.subplot(122)
plt.imshow(gauss)
plt.title('gauss')
plt.xticks([])
plt.yticks([])
plt.show()
结果:

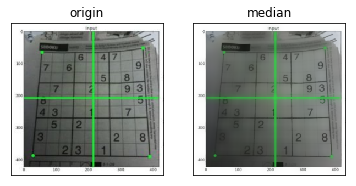
3.中值模糊
在这里,函数cv2.medianBlur()提取内核区域下所有像素的中值,并将中心元素替换为该中值。这对于消除图像中的脉冲噪声和椒盐噪声非常有效。有趣的是,在上述过滤器中**,中心元素是新计算的值,该值可以是图像中的像素值或新值。但是在中值模糊中,中心元素总是被图像中的某些像素值代替**。有效降低噪音。其内核大小应为正奇数整数。
在此演示中,向原始图像添加了50%的噪声并应用了中值模糊。
添加椒盐噪声代码
import cv2
import numpy as np

def noise(img,snr):
    h=img.shape[0]
    w=img.shape[1]
    img1=img.copy()
    sp=h*w   # 计算图像像素点个数
    NP=int(sp*(1-snr))   # 计算图像椒盐噪声点个数
    for i in range (NP):
        randx=np.random.randint(1,h-1)   # 生成一个 1 至 h-1 之间的随机整数
        randy=np.random.randint(1,w-1)   # 生成一个 1 至 w-1 之间的随机整数
        if np.random.random()<=0.5:   # np.random.random()生成一个 0 至 1 之间的浮点数
            img1[randx,randy]=0
        else:
            img1[randx,randy]=255
    return img1

image=cv2.imread("origin.png")
noiseimage=noise(image, 0.9)   # 将信噪比设定为9:1
cv2.imshow("image",image)
cv2.imshow("noiseimage",noiseimage)
cv2.waitKey(0)
cv2.destroyAllWindows()
# 中值模糊
# medianblur
import cv2
import numpy as np

from matplotlib import pyplot as plt

img = cv2.imread('origin-noise.jpg')
gauss = cv2.medianBlur(img, 5)
plt.subplot(121)
plt.imshow(img)
plt.title('origin')
plt.xticks([])
plt.yticks([])
plt.subplot(122)
plt.imshow(gauss)
plt.title('median')
plt.xticks([])
plt.yticks([])
plt.show()
结果:

4.双边滤波
cv2.bilateralFilter()在去除噪声的同时保持边缘清晰锐利非常有效。但是,与其他过滤器相比,该操作速度较慢。我们已经看到,高斯滤波器采用像素周围的邻域并找到其高斯加权平均值。高斯滤波器仅是空间的函数,也就是说,滤波时会考虑附近的像素。它不考虑像素是否具有几乎相同的强度。它不考虑像素是否是边缘像素。因此它也模糊了边缘,这是我们不想做的。
双边滤波器在空间中也采用高斯滤波器,但是又有一个高斯滤波器,它是像素差的函数。空间的高斯函数确保仅考虑附近像素的模糊,而强度差的高斯函数确保仅考虑强度与中心像素相似的那些像素的模糊。由于边缘的像素强度变化较大,因此可以保留边缘。
cv2.bilateralFilter(src, d, sigmaColor, sigmaSpace)
函数有四个参数需要
d是领域的直径
sigmaColor和sigmaSpace是灰度值相似性高斯函数标准差和空间高斯函数标准差。
以下示例显示了使用双边过滤器(有关参数的详细信息,请访问docs)。
# 双边滤波
# 中值模糊
# medianblur
import cv2
import numpy as np

from matplotlib import pyplot as plt

img = cv2.imread('sudo.png')
gauss = cv2.bilateralFilter(img, 20, 75, 75)
plt.subplot(121)
plt.imshow(img)
plt.title('origin')
plt.xticks([])
plt.yticks([])
plt.subplot(122)
plt.imshow(gauss)
plt.title('median')
plt.xticks([])
plt.yticks([])
plt.show()
结果:

看到,数独格子中的纹理基本消失了,但是边缘仍然保留。