LSTM使用基础
原理请自行学习
torch.nn.LSTMCell
torch.nn.LSTM
要了解 LSTM 如何工作,先了解 LSTMCell 如何工作
import numpy as np

import torch
import torch.nn as nn
batch = 32
seq_l = 100   # 序列长度
input_size = 10

# 创建一个数据
x = torch.randn(seq_l, batch, input_size)

hidden_size = 20
nn.LSTMCell
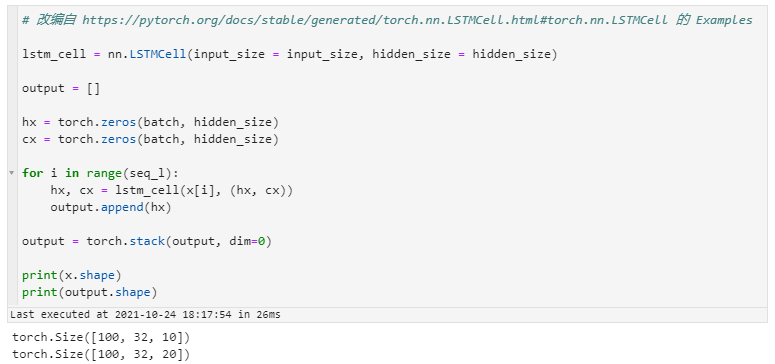
# 改编自 https://pytorch.org/docs/stable/generated/torch.nn.LSTMCell.html#torch.nn.LSTMCell 的 Examples

lstm_cell = nn.LSTMCell(input_size = input_size, hidden_size = hidden_size)

output = []

hx = torch.zeros(batch, hidden_size)
cx = torch.zeros(batch, hidden_size)

for i in range(seq_l):
    hx, cx = lstm_cell(x[i], (hx, cx))
    output.append(hx)

output = torch.stack(output, dim=0)

print(x.shape)
print(output.shape)

nn.LSTM
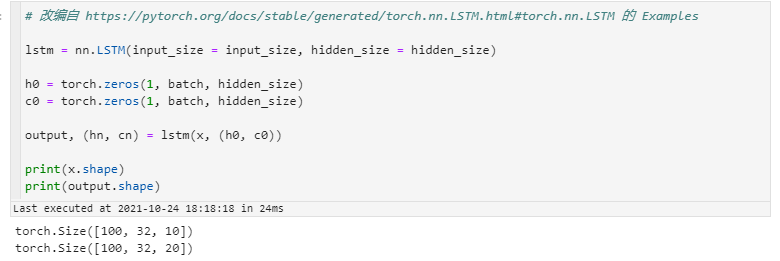
# 改编自 https://pytorch.org/docs/stable/generated/torch.nn.LSTM.html#torch.nn.LSTM 的 Examples

lstm = nn.LSTM(input_size = input_size, hidden_size = hidden_size)

h0 = torch.zeros(1, batch, hidden_size)
c0 = torch.zeros(1, batch, hidden_size)

output, (hn, cn) = lstm(x, (h0, c0))

print(x.shape)
print(output.shape)

关系
上面两段代码作用是一样的。一个是单元,一个是整体,前者使用更灵活,后者使用更方便。
从 LSTMCell 那段代码可以看出,output 本质上就是序列中每一步对应的隐藏层输出,看看LSTM是不是也是这样。
print(output.shape, hn.shape)
torch.all(output[-1] == hn[-1])

对吧
实战1 单步预测
数据总量:500
shape: (500, 2)
特征:第一列是 sin(x) , 第二列是cos(x)
目标:通过这些数据(0 ~ 500),预测第 500 ~ 1000 步的数据。
from tqdm import trange

import matplotlib.pyplot as plt
import numpy as np

import torch
import torch.nn as nn

plt.rcParams['font.sans-serif'] = ['SimHei']
plt.rcParams['axes.unicode_minus'] = False
np.set_printoptions(suppress=True)
class Data_Manager:
    def __init__(self):
        self.size = 500

        self.x = np.linspace(0, self.size, num=self.size)

        # shape: (self.size, 2)
        self.X = np.vstack([
            np.sin(self.x / 2 / np.pi),
            np.cos(self.x / 2 / np.pi)
        ]).T

        plt.figure(figsize=(35, 7))
        plt.plot(self.x, self.X[:, 0], color='r')
        plt.plot(self.x, self.X[:, 1], color='b')
dm = Data_Manager()

class Model(nn.Module):
    def __init__(self):
        super().__init__()

        self.input_size = 2
        self.output_size = 2
        self.hidden_size = 64

        self.lstm = nn.LSTM(
            input_size = self.input_size,
            hidden_size = self.hidden_size
        )

        self.l = nn.Sequential(
            nn.Linear(self.hidden_size, self.hidden_size),
            nn.Linear(self.hidden_size, self.hidden_size),
            nn.Linear(self.hidden_size, self.output_size)
        )

    def forward(self, x):

        # N = batch_size, L = sequence length 即序列长度

        x = x.permute(1, 0, 2)             # (N, L, 2) -> (L, N, 2)
        output, (hn, cn) = self.lstm(x)    # (L, N, 2) -> (L, N, hidden_size), ((1, N, hidden_size), (1, N, hidden_size))
        x = hn[-1]                         # (1, N, hidden_size) -> (N, hidden_size)
        x = self.l(x)                     # (N, hidden_size) -> (N, output_size)
        return x
model = Model()
optimizer = torch.optim.Adam(model.parameters())
Len_t = 5    # 用长度为 5 的序列
Len_p = 1    # 单步预测
Len = Len_t + Len_p
epochs = 10000
e = len(str(epochs))

pbar = trange(epochs)
for epoch in pbar:

    i = np.random.randint(0, dm.size - Len)    # 随机挑选数据进行训练
    datas = dm.X[i:i+Len]

    # datas 的 shape: (6, 2)

    x = torch.tensor(datas[:Len_t], dtype=torch.float32).unsqueeze(0)    # 训练数据 shape: (1, 5, 2)
    y = torch.tensor(datas[Len_t:], dtype=torch.float32)                 # 答案数据(也可以理解为标签) shape: (1, 2)

    y_pred = model(x)    # shape: (1, 2)
    y_true = y           # shape: (1, 2)

    loss = nn.MSELoss()(y_pred, y_true).mean()

    optimizer.zero_grad()
    loss.backward()
    optimizer.step()

    pbar.set_description(f'[Epoch: {epoch+1:>{e}}/{epochs:>{e}}] [loss {loss.item():.3f}]')
- 用最后 Len_t 行数据 x, 预测下一步的数据 y
- 把 y 加入到 x 的最后一行,然后去掉 x 最前面一行
- 用 x 预测下一步的数据 y
- 重复步骤 2 和 步骤 3 直到结束
X_pred = np.array([])

for i in range(0, 500):

    if i == 0:
        x = torch.tensor(dm.X[-Len_t:], dtype=torch.float32).unsqueeze(0)
    else:
        x = torch.tensor(x_new, dtype=torch.float32).unsqueeze(0)

    # 预测下一步
    y = model(x).detach().cpu().numpy()

    # 保存
    if X_pred.shape[0] == 0:
        X_pred = y
    else:
        X_pred = np.vstack([X_pred, y])

    # shape: (5, 2) -> 合并预测数据 (6, 2) -> 删掉最前面的数据 (5, 2)
    x_new = np.vstack([x.detach().cpu().numpy()[0], y])[1:]

fig, ax = plt.subplots(figsize=(70, 7))

ax.plot(dm.x, dm.X[:, 0], color='red')
ax.plot(dm.x, dm.X[:, 1], color='blue')

ax.plot(np.arange(dm.size, dm.size + X_pred.shape[0]), X_pred[:, 0], color='darkred')
ax.plot(np.arange(dm.size, dm.size + X_pred.shape[0]), X_pred[:, 1], color='darkblue')
plt.show()

前面半段是原始数据,后面半段是预测数据(颜色较暗)。
实战2 多步预测
注:这个代码本质上还是单步预测,只不过是由多个单步预测组成的多步预测而已
from tqdm import trange

import matplotlib.pyplot as plt
import numpy as np

import torch
import torch.nn as nn

plt.rcParams['font.sans-serif'] = ['SimHei']
plt.rcParams['axes.unicode_minus'] = False
np.set_printoptions(suppress=True)
class Data_Manager:
    def __init__(self):
        self.size = 500

        self.x = np.linspace(0, self.size, num=self.size)

        # shape: (self.size, 2)
        self.X = np.vstack([
            np.sin(self.x / 2 / np.pi),
            np.cos(self.x / 2 / np.pi)
        ]).T

        plt.figure(figsize=(35, 7))
        plt.plot(self.x, self.X[:, 0], color='r')
        plt.plot(self.x, self.X[:, 1], color='b')
dm = Data_Manager()
class Model(nn.Module):
    def __init__(self, output_len):
        super().__init__()

        self.input_size = 2
        self.output_size = 2
        self.hidden_size = 64
        self.output_len = output_len

        self.lstm_cell = nn.LSTMCell(
            input_size = self.input_size,
            hidden_size = self.hidden_size
        )

        self.l = nn.Sequential(
            nn.Linear(self.hidden_size, self.hidden_size),
            nn.Linear(self.hidden_size, self.hidden_size),
            nn.Linear(self.hidden_size, self.output_size)
        )

    def forward(self, x):

        # N = batch_size, L = sequence length 即序列长度

        x = x.permute(1, 0, 2)             # (N, L, 2) -> (L, N, 2)

        h0 = torch.zeros(x.size(1), self.hidden_size)
        c0 = torch.zeros(x.size(1), self.hidden_size)

        output = []
        for i in range(x.size(0) + self.output_len):
            if i < x.size(0):
                hx, cx = self.lstm_cell(x[i], (h0 if i ==0 else hx, c0 if i ==0 else cx))
            else:
                hx, cx = self.lstm_cell(output[i-1], (hx, cx))
            output.append(self.l(hx))

        x = torch.stack(output[5:], dim=0)    # shape: (L+output_len, N, 2) -> (output_len, N, 2)
        x = x.permute(1, 0, 2)    # shape: (output_len, N, 2) -> (N, output_len, 2)
        return x
Len_t = 5    # 用长度为 5 的序列
Len_p = 5    # 多步预测
Len = Len_t + Len_p
model = Model(Len_p)
optimizer = torch.optim.Adam(model.parameters())
epochs = 10000
e = len(str(epochs))

pbar = trange(epochs)
for epoch in pbar:

    i = np.random.randint(0, dm.size - Len)    # 随机挑选数据进行训练
    datas = dm.X[i:i+Len]

    # datas 的 shape: (6, 2)

    x = torch.tensor(datas[:Len_t], dtype=torch.float32).unsqueeze(0)    # 训练数据 shape: (1, 5, 2)
    y = torch.tensor(datas[Len_t:], dtype=torch.float32).unsqueeze(0)    # 答案数据(也可以理解为标签) shape: (1, 5, 2)

    y_pred = model(x)    # shape: (1, 5, 2)
    y_true = y           # shape: (1, 5, 2)

    loss = nn.MSELoss()(y_pred, y_true).mean()

    optimizer.zero_grad()
    loss.backward()
    optimizer.step()

    pbar.set_description(f'[Epoch: {epoch+1:>{e}}/{epochs:>{e}}] [loss {loss.item():.3f}]')
X_pred = np.array([])

for i in range(0, 500 // Len_p):

    if i == 0:
        x = torch.tensor(dm.X[-Len_t:], dtype=torch.float32).unsqueeze(0)
    else:
        x = torch.tensor(x_new, dtype=torch.float32).unsqueeze(0)

    # 预测下一步
    y = model(x).detach().cpu().numpy()[0]

    # 保存
    if X_pred.shape[0] == 0:
        X_pred = y
    else:
        X_pred = np.vstack([X_pred, y])

    # shape: (5, 2) -> 合并预测数据 (10, 2) -> 删掉最前面的数据 (5, 2)
    x_new = np.vstack([x.detach().cpu().numpy()[0], y])[Len_t:]

fig, ax = plt.subplots(figsize=(70, 7))

ax.plot(dm.x, dm.X[:, 0], color='red')
ax.plot(dm.x, dm.X[:, 1], color='blue')

ax.plot(np.arange(dm.size, dm.size + X_pred.shape[0]), X_pred[:, 0], color='darkred')
ax.plot(np.arange(dm.size, dm.size + X_pred.shape[0]), X_pred[:, 1], color='darkblue')
plt.show()

前面半段是原始数据,后面半段是预测数据(颜色较暗)。