一、SVM算法
1.1、向量机简述
简介: 支持向量机(support vector machine, SVM):是监督学习中最有影响力的方法之一。类似于逻辑回归,这个模型也是基于线性函数wTx+b的。不同于逻辑回归的是,支持向量机不输出概率,只输出类别。当wTx+b为正时,支持向量机预测属于正类。类似地,当wTx+b为负时,支持向量机预测属于负类。
工作原理:将数据映射到高维特征空间,这样即使数据不是线性可分,也可以对该数据点进行分类。
作用:进行线性分类之外,SVM还可以使用所谓的核技巧有效地进行非线性分类,将其输入隐式映射到高维特征空间中。
SVM对偶形式的求解公式为

1.2、核函数简述
核函数原理:将原始非线性的样本通过非线性映射映射至高维特征空间,使得在新的空间里样本线性可分,进而可用线性样本的分类理论解决此类问题。
核函数:包括齐次多项式、非齐次多项式、双曲正切、高斯核(Gaussiankernel)、线性核、径向基函数(radialbasis function, RBF)核和、Sigmoid核
2.1、鸢尾花数据集
import numpy as np
from sklearn import datasets   #导入数据集
import matplotlib.pyplot as plt
from sklearn.preprocessing import StandardScaler
from matplotlib.colors import ListedColormap
import numpy as np
from sklearn import datasets   #导入数据集
import matplotlib.pyplot as plt
from sklearn.preprocessing import StandardScaler
from matplotlib.colors import ListedColormap
def plot_decision_boundary(model,axis):
    x0,x1=np.meshgrid(
        np.linspace(axis[0],axis[1],int((axis[1]-axis[0])*100)).reshape(-1,1),
        np.linspace(axis[2],axis[3],int((axis[3]-axis[2])*100)).reshape(-1,1))
    # meshgrid函数是从坐标向量中返回坐标矩阵
    x_new=np.c_[x0.ravel(),x1.ravel()]
    y_predict=model.predict(x_new)#获取预测值
    zz=y_predict.reshape(x0.shape)
    custom_cmap=ListedColormap(['#EF9A9A','#FFF59D'])
    plt.contourf(x0,x1,zz,cmap=custom_cmap)
iris = datasets.load_iris()
data_x = iris.data[:, :2]
data_y = iris.target
scaler=StandardScaler()# 标准化
data_x = scaler.fit_transform(data_x)#计算训练数据的均值和方差
plt.rcParams["font.sans-serif"] = ['SimHei']    # 用来正常显示中文标签,SimHei是字体名称,字体必须在系统中存在,字体的查看方式和安装第三部分
plt.rcParams['axes.unicode_minus'] = False     # 用来正常显示负号
plt.scatter(data_x[data_y==0, 0],data_x[data_y==0, 1])    # 选取y所有为0的+X的第一列
plt.scatter(data_x[data_y==1, 0],data_x[data_y==1, 1])    # 选取y所有为1的+X的第一列

plt.xlabel('sepal length')    # 设置横坐标标注xlabel为sepal width
plt.ylabel('sepal width')    # 设置纵坐标标注ylabel为sepal length
plt.title('sepal散点图')    # 设置散点图的标题为sepal散点图
plt.show()

2.2、多项式分类函数
from sklearn.preprocessing import PolynomialFeatures #导入多项式回归
from sklearn.pipeline import Pipeline #导入python里的管道
from sklearn.svm import LinearSVC
def PolynomialSVC(degree,c=5):#多项式svm
    """
    :param d:阶数
    :param C:正则化常数
    :return:一个Pipeline实例
    """
    return Pipeline([
            # 将源数据 映射到 3阶多项式
            ("poly_features", PolynomialFeatures(degree=degree)),
            # 标准化
            ("scaler", StandardScaler()),
            # SVC线性分类器
            ("svm_clf", LinearSVC(C=c, loss="hinge", random_state=10,max_iter=100000))
        ])

poly_svc=PolynomialSVC(degree=5)
poly_svc.fit(data_x,data_y)
plot_decision_boundary(poly_svc,axis=[-3,4,-4,5])
plt.scatter(data_x[data_y==0,0],data_x[data_y==0,1])
plt.scatter(data_x[data_y==2,0],data_x[data_y==2,1])
plt.show()

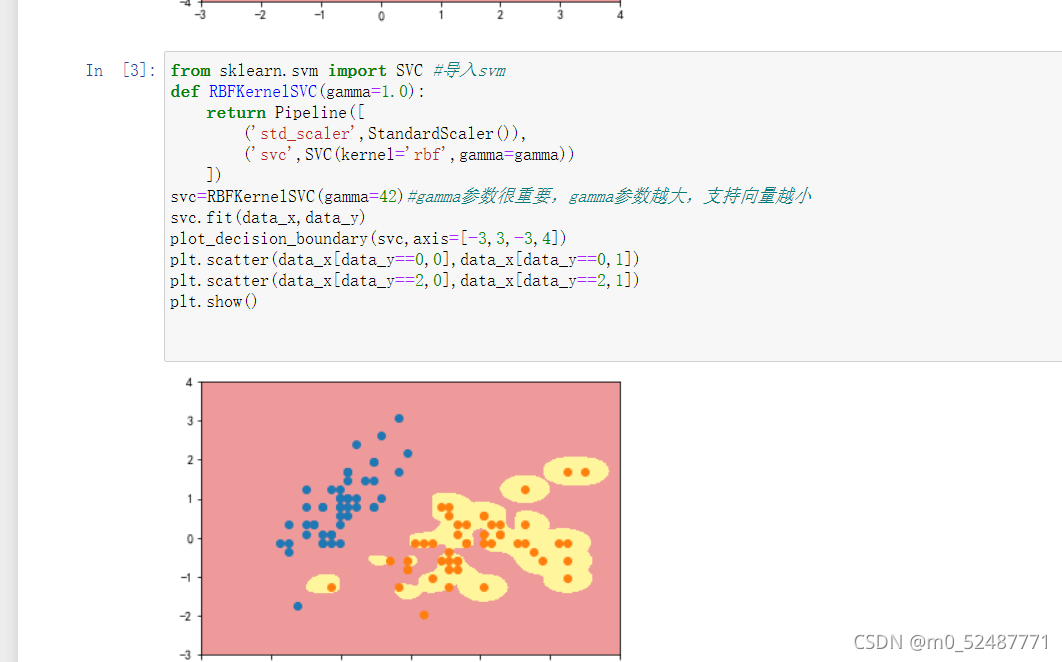
2.3、高斯核方式
from sklearn.svm import SVC #导入svm
def RBFKernelSVC(gamma=1.0):
    return Pipeline([
        ('std_scaler',StandardScaler()),
        ('svc',SVC(kernel='rbf',gamma=gamma))
    ])
svc=RBFKernelSVC(gamma=42)#gamma参数很重要,gamma参数越大,支持向量越小
svc.fit(data_x,data_y)
plot_decision_boundary(svc,axis=[-3,3,-3,4])
plt.scatter(data_x[data_y==0,0],data_x[data_y==0,1])
plt.scatter(data_x[data_y==2,0],data_x[data_y==2,1])
plt.show()

3.1、月亮数据集做多项式分类函数
import numpy as np
import matplotlib.pyplot as plt
from sklearn import datasets
from sklearn.preprocessing import PolynomialFeatures,StandardScaler
from sklearn.svm import LinearSVC
from sklearn.pipeline import Pipeline
from sklearn.svm import SVC
X, y = datasets.make_moons() #使用生成的数据
#print(X.shape) # (100,2)
#print(y.shape) # (100,)
plt.scatter(X[y==0,0],X[y==0,1])
plt.scatter(X[y==1,0],X[y==1,1])
plt.show()

3.2、生成噪声点
X, y = datasets.make_moons(noise=0.15,random_state=777) #随机生成噪声点,random_state是随机种子,noise是方差
plt.scatter(X[y==0,0],X[y==0,1])
plt.scatter(X[y==1,0],X[y==1,1])
plt.show()

3.3、定义非线性SVM函数
def PolynomialSVC(degree,C=1.0):
    return Pipeline([
        ("poly",PolynomialFeatures(degree=degree)),#生成多项式
        ("std_scaler",StandardScaler()),#标准化
        ("linearSVC",LinearSVC(C=C))#最后生成svm
    ])
3.4调用PolynomialSVC函数进行分类可视化
调用非线性SVM分类,实例化SVC
# 边界绘制函数
def plot_decision_boundary(model,axis):
    x0,x1=np.meshgrid(
        np.linspace(axis[0],axis[1],int((axis[1]-axis[0])*100)).reshape(-1,1),
        np.linspace(axis[2],axis[3],int((axis[3]-axis[2])*100)).reshape(-1,1))
    # meshgrid函数是从坐标向量中返回坐标矩阵
    x_new=np.c_[x0.ravel(),x1.ravel()]
    y_predict=model.predict(x_new)#获取预测值
    zz=y_predict.reshape(x0.shape)
    custom_cmap=ListedColormap(['#EF9A9A','#FFF59D','#90CAF9'])
    plt.contourf(x0,x1,zz,cmap=custom_cmap)
poly_svc = PolynomialSVC(degree=5)
poly_svc.fit(X,y)
plot_decision_boundary(poly_svc,axis=[-1.5,2.5,-1.0,1.5])
plt.scatter(X[y==0,0],X[y==0,1])
plt.scatter(X[y==1,0],X[y==1,1])
plt.show()

3.5、进行核处理
def PolynomialKernelSVC(degree,C=1.0):
    return Pipeline([
        ("std_scaler",StandardScaler()),
        ("kernelSVC",SVC(kernel="poly")) # poly代表多项式特征
    ])
poly_kernel_svc = PolynomialKernelSVC(degree=5)
poly_kernel_svc.fit(X,y)
plot_decision_boundary(poly_kernel_svc,axis=[-1.5,2.5,-1.0,1.5])
plt.scatter(X[y==0,0],X[y==0,1])
plt.scatter(X[y==1,0],X[y==1,1])
plt.show()

4.1高斯核方式
import numpy as np
import matplotlib.pyplot as plt
from sklearn import datasets
from sklearn.preprocessing import StandardScaler
from sklearn.svm import SVC
from sklearn.pipeline import Pipeline
X,y = datasets.make_moons(noise=0.15,random_state=777)
plt.scatter(X[y==0,0],X[y==0,1])
plt.scatter(X[y==1,0],X[y==1,1])
plt.show()

4.2定义RBF核的SVM函数
from sklearn.preprocessing import StandardScaler
from sklearn.svm import SVC
from sklearn.pipeline import Pipeline
def RBFKernelSVC(gamma=0.1):
    return Pipeline([ ('std_scaler',StandardScaler()), ('svc',SVC(kernel='rbf',gamma=gamma)) ])
svc = RBFKernelSVC()
svc.fit(X,y)
plot_decision_boundary(svc,axis=[-1.5,2.5,-1.0,1.5])
plt.scatter(X[y==0,0],X[y==0,1])
plt.scatter(X[y==1,0],X[y==1,1])
plt.show()

二、安装dlib、opencv3.4
先在cmd里输入Python -V检查自己的python版本,我这里是3.9,下载好3.9版本的dlib,
打开cmd,输入 pip install dlib-19.22.99-cp38-cp38-win_amd64.whl安装好dlib,接着输入pip3 install opencv_python安装好opencv
三、人脸采集
新开一个cmd,输入jupyter notebook,将预先下载好的shape文件上传,输入代码
# -*- coding: utf-8 -*-
"""
Created on Wed Oct 27 03:15:10 2021

@author: GT72VR
"""
import numpy as np
import cv2
import dlib
import os
import sys
import random
# 存储位置
output_dir = 'C:/Users/86199/tvcamera'
size = 64

if not os.path.exists(output_dir):
    os.makedirs(output_dir)
# 改变图片的亮度与对比度

def relight(img, light=1, bias=0):
    w = img.shape[1]
    h = img.shape[0]
    #image = []
    for i in range(0,w):
        for j in range(0,h):
            for c in range(3):
                tmp = int(img[j,i,c]*light + bias)
                if tmp > 255:
                    tmp = 255
                elif tmp < 0:
                    tmp = 0
                img[j,i,c] = tmp
    return img

#使用dlib自带的frontal_face_detector作为我们的特征提取器
detector = dlib.get_frontal_face_detector()
# 打开摄像头 参数为输入流,可以为摄像头或视频文件
camera = cv2.VideoCapture(0)
#camera = cv2.VideoCapture('C:/Users/CUNGU/Videos/Captures/wang.mp4')
ok = True

detector = dlib.get_frontal_face_detector()
predictor = dlib.shape_predictor('shape_predictor_68_face_landmarks.dat')


while ok:
    # 读取摄像头中的图像,ok为是否读取成功的判断参数
    ok, img = camera.read()

    # 转换成灰度图像
    img_gray = cv2.cvtColor(img, cv2.COLOR_BGR2GRAY)

    rects = detector(img_gray, 0)

    for i in range(len(rects)):
        landmarks = np.matrix([[p.x, p.y] for p in predictor(img,rects[i]).parts()])
        for idx, point in enumerate(landmarks):
            # 68点的坐标
            pos = (point[0, 0], point[0, 1])
            print(idx,pos)

            # 利用cv2.circle给每个特征点画一个圈,共68个
            cv2.circle(img, pos, 2, color=(0, 255, 0))
            # 利用cv2.putText输出1-68
            font = cv2.FONT_HERSHEY_SIMPLEX
            cv2.putText(img, str(idx+1), pos, font, 0.2, (0, 0, 255), 1,cv2.LINE_AA)
    cv2.imshow('video', img)
    k = cv2.waitKey(1)
    if k == 27:    # press 'ESC' to quit
        break

camera.release()
cv2.destroyAllWindows()

人脸,以及68个特征点采集完毕了
接着输入代码
# 导入包
import numpy as np
import cv2
import dlib
import os
import sys
import random
def get_detector_and_predicyor():
    #使用dlib自带的frontal_face_detector作为我们的特征提取器
    detector = dlib.get_frontal_face_detector()
    """
    功能:人脸检测画框
    参数:PythonFunction和in Classes
    in classes表示采样次数,次数越多获取的人脸的次数越多,但更容易框错
    返回值是矩形的坐标,每个矩形为一个人脸(默认的人脸检测器)
    """
    #返回训练好的人脸68特征点检测器
    predictor = dlib.shape_predictor('shape_predictor_68_face_landmarks.dat')
    return detector,predictor
#获取检测器
detector,predictor=get_detector_and_predicyor()
def painting_sunglasses(img,detector,predictor):
    #给人脸带上墨镜
    rects = detector(img_gray, 0)
    for i in range(len(rects)):
        landmarks = np.matrix([[p.x, p.y] for p in predictor(img,rects[i]).parts()])
        right_eye_x=0
        right_eye_y=0
        left_eye_x=0
        left_eye_y=0
        for i in range(36,42):#右眼范围
            #将坐标相加
            right_eye_x+=landmarks[i][0,0]
            right_eye_y+=landmarks[i][0,1]
        #取眼睛的中点坐标
        pos_right=(int(right_eye_x/6),int(right_eye_y/6))
        """
        利用circle函数画圆
        函数原型
        cv2.circle(img, center, radius, color[, thickness[, lineType[, shift]]])
        img:输入的图片data
        center:圆心位置
        radius:圆的半径
        color:圆的颜色
        thickness:圆形轮廓的粗细(如果为正)。负厚度表示要绘制实心圆。
        lineType: 圆边界的类型。
        shift:中心坐标和半径值中的小数位数。
        """
        cv2.circle(img=img, center=pos_right, radius=30, color=(0,0,0),thickness=-1)
        for i in range(42,48):#左眼范围
           #将坐标相加
            left_eye_x+=landmarks[i][0,0]
            left_eye_y+=landmarks[i][0,1]
        #取眼睛的中点坐标
        pos_left=(int(left_eye_x/6),int(left_eye_y/6))
        cv2.circle(img=img, center=pos_left, radius=30, color=(0,0,0),thickness=-1)
camera = cv2.VideoCapture(0)#打开摄像头
ok=True
# 打开摄像头 参数为输入流,可以为摄像头或视频文件
while ok:
    ok,img = camera.read()
     # 转换成灰度图像
    img_gray = cv2.cvtColor(img,cv2.COLOR_BGR2GRAY)
    #display_feature_point(img,detector,predictor)
    painting_sunglasses(img,detector,predictor)#调用画墨镜函数
    cv2.imshow('video', img)
    k = cv2.waitKey(1)
    if k == 27:    # press 'ESC' to quit
        break
camera.release()
cv2.destroyAllWindows()

这样就能为眼镜加上黑色圆特效了