Contents
2 Function_convert_seg_to_boundaries
5 Function_compare_segmentations
1 Function_segment_image
% @ Name: segment_image (I)
% @ Author: Chengzhi Zhang
% @ Time: 2021/11/04
% @ Function: Edge Detection
% @ Version: Matlab R2021b

function [seg] = segment_image (I)

% STEP 1 detect the image and convert the original image to grayscale image
[x y z] = size (I)
if z > 1
    I = rgb2gray (I);
end

% STEP 2 convert image to double precision
I = im2double (I);

% STEP 3 erodes the grayscale image I using the function imerode
% and use the original image minus eroded image
I1 = imerode (I, strel ('square', 3));
I2 = I - I1;

% STEP4 using Prewitt operator to detect the edge of image
% the average score of 12 test images can reach 0.67
seg = edge (I2, 'prewitt');
imagesc (seg);

end
2 Function_convert_seg_to_boundaries
function b=convert_seg_to_boundaries(seg)
%Performs conversion from an array containing region labels (seg)
%to one containing the boundaries between the regions (b)

seg=padarray(seg,[1,1],'post','replicate');

b=abs(conv2(seg,[-1,1],'same'))+abs(conv2(seg,[-1;1],'same'))+abs(conv2(seg,[-1,0;0,1],'same'))+abs(conv2(seg,[0,-1;1,0],'same'));

b=im2bw(b(1:end-1,1:end-1),0);
3 Function_evaluate
function [f1score,TP,FP,FN]=evaluate(boundariesPred,boundariesHuman)
%Returns the f1score quantifying the quality of the match between predicted
%and human image segmentations.
%
%Note both inputs are assumed to show the boundaries between image regions.

r=3; %set tolerance for boundary matching
neighbourhood=strel('disk',r,0);

%make dilated and thinned versions of boundaries
boundariesPredThin = boundariesPred.*bwmorph(boundariesPred,'thin',inf);
boundariesHumanThin = prod(imdilate(boundariesHuman,neighbourhood),3);
boundariesHumanThin = boundariesHumanThin.*bwmorph(boundariesHumanThin,'thin',inf);
boundariesPredThick = imdilate(boundariesPred,neighbourhood);
boundariesHumanThick = max(imdilate(boundariesHuman,neighbourhood),[],3);

%Calculate statistics
%true positives: pixels from predicted boundary that match pixels from any human boundary
%(human boundaries dilated to allow tolerance to match location)
TP=boundariesPredThin.*boundariesHumanThick;
%false positives: pixels that are predicted but do not match any human boundary
FP=max(0,boundariesPred-boundariesHumanThick);
%false negatives: human boundary pixels that do not match predicted boundary
%(predicted boundaries dilated to allow tolerance to match location)
FN=max(0,boundariesHumanThin-boundariesPredThick);

numTP=sum(TP(:));
numFP=sum(FP(:));
numFN=sum(FN(:));

f1score=2*numTP/(2*numTP+numFP+numFN);
4 Function_show_results
function show_results(boundariesPred,boundariesHuman,f1score,TP,FP,FN)
%Function used to show comparison between predicted and human image segmentations.

maxsubplot(2,2,3); imagescc(boundariesPred); title('Predicted Boundaries')
[a,b]=size(boundariesPred);
if a>b
    ylabel(['f1score=',num2str(f1score,2)]);
else
    xlabel(['f1score=',num2str(f1score,2)]);
end
maxsubplot(2,2,4); imagescc(mean(boundariesHuman,3)); title('Human Boundaries')

maxsubplot(2,3,1); imagescc(TP); title('True Positives')
maxsubplot(2,3,2); imagescc(FP); title('False Positives')
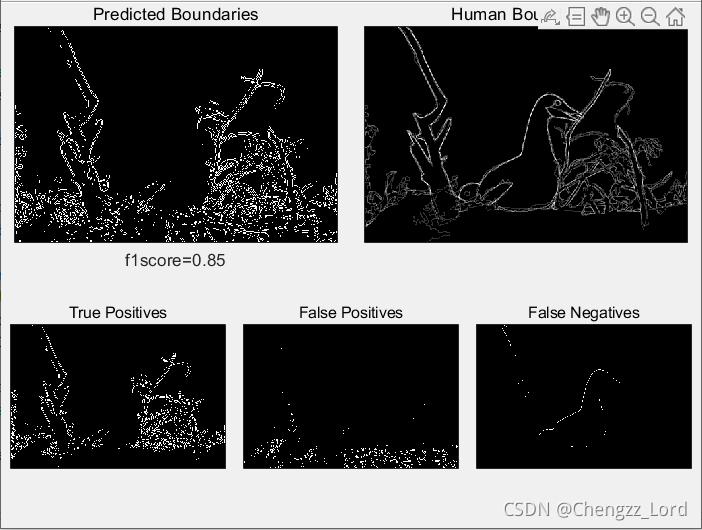
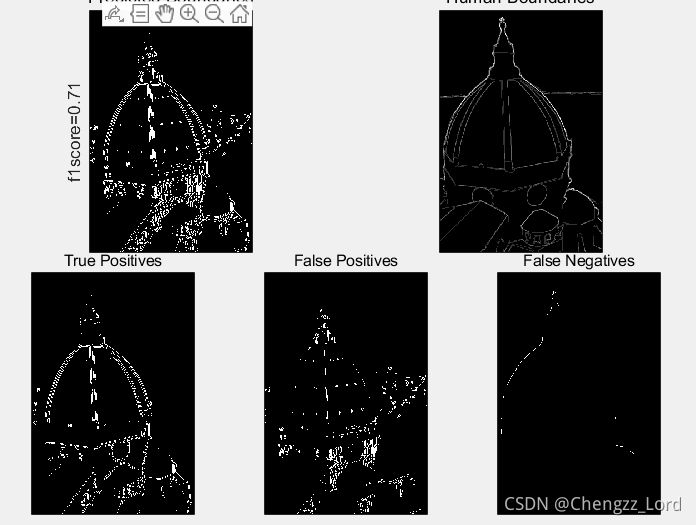
maxsubplot(2,3,3); imagescc(FN); title('False Negatives')
colormap('gray');
drawnow;


%%
function imagescc(I)
%Combines imagesc with some other commands to improve appearance of images
imagesc(I,[0,1]);
axis('equal','tight');
set(gca,'XTick',[],'YTick',[]);


function position=maxsubplot(rows,cols,ind,fac)
%Create subplots that are larger than those produced by the standard subplot command.
%Good for plots with no axis labels, tick labels or titles.
%*NOTE*, unlike subplot new axes are drawn on top of old ones; use clf first
%if you don't want this to happen.
%*NOTE*, unlike subplot the first axes are drawn at the bottom-left of the
%window.

if nargin<4, fac=0.075; end
position=[(fac/2)/cols+rem(min(ind)-1,cols)/cols,...
          (fac/2)/rows+fix((min(ind)-1)/cols)/rows,...
          (length(ind)-fac)/cols,(1-fac)/rows];
axes('Position',position);
5 Function_compare_segmentations
function compare_segmentations(imNum)
%Compares a predicted image segmentation to human segmentations of the same image.
%The number of the image used is defined by the input parameter "imNum".
%
%Note, this function assumes that images and their corresponding human segmentations
%are stored in a sub-directory "Images" of the current working directory. If they are
%stored elsewhere, change the following to point to the correct location:
ImDir='Images/';

%load image
imFile=[ImDir,'im',int2str(imNum),'.jpg'];
I=im2double(imread(imFile));

%segment image
segPred=segment_image(I); %<<<<<< calls your method for image segmentation

%convert segmentation to a boundary map, if necessary
segPred=round(segPred);
inseg=unique(segPred(:));
if min(inseg)==0 & max(inseg)==1
    %result is a boundary map
    boundariesPred=double(segPred);
else
    %result is a segmentation map
    boundariesPred=double(convert_seg_to_boundaries(segPred)); %convert segmentation map to boundary map
end

%load human segmentations
humanFiles=[ImDir,'im',int2str(imNum),'seg*.png'];
numFiles=length(dir(humanFiles));
for i=1:numFiles
    humanFile=['Images/im',int2str(imNum),'seg',int2str(i),'.png'];
    boundariesHuman(:,:,i)=im2double(imread(humanFile));
end

%evaluate and display results
[f1score,TP,FP,FN]=evaluate(boundariesPred,boundariesHuman);
figure(1), clf
show_results(boundariesPred,boundariesHuman,f1score,TP,FP,FN);
Result


