公众号:尤而小屋
作者:Peter
编辑:Peter
大家好,我是Peter~
本文中主要介绍的是如何来美化Pandas的DataFrame的数据。主要是通过Pandas中的两个方法来实现:
- Styler.applymap:逐个元素,返回带有CSS属性-值对的单个字符串
- Styler.apply:列、表、行的方式,返回具有相同形状的Series或者DataFrame,其中每个值都是带有CSS属性值对的字符串。该方法在作用的时候,通过参数axis来传递,axis=0表示按列作用,axis=1表示按行作用。
官网学习地址:
- https://pandas.pydata.org/pandas-docs/version/1.1.5/user_guide/style.html#Export-to-Excel
- https://pandas.pydata.org/pandas-docs/stable/user_guide/style.html

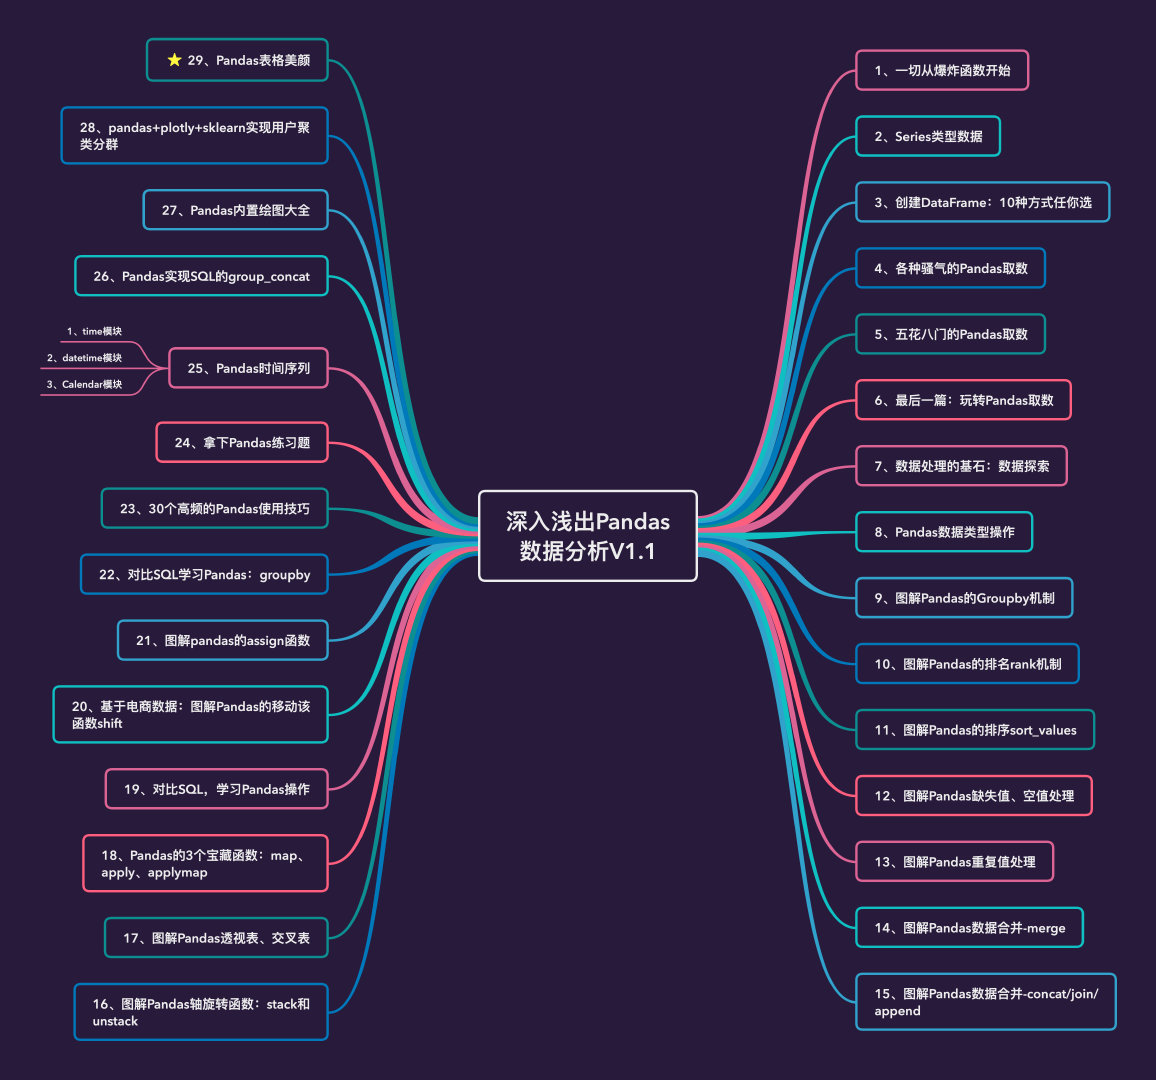
Pandas连载
Pandas的文章一直在连载中:
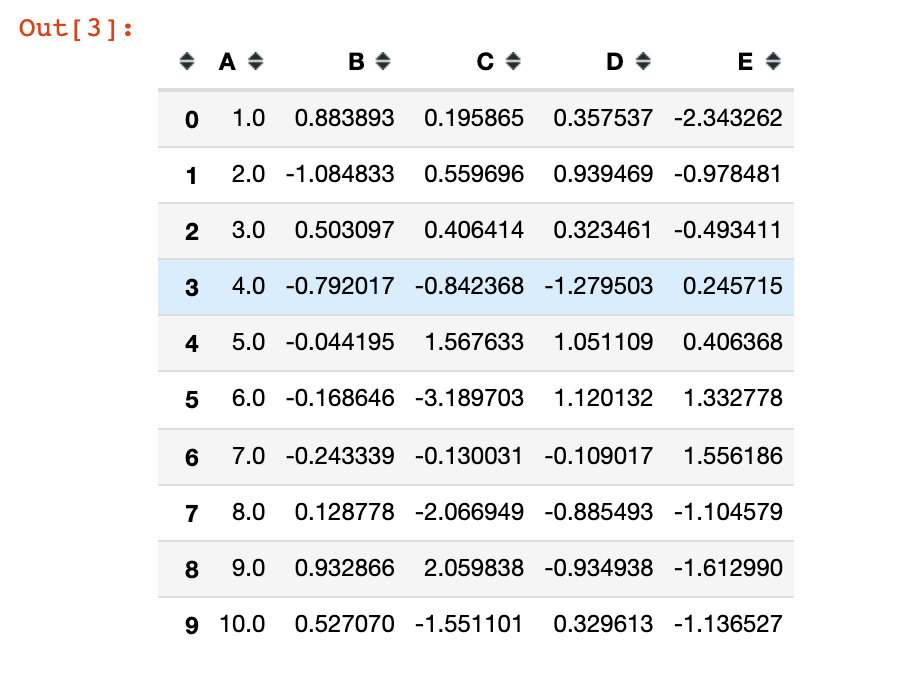
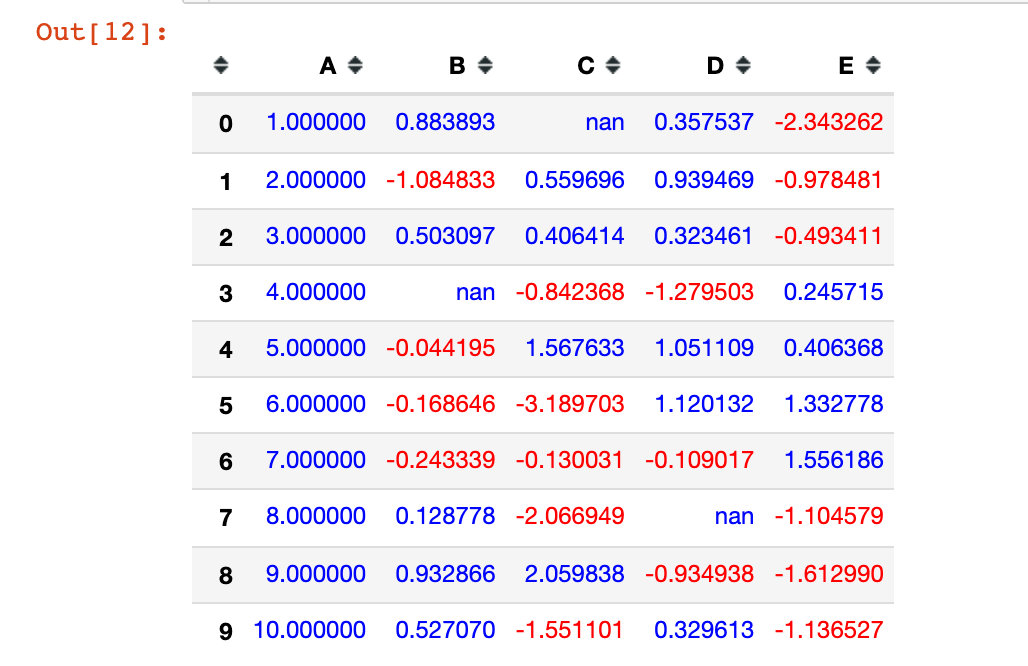
模拟数据
import pandas as pd
import numpy as np
# 设置随机种子,保证每次运行结果相同
np.random.seed(20)
# 模拟数据
df = pd.DataFrame({'A': np.linspace(1, 10, 10)})
# 将两个DataFrame进行合并
df1 = pd.concat([df, pd.DataFrame(np.random.randn(10,4), columns=list("BCDE"))],axis=1)
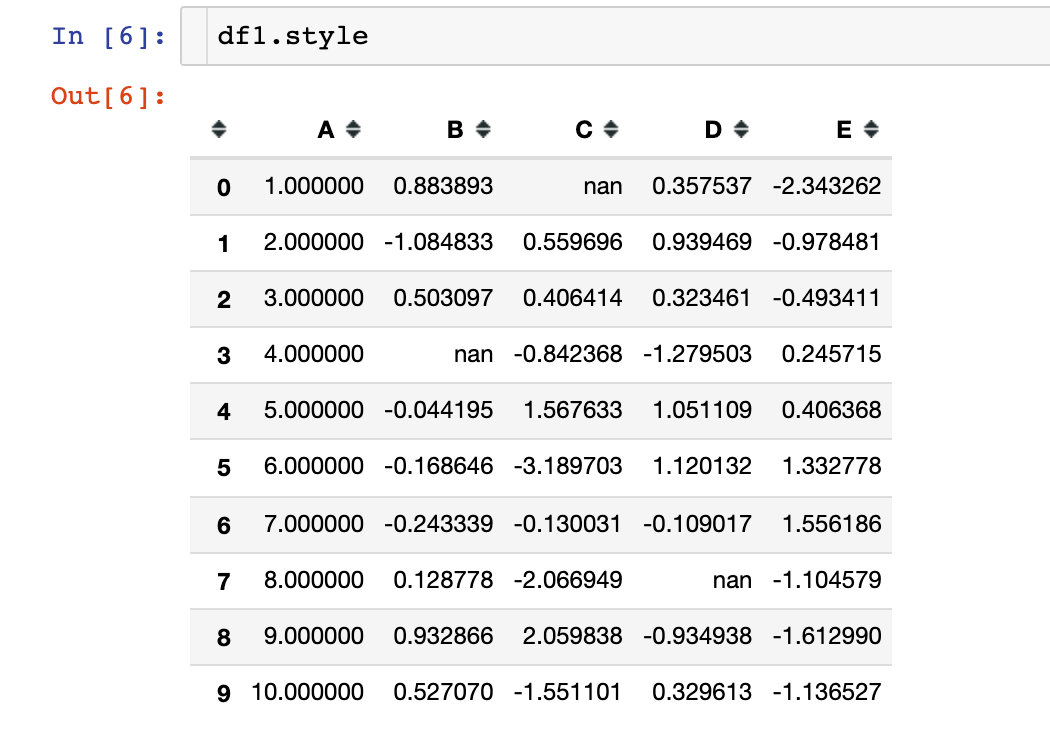
df1
numpy中的linspace(start,stop,setp):表示按照步长取数,包含头尾的数据:
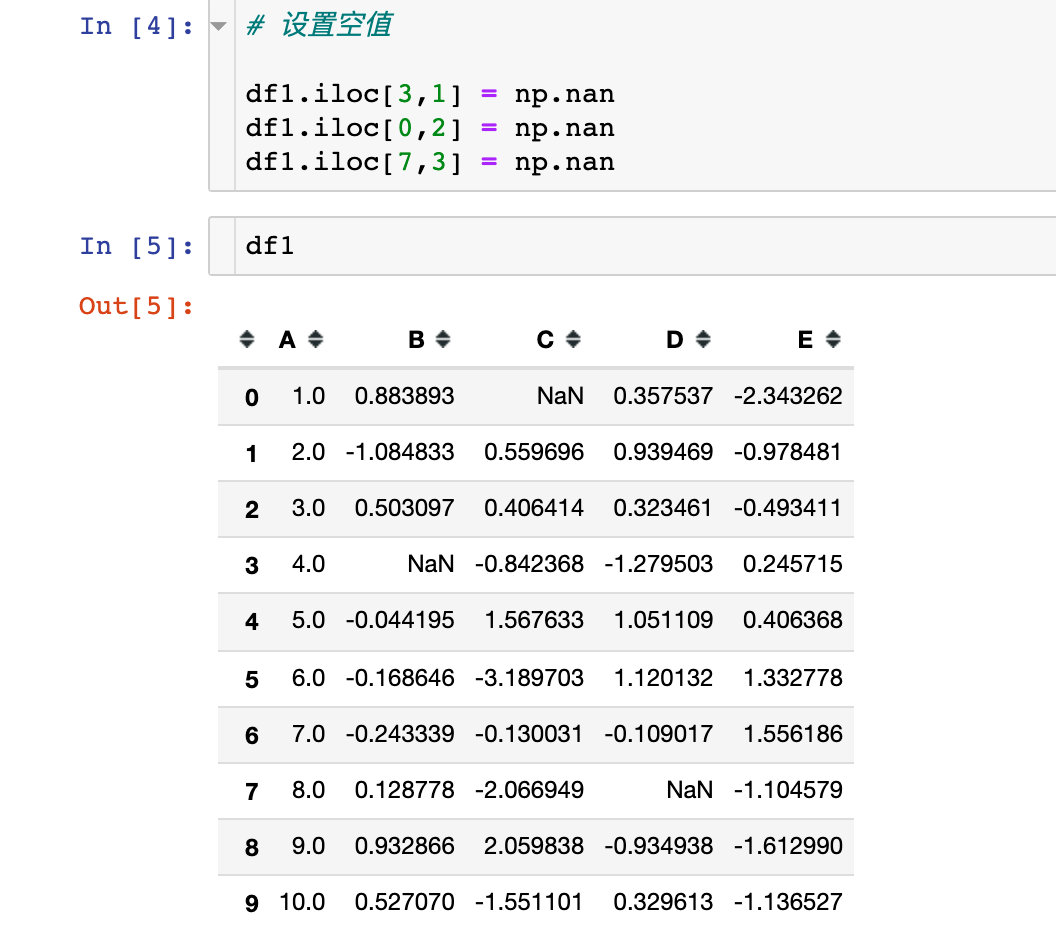
为了查看空值的效果,特意设置了3个空值nan:
查看和隐藏样式
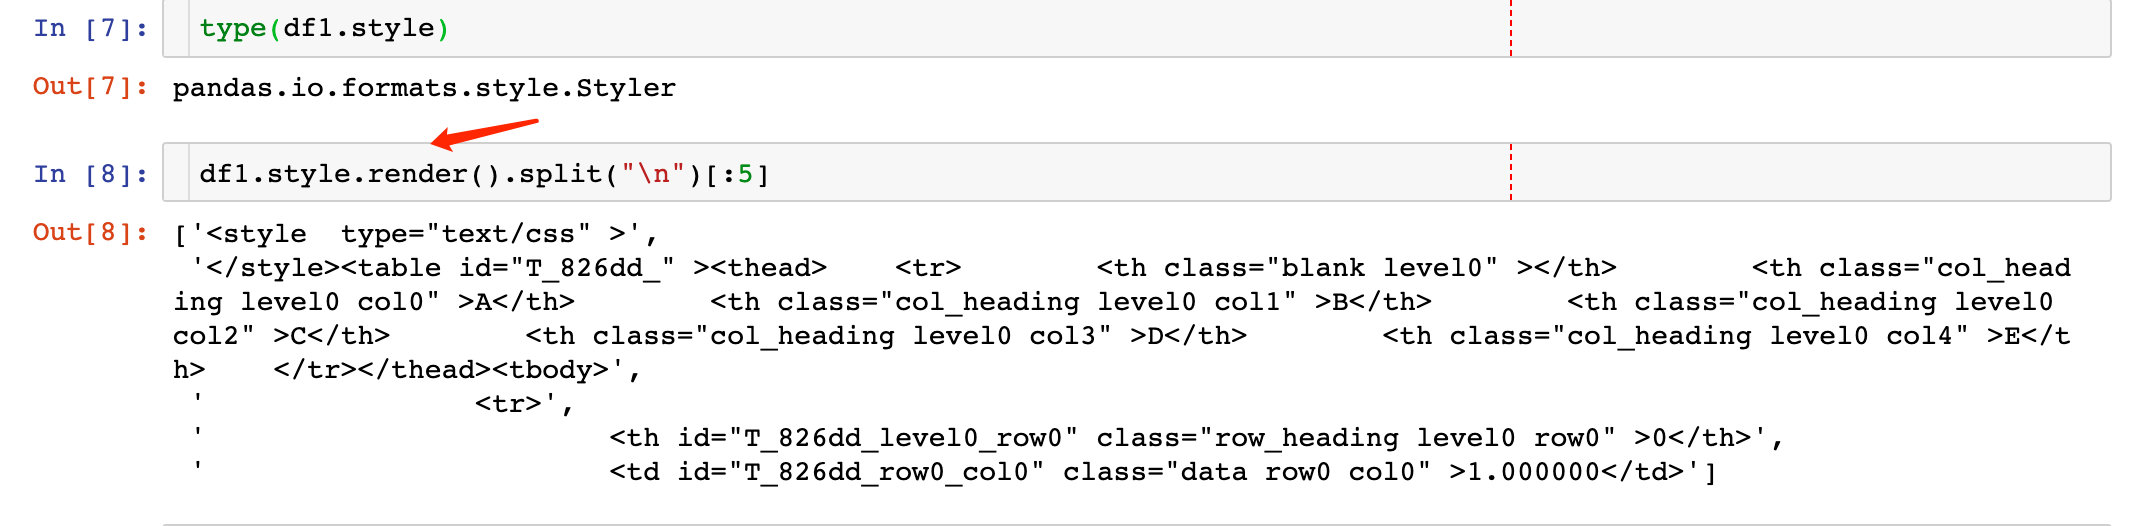
首先是查看DataFrame的样式设置:
我们可以通过render方法来查看数据框样式的具体值:发现都是默认的CSS样式的代码
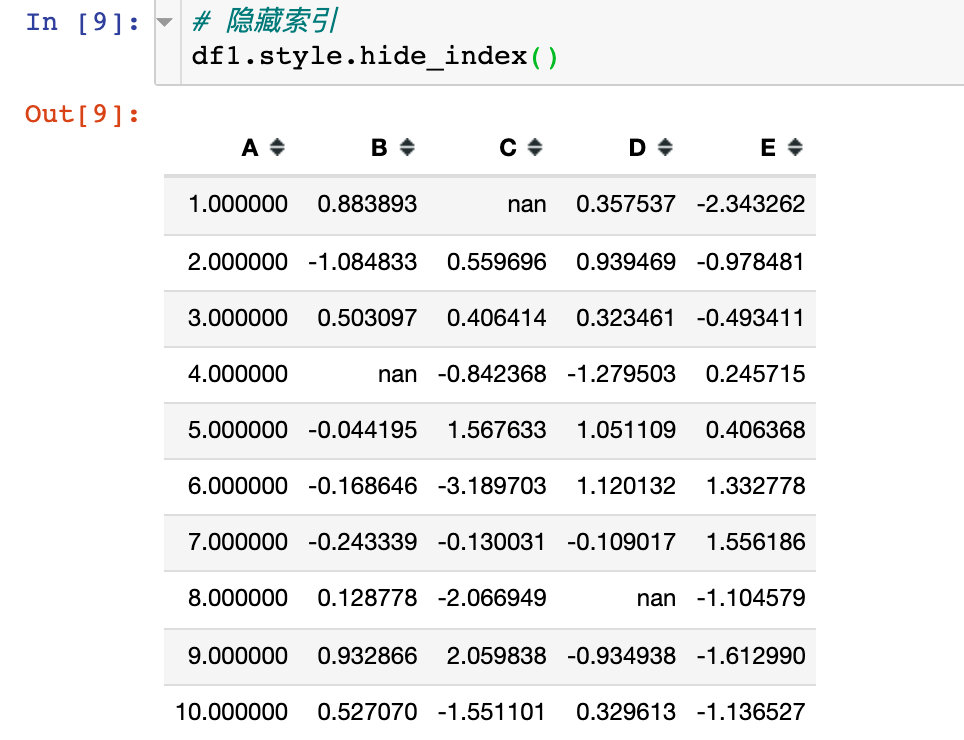
隐藏索引
隐藏index的代码:
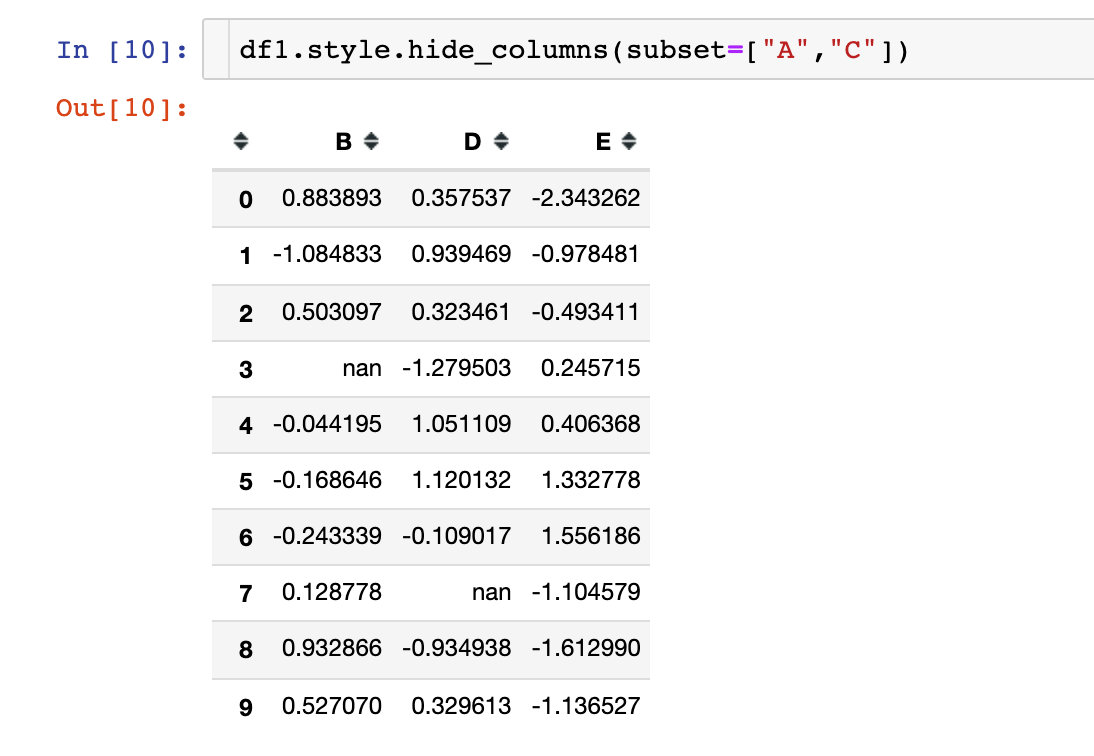
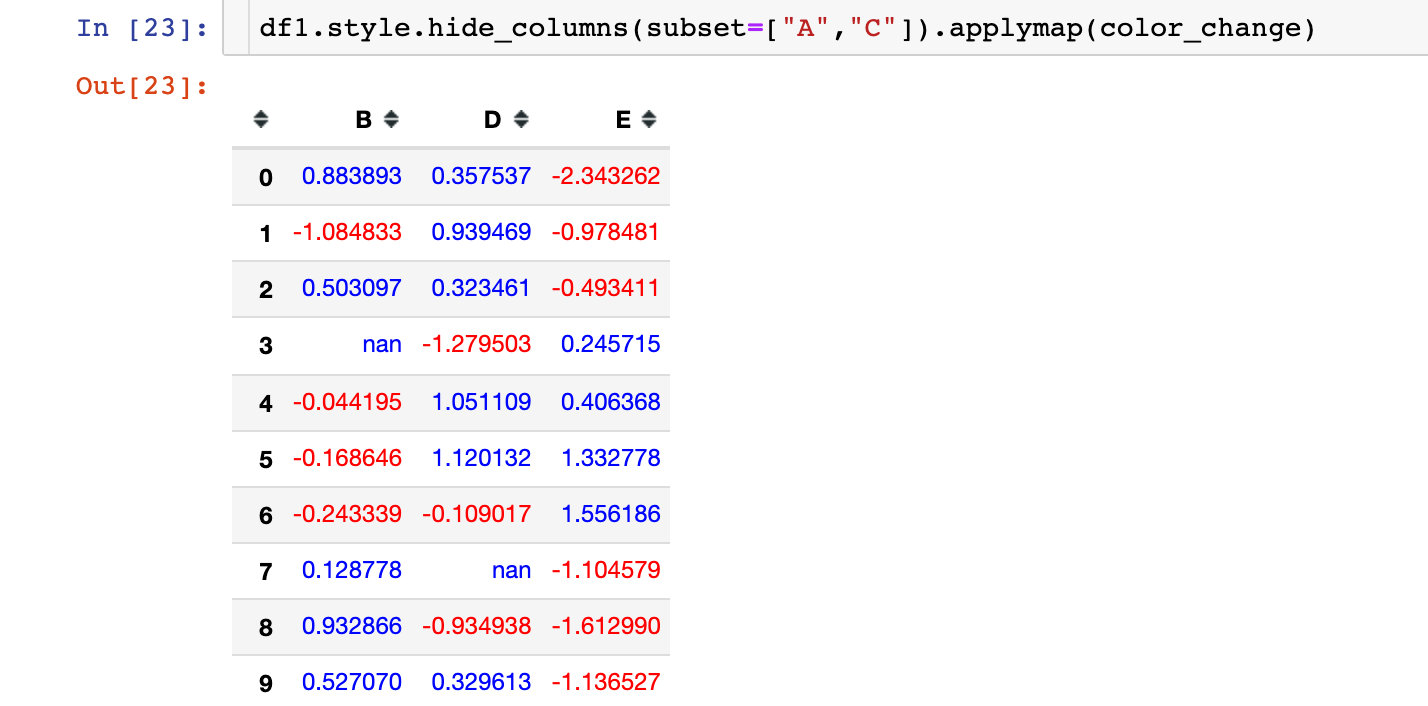
隐藏指定的列
我们发现AC两个列被隐藏了,使用的是参数subset参数:
下面是各种显示样式的案例讲解:
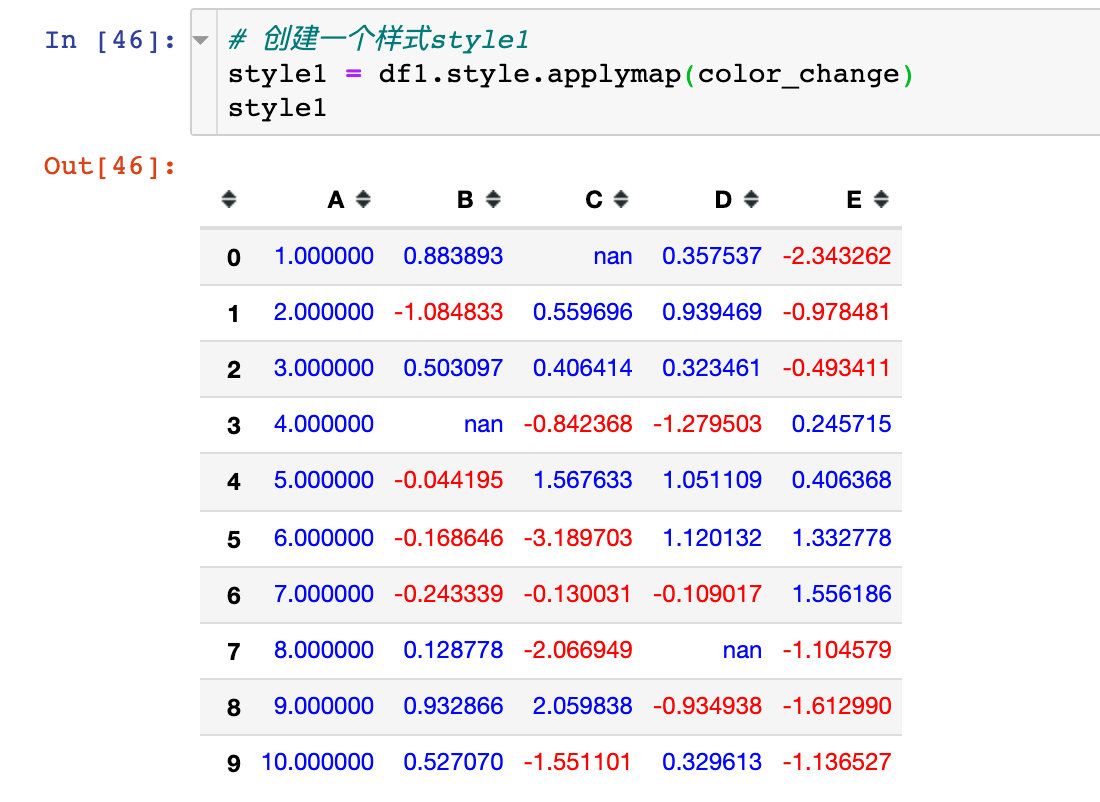
案例1:正负颜色
小于0显示红色,大于0显示蓝色
def color_change(val):
    color = 'red' if val < 0 else 'blue'
    return 'color: %s' % color
# 使用applymap并调用写好的函数
df1.style.applymap(color_change)
applymap方法是针对整个DataFrame的
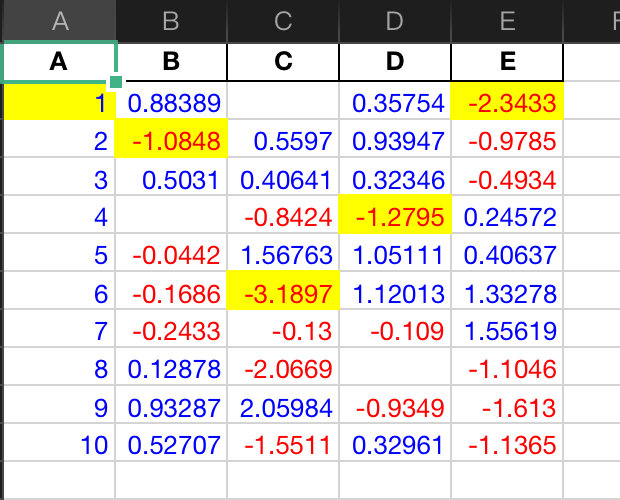
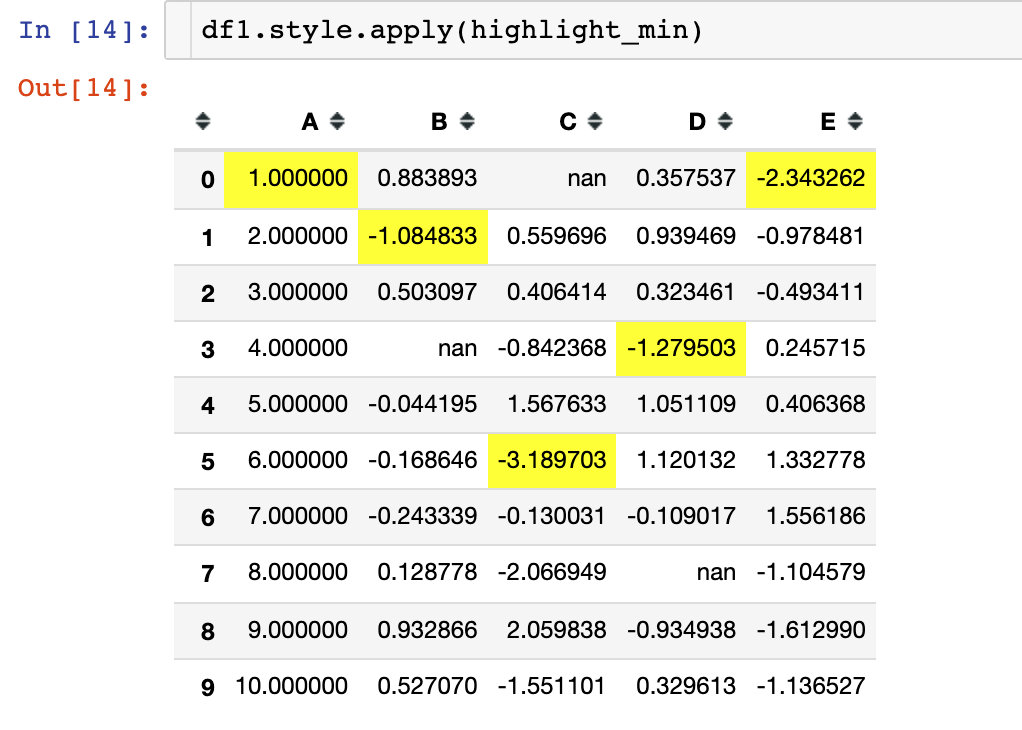
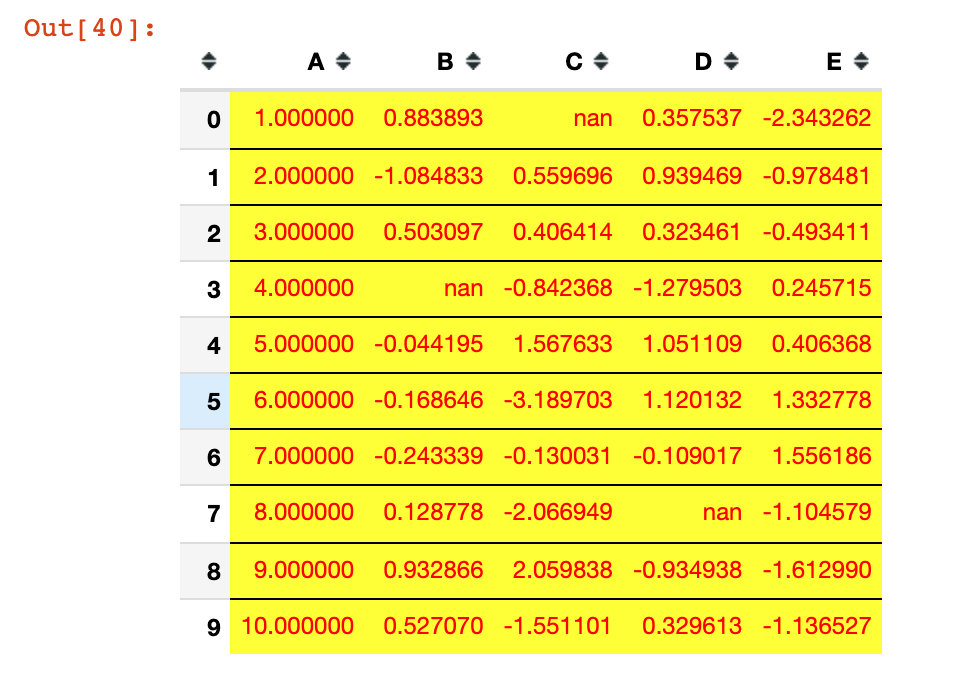
案例2:高亮显示数据
可以高亮显示最大、最小和缺失值。手写一个简单的高亮函数:
def highlight_min(x):
    is_min = x == x.min()
    return ["background-color: yellow" if v else '' for v in is_min]
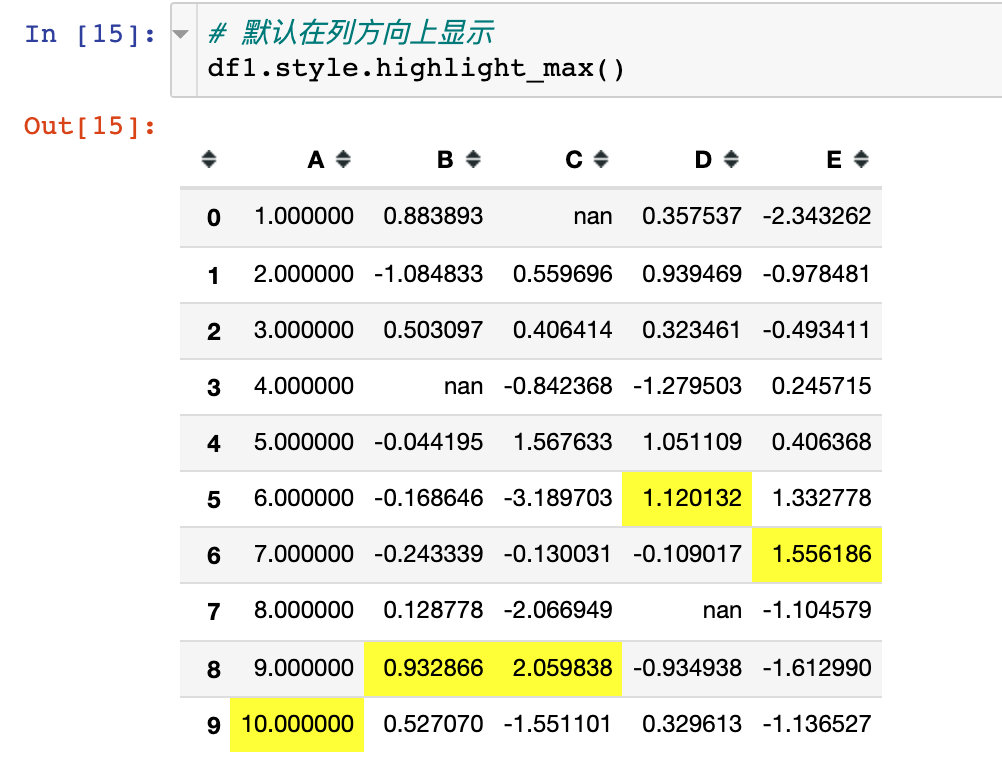
实例3:使用默认高亮函数
Pandas中已经默认写好了内置的3个高亮函数:
- highlight_max(): 最大
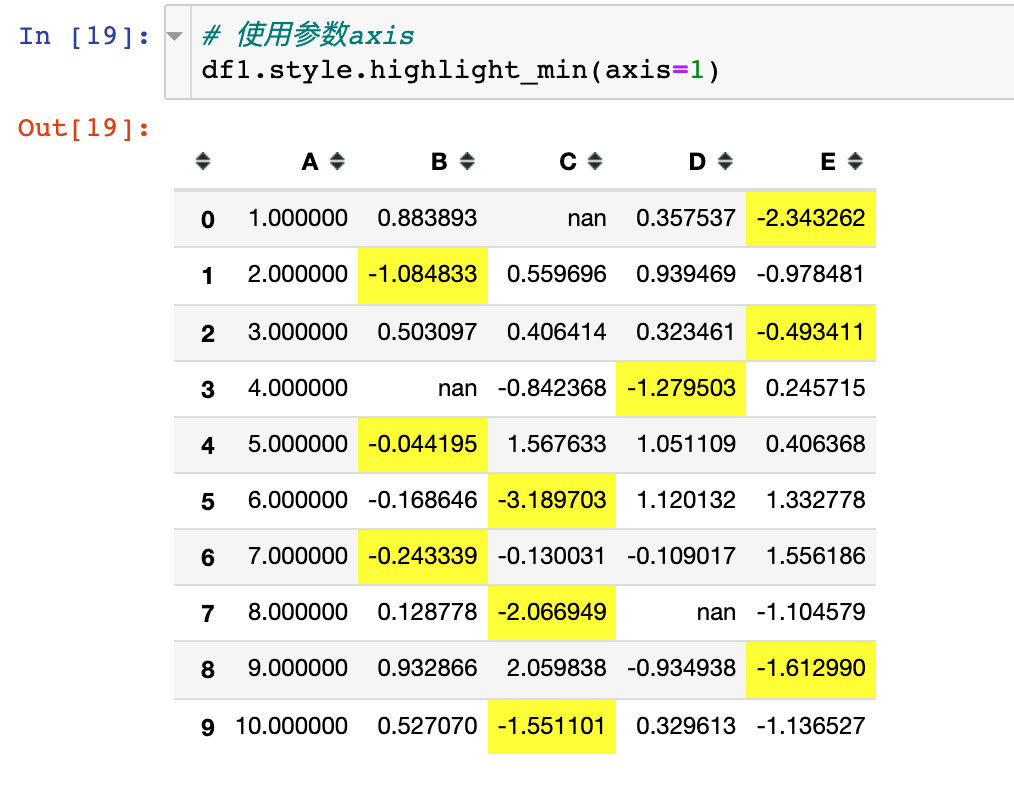
- highlight_min(): 最小
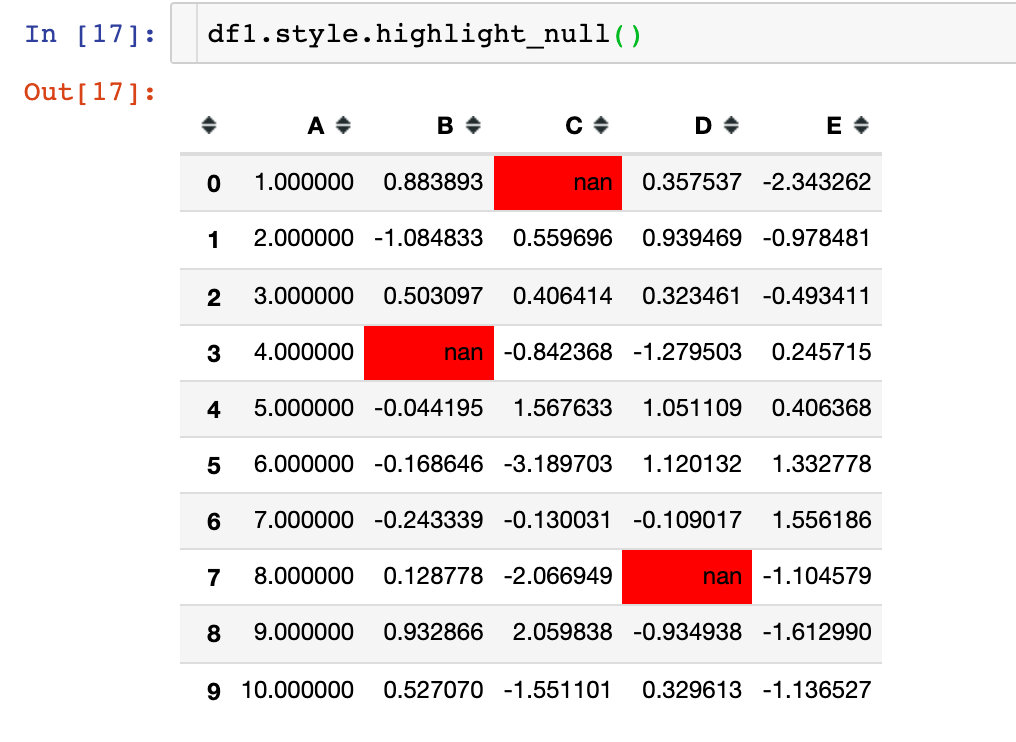
- highlight_null(): 空值
同时我们还可以搭配参数axis来显示行或者列
1、高亮最大值
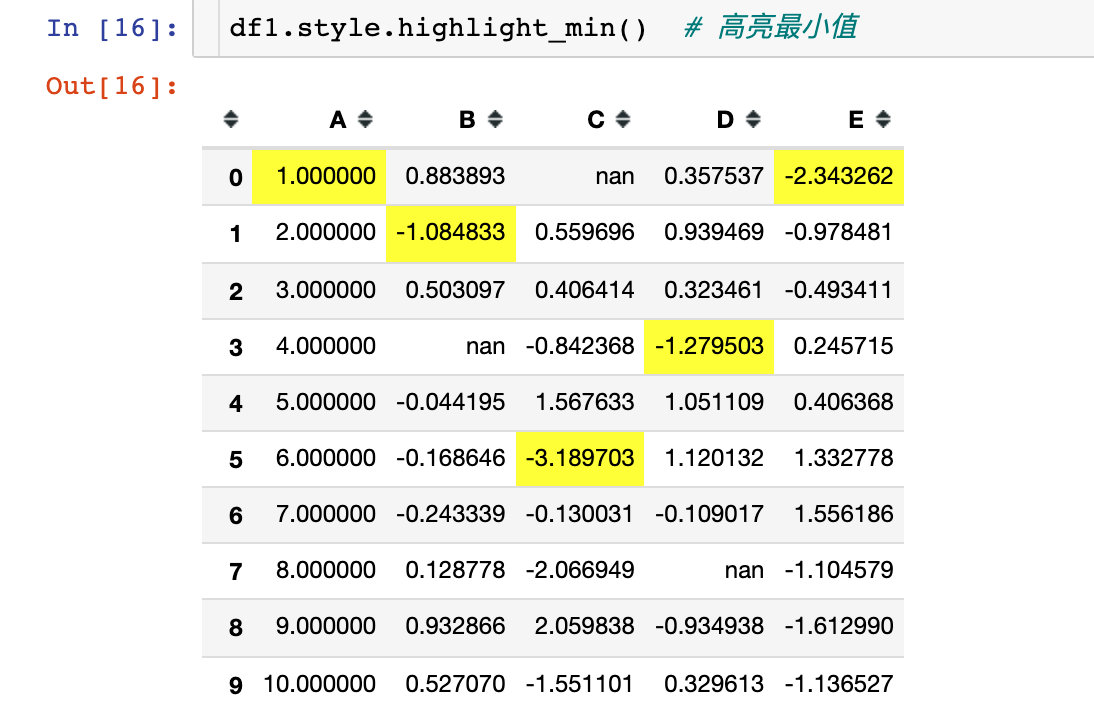
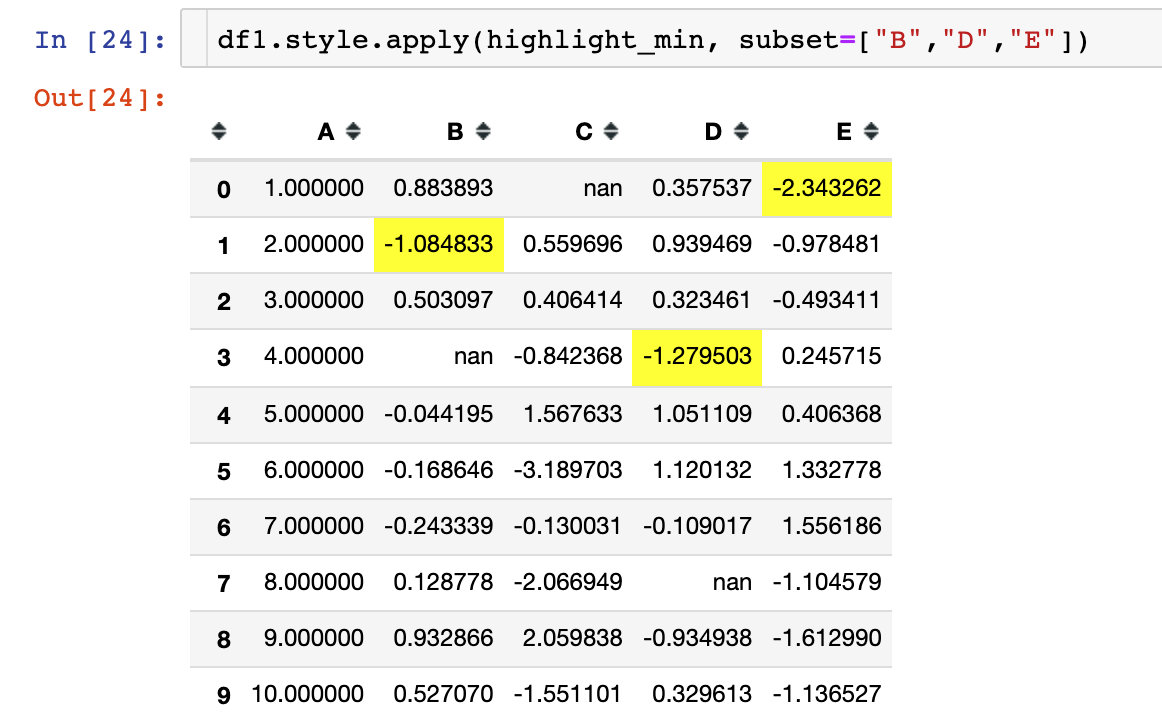
2、高亮每列的最小值
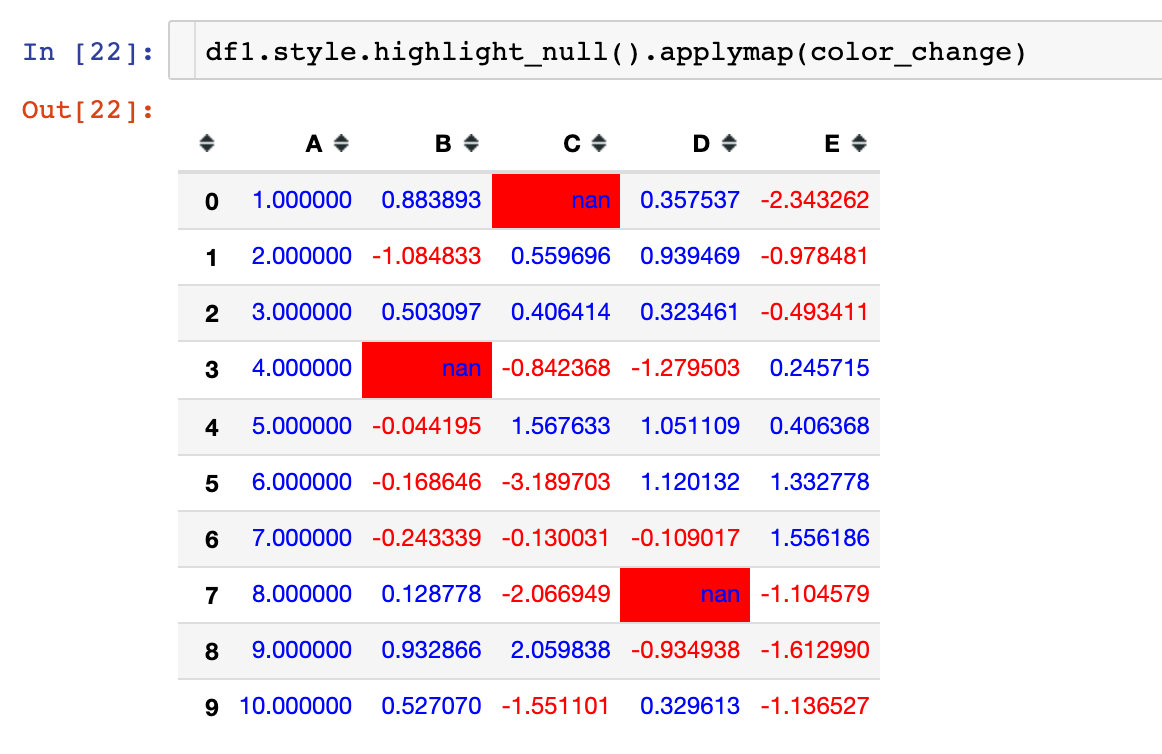
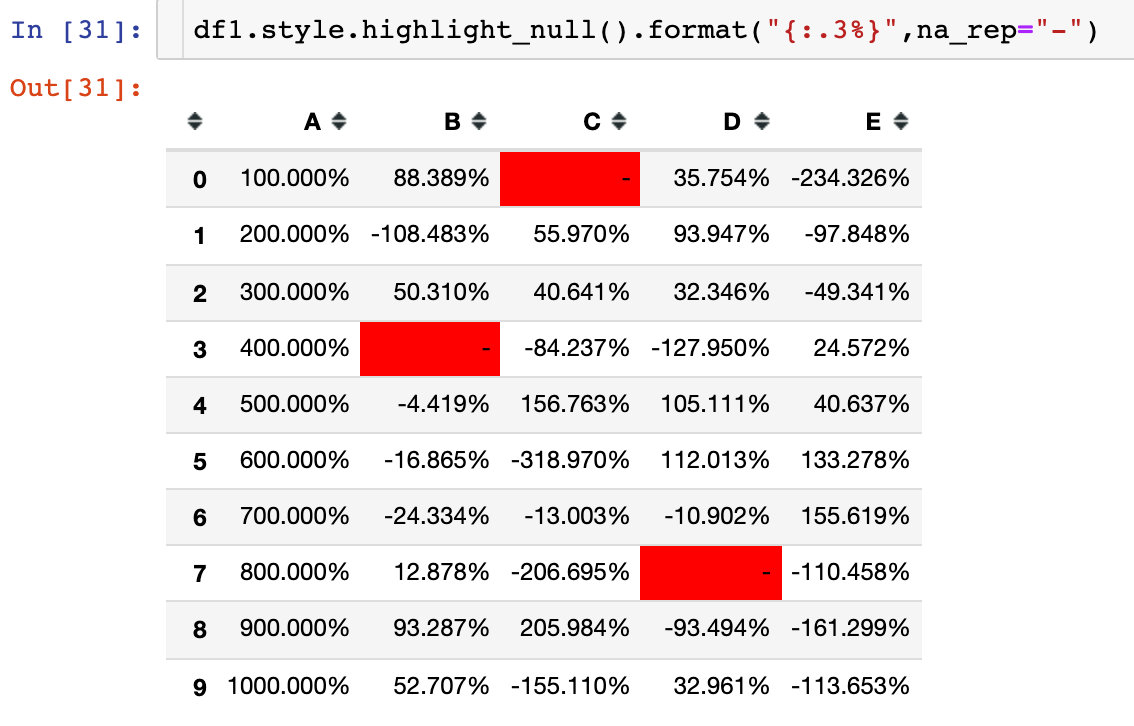
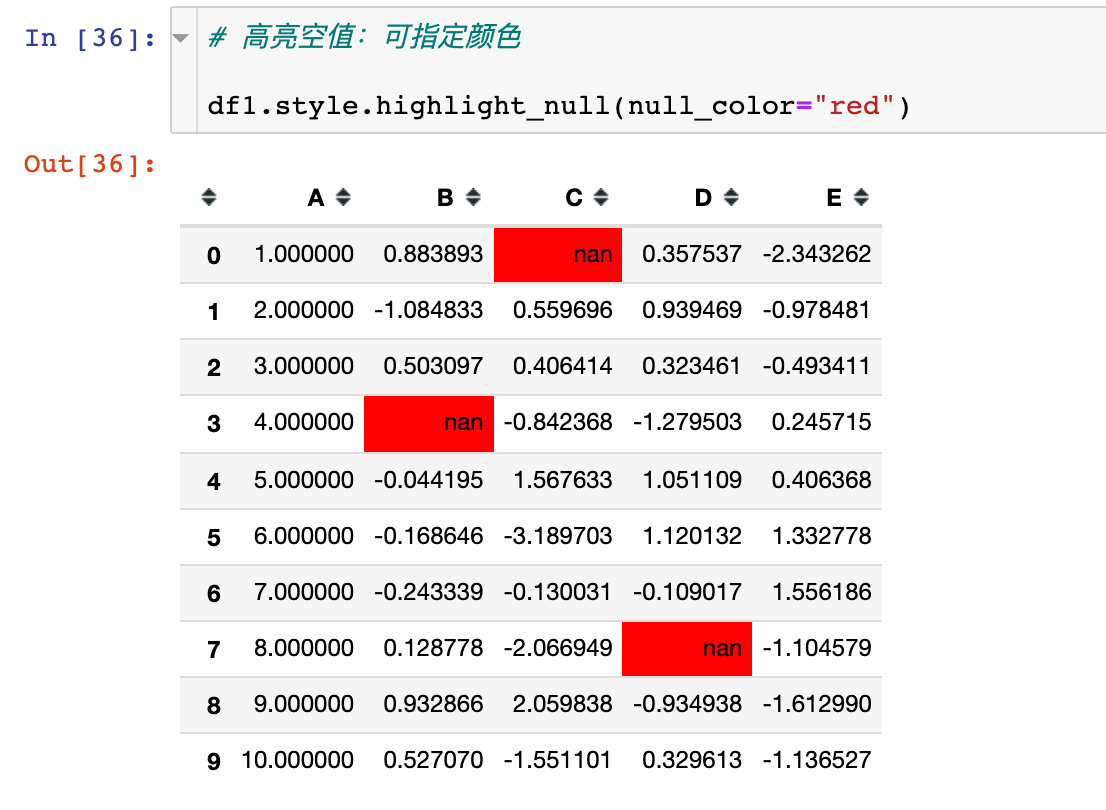
3、高亮空值:默认是红色
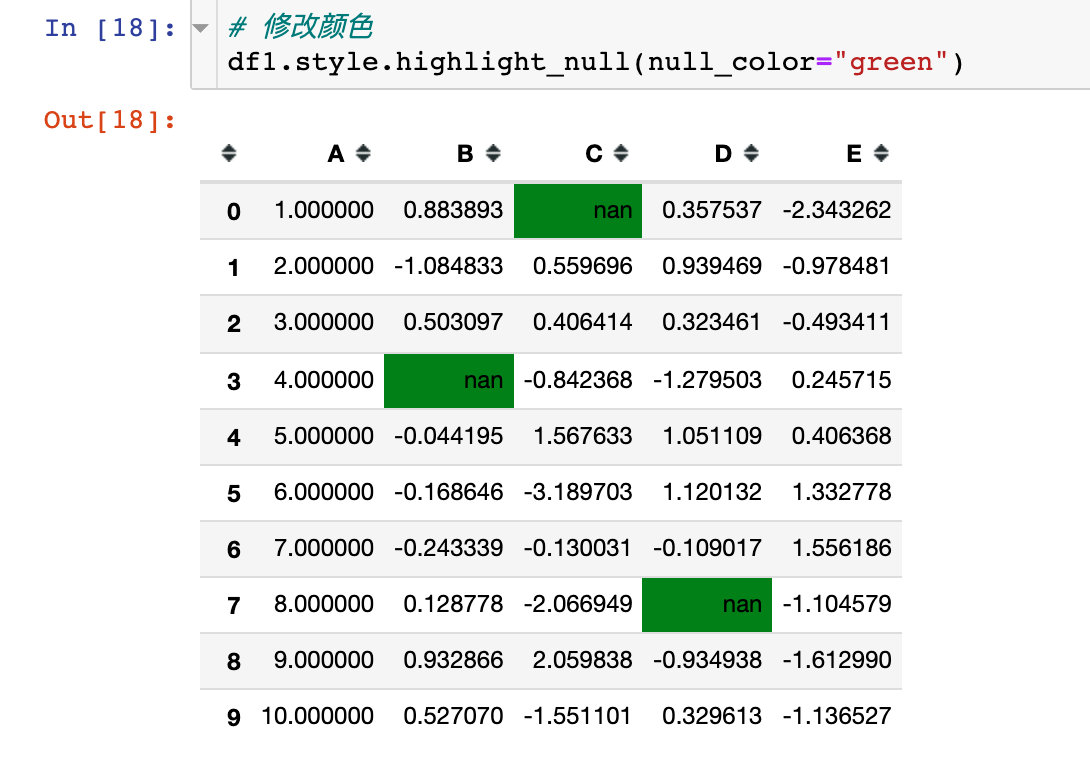
当然我们是可以改变颜色的,通过使用参数null_color:
使用参数axis=1,表示在行的方向上进行操作:
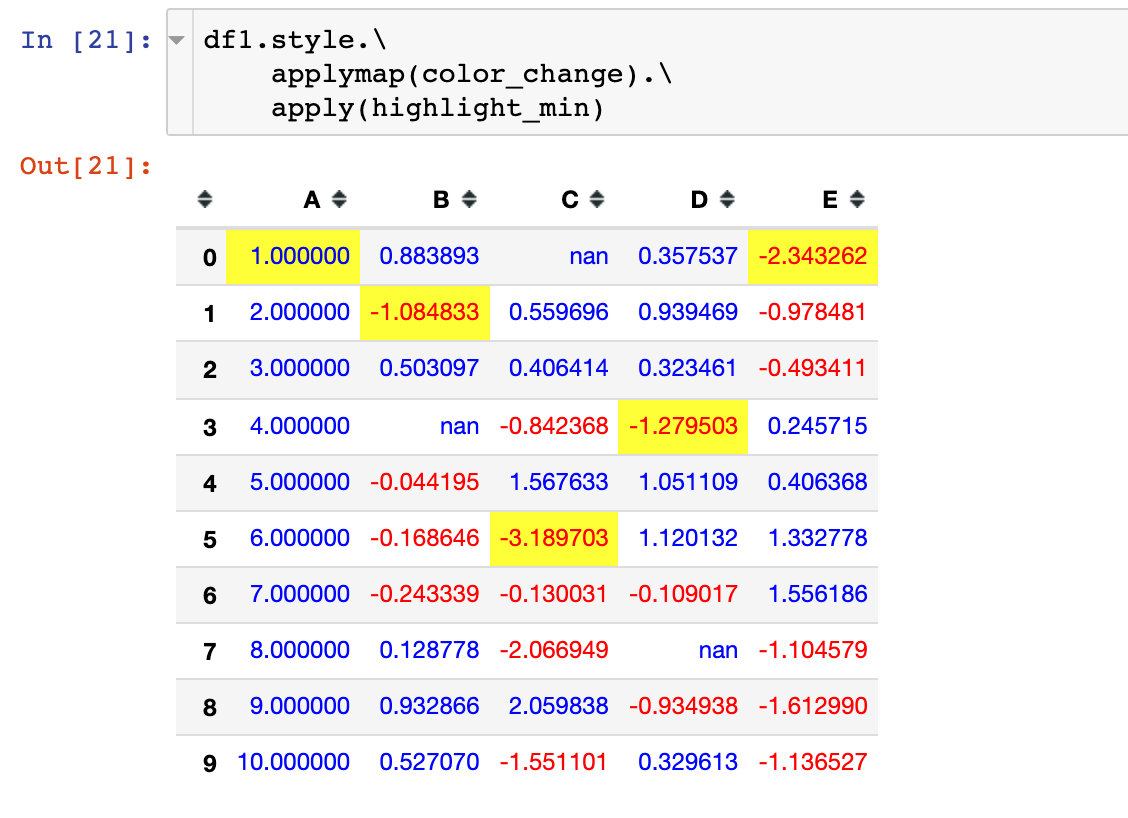
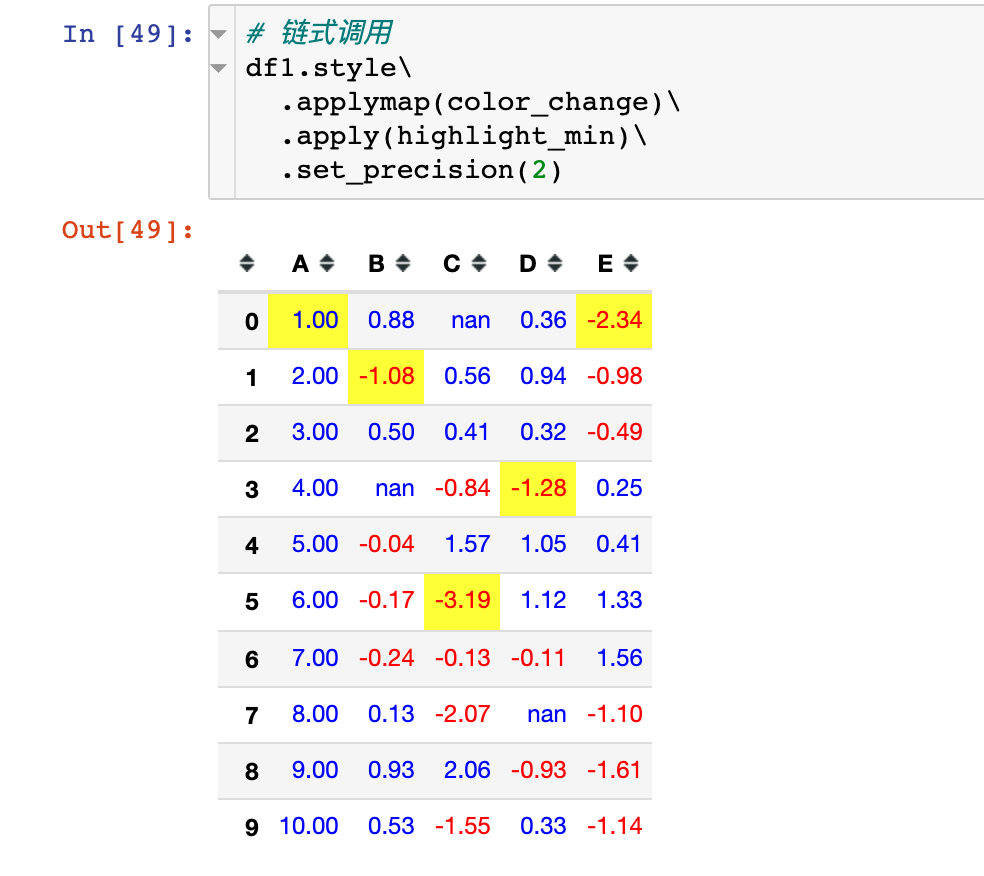
案例4:链式调用
链式调用指的是在同一个样式操作中同时使用多个函数(方法):
# color_change + highlight_max
df1.style.applymap(color_change).apply(highlight_min)
如果方法特别多,可以分行写:
# color_change + highlight_max
df1.style.\
applymap(color_change).\
apply(highlight_min)

# 或者:外面再加层括号,表示整个代码是一个整体
(df1.style.
applymap(color_change).
apply(highlight_min))
空值高亮和改变颜色参数同时使用,实现链式调用:
隐藏列属性和自定义参数同时使用:
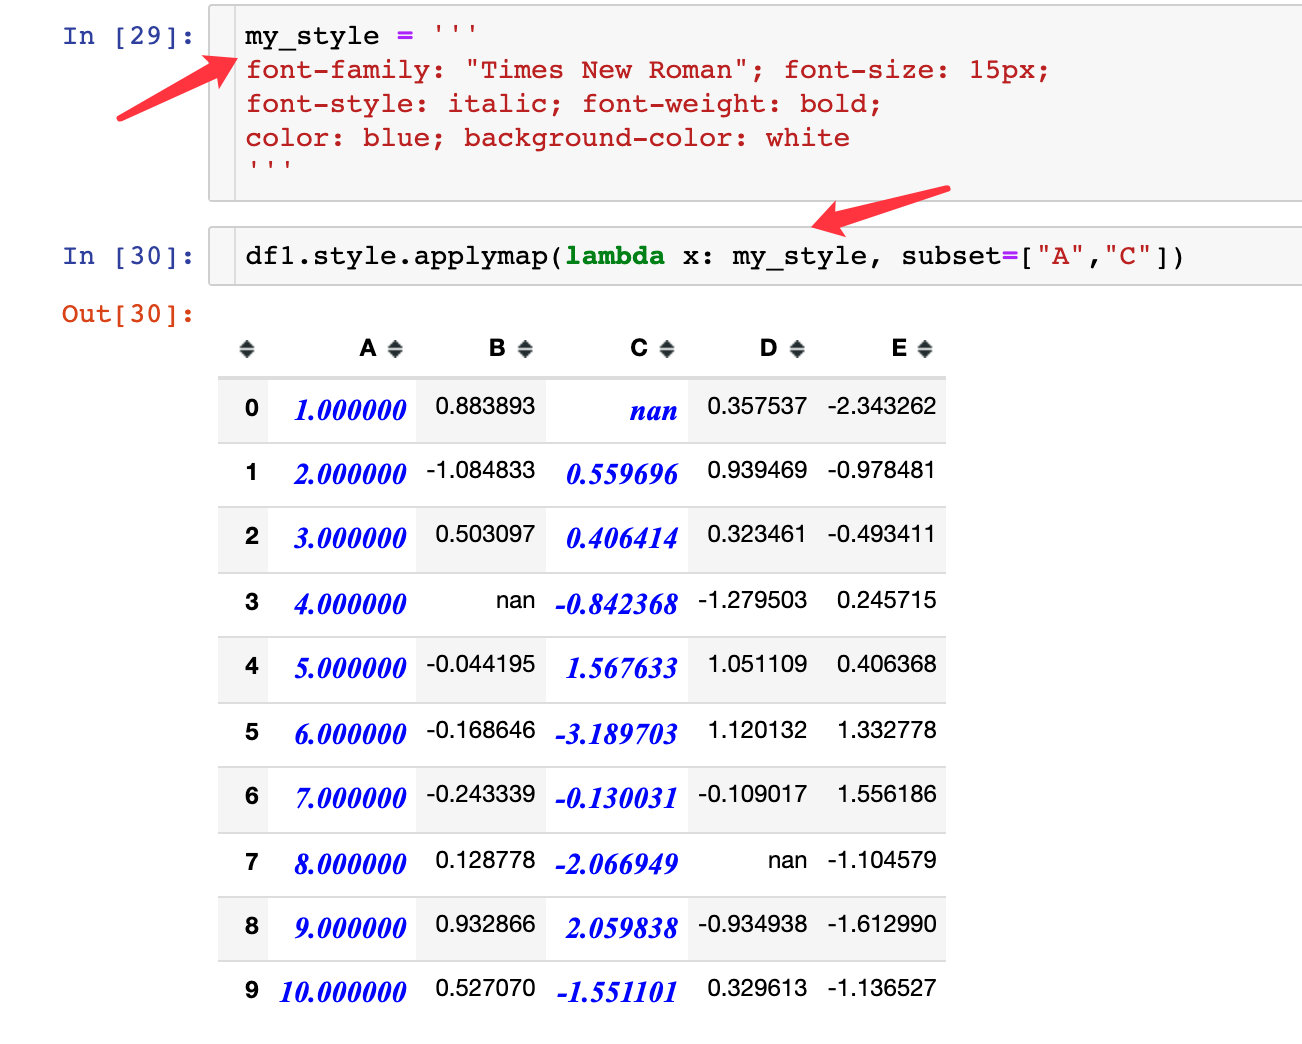
实例5:部分数据美化
使用参数subset参数控制作用的行列,传入的参数可以是:
- 列标签
- 列表(numpy数组)
- 元组(row_indexer, column_indexer)
部分列属性
通过参数subset来指定我们想要美化的列属性:
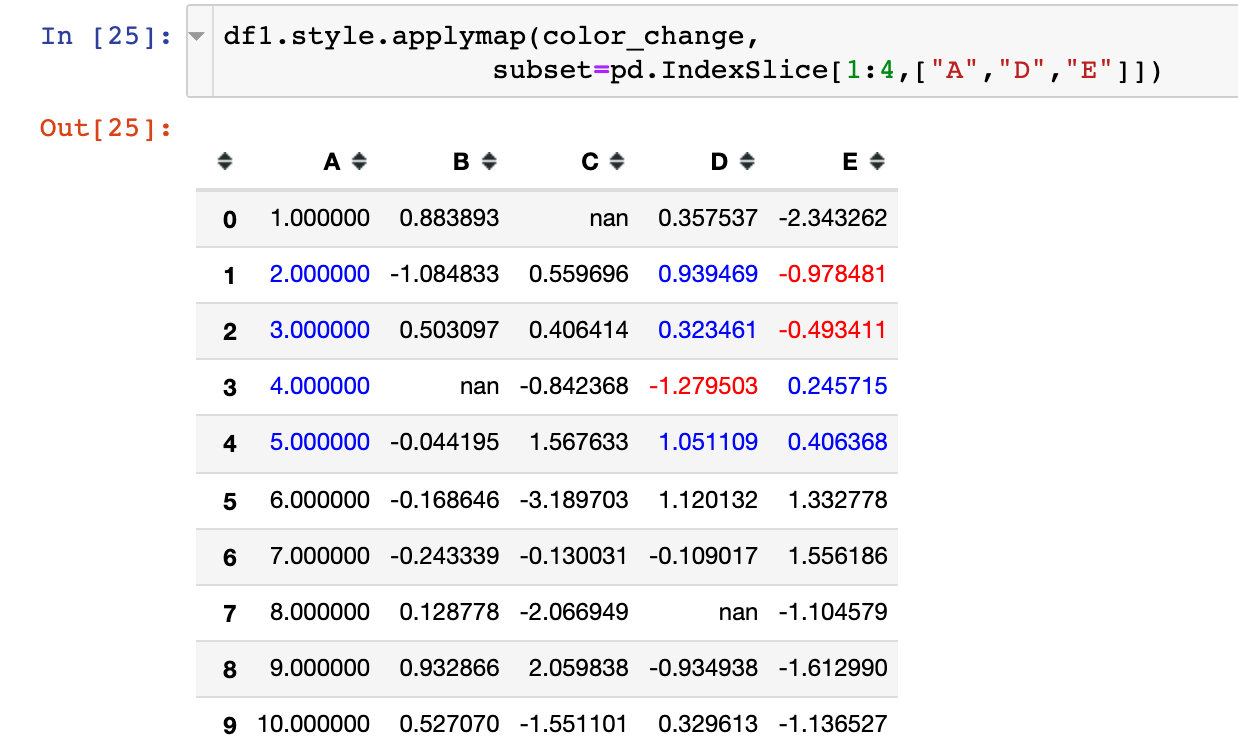
pd.IndexSlice构造列表
通过pd.IndexSlice来构造
实例6:值的格式化显示(Styler.format)
Styler.format来控制数值的格式化输出,类似于Python中的字符串格式化
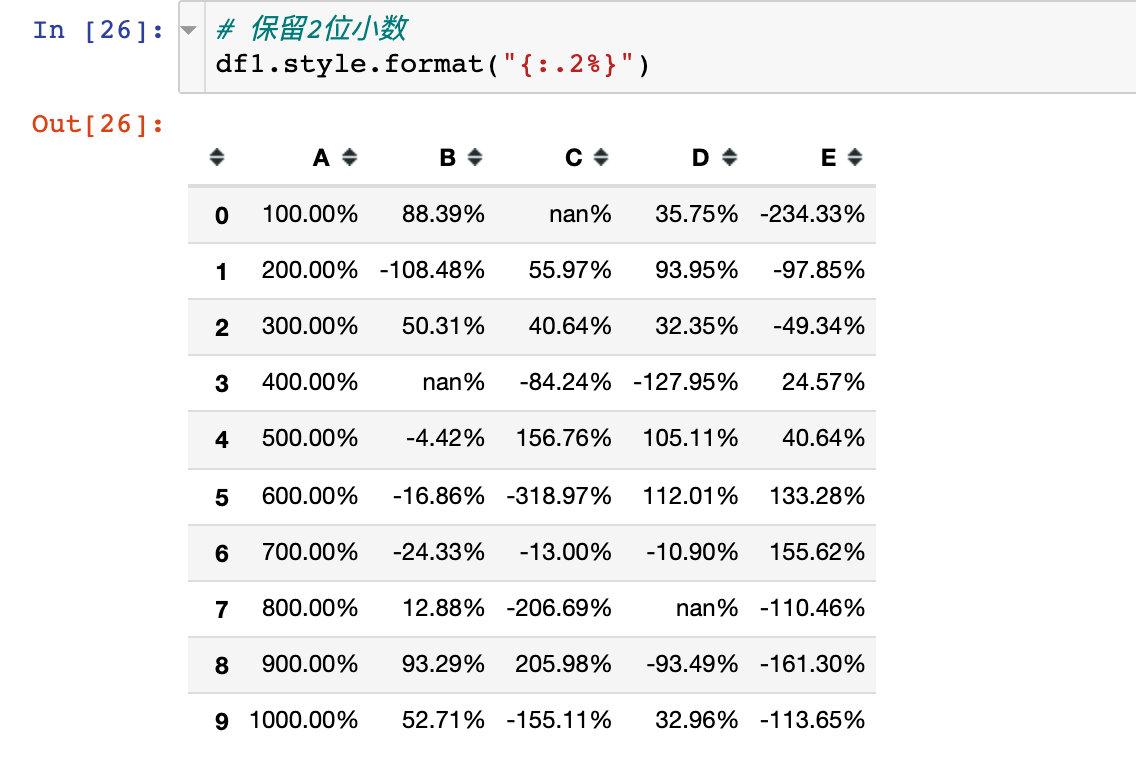
整体显示
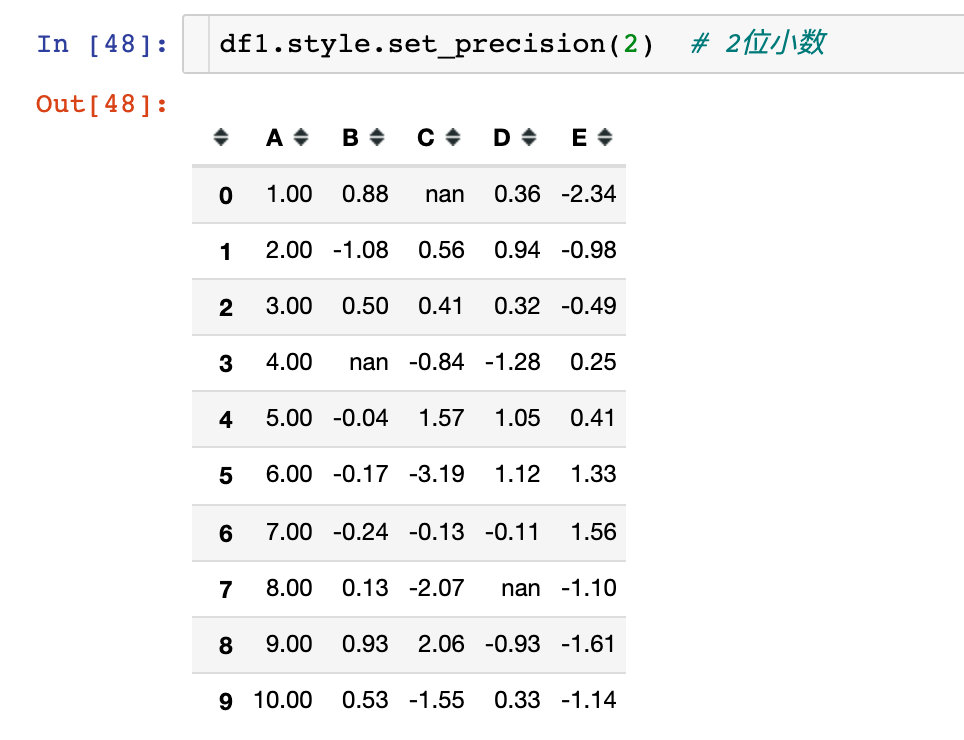
比如我们想要全部数据只显示两位小数:
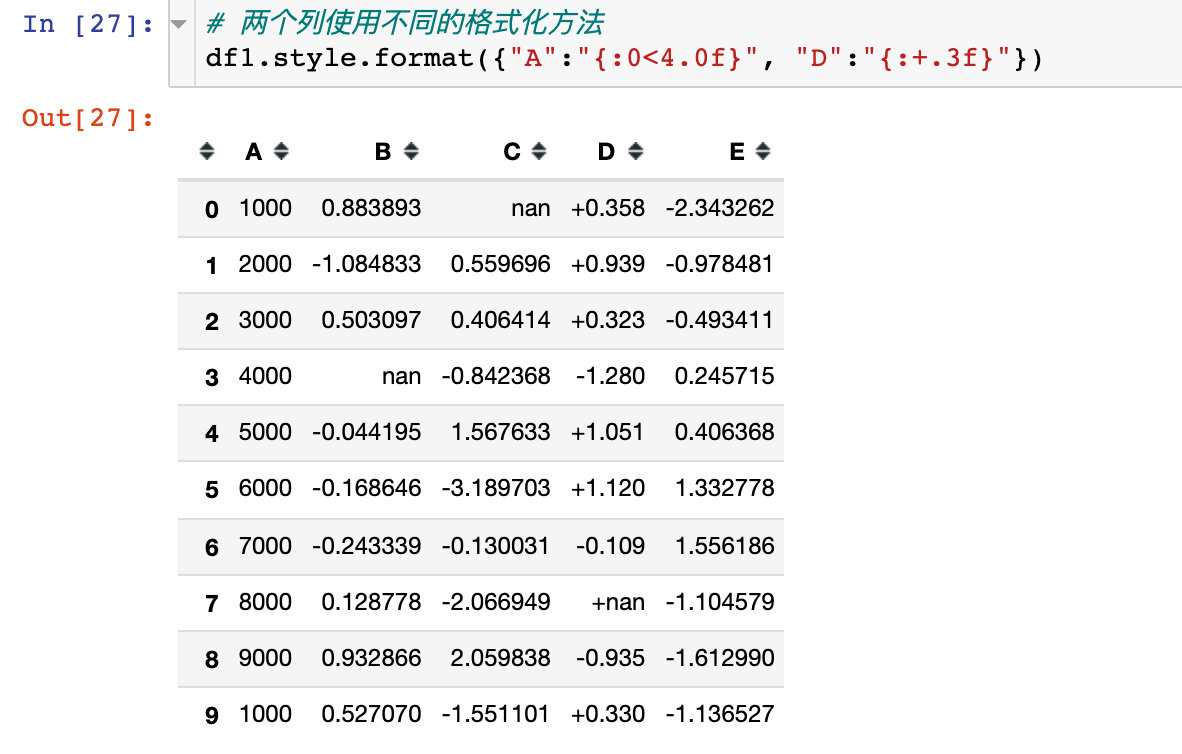
使用字典,格式化特定列
通过字典的形式,列属性名当做键,格式说明当做值,进行格式化设置:
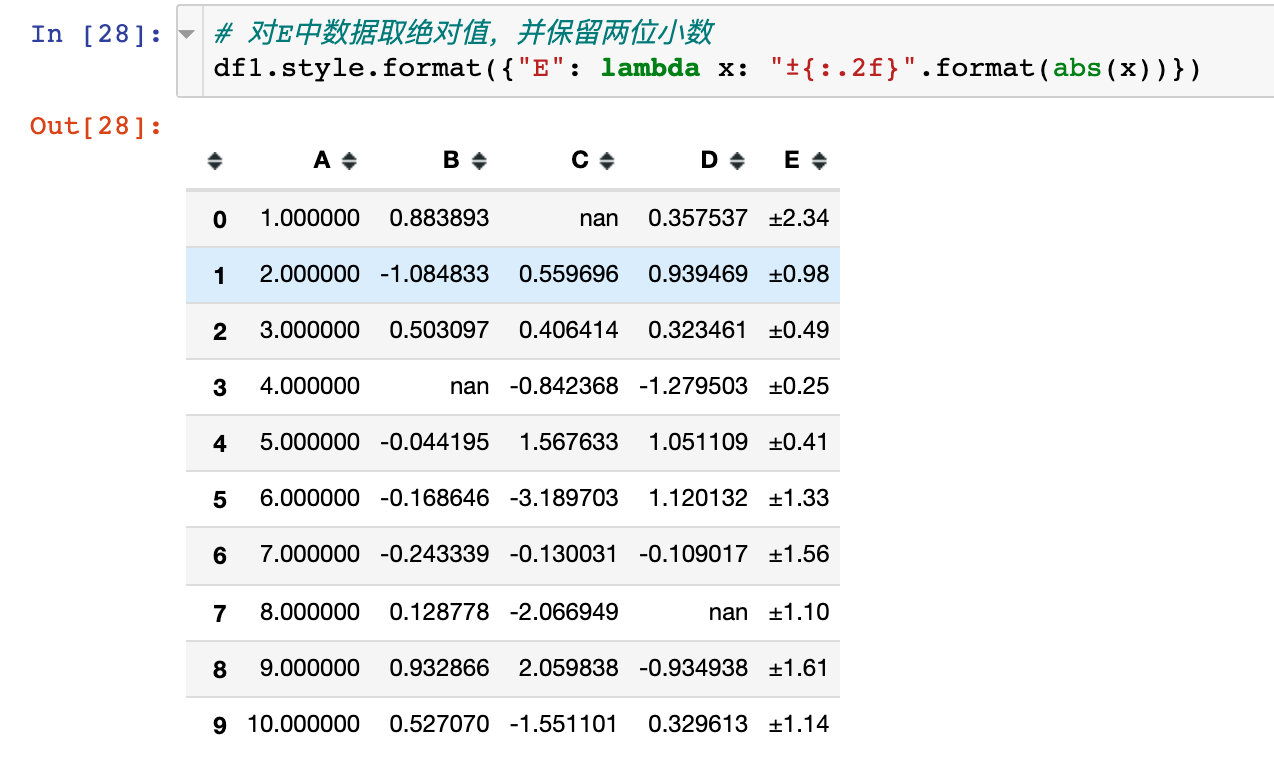
使用lambda匿名函数
空值显示
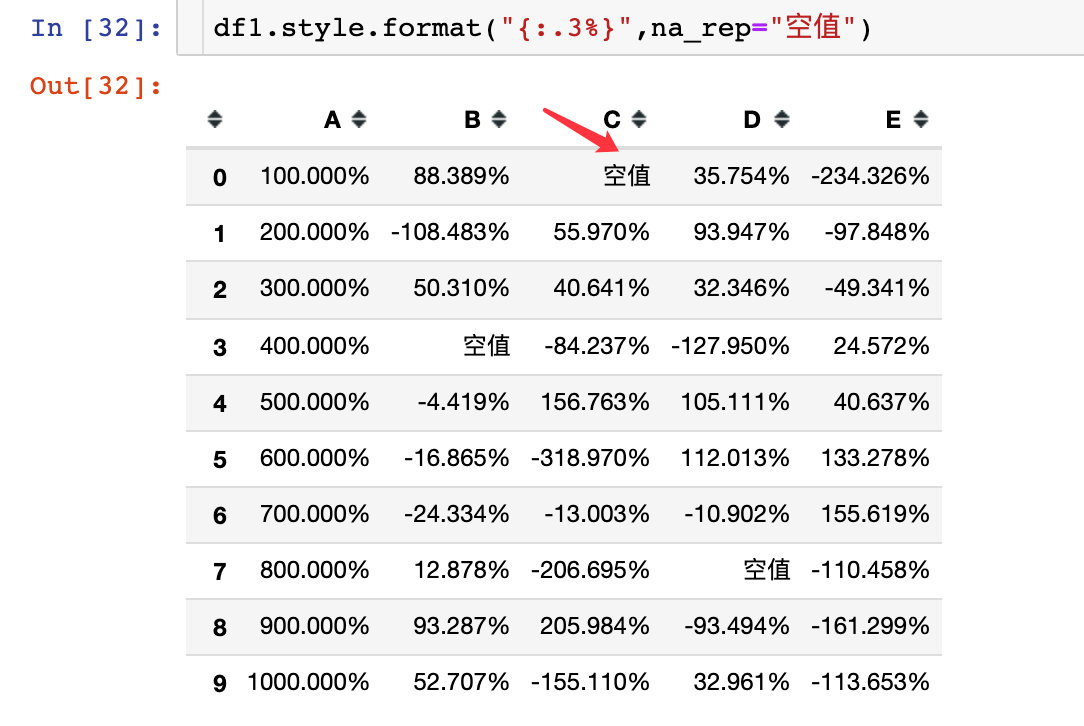
通过参数na_rep,将空值进行替代:
用“空值”两个字来替代:
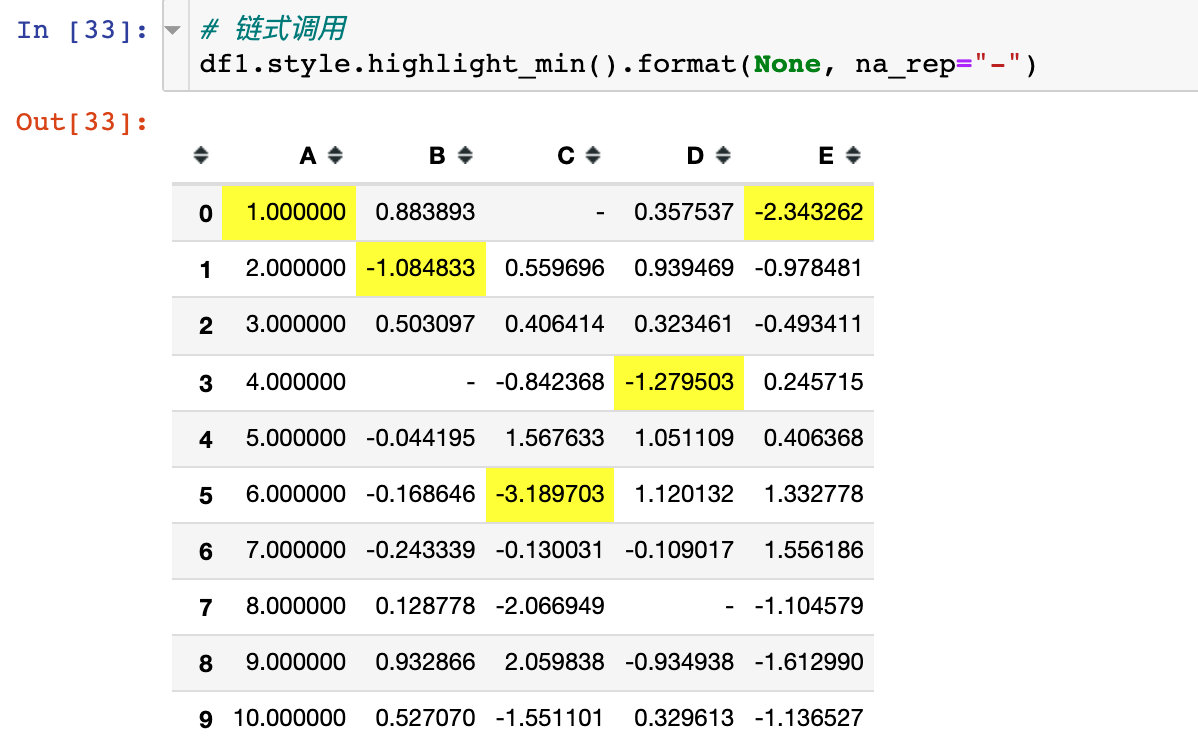
链式调用同时使用“-”来替代:
表情符
使用emoji表情符:
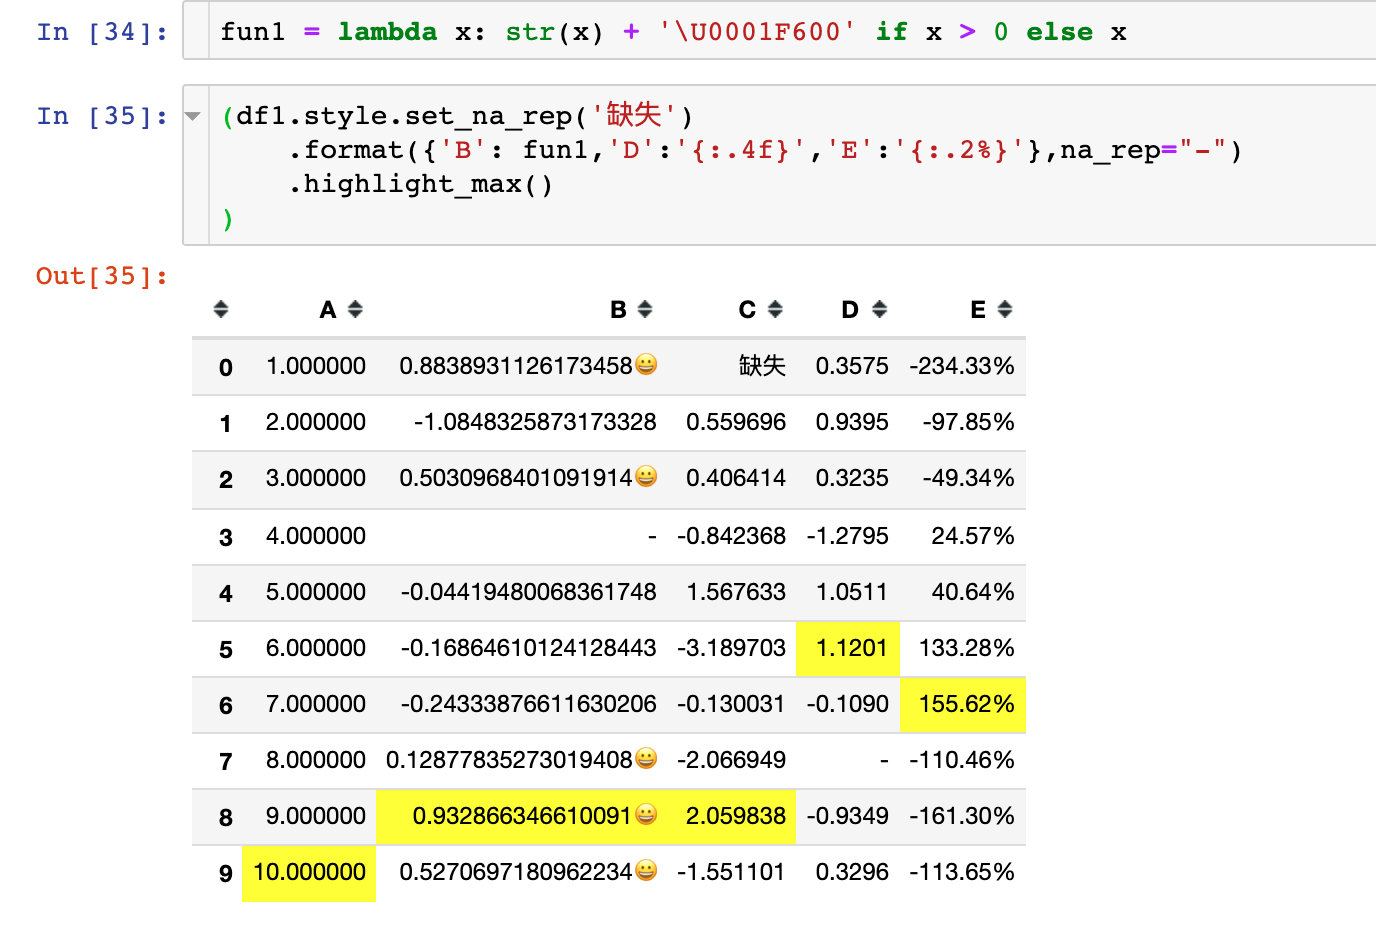
实例7:内置样式
内置函数
在这里使用的是内置的空值高亮函数:
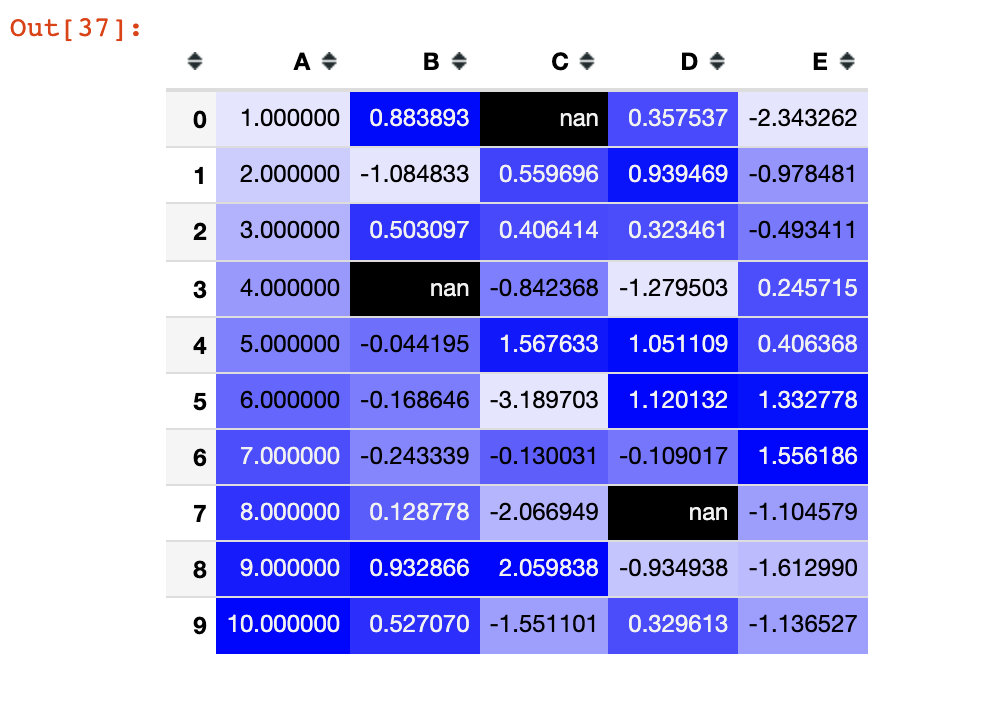
热力图制作
我们借助seaborn库来实现:
import seaborn as sns

cm = sns.light_palette("blue", as_cmap=True)
s = df1.style.background_gradient(cmap=cm)
s
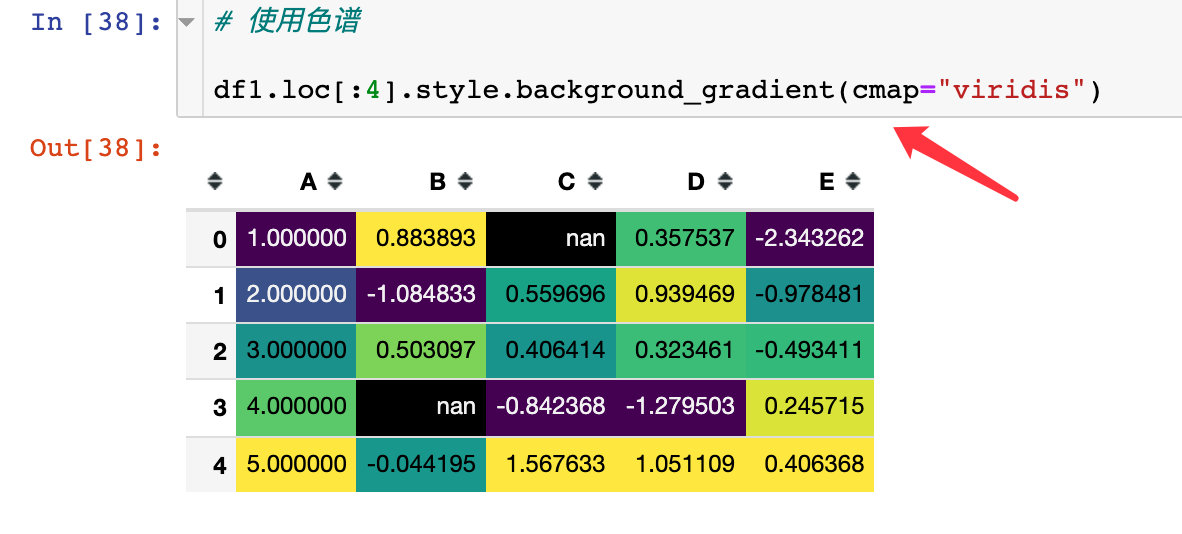
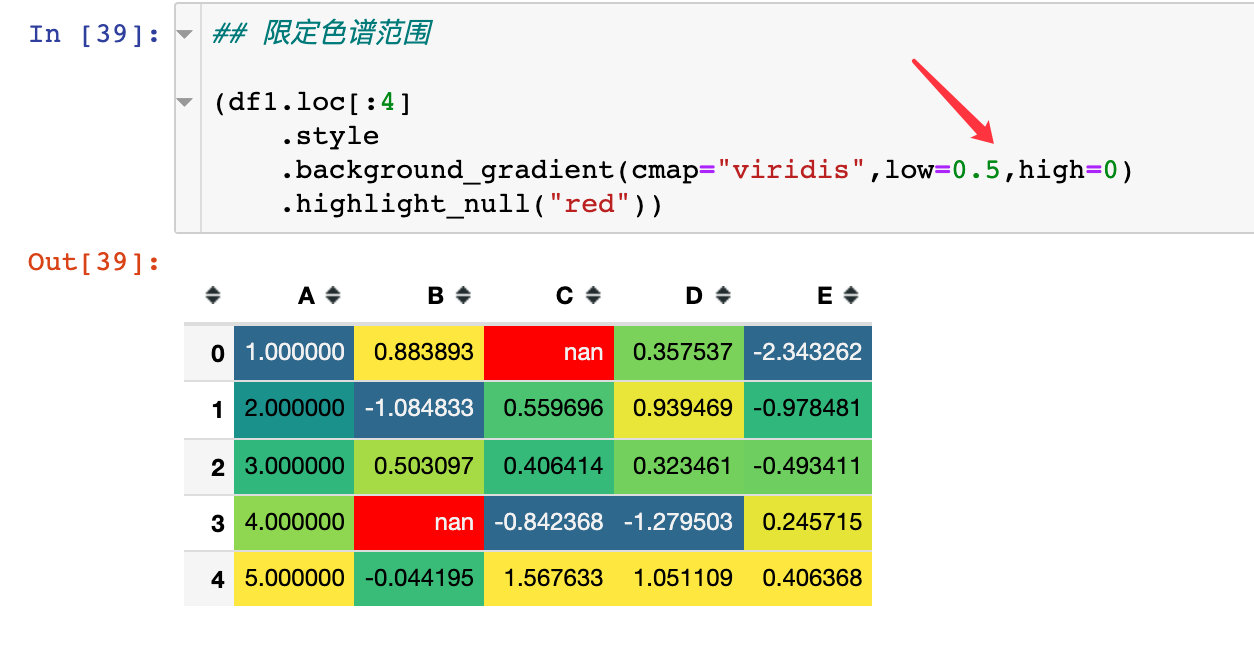
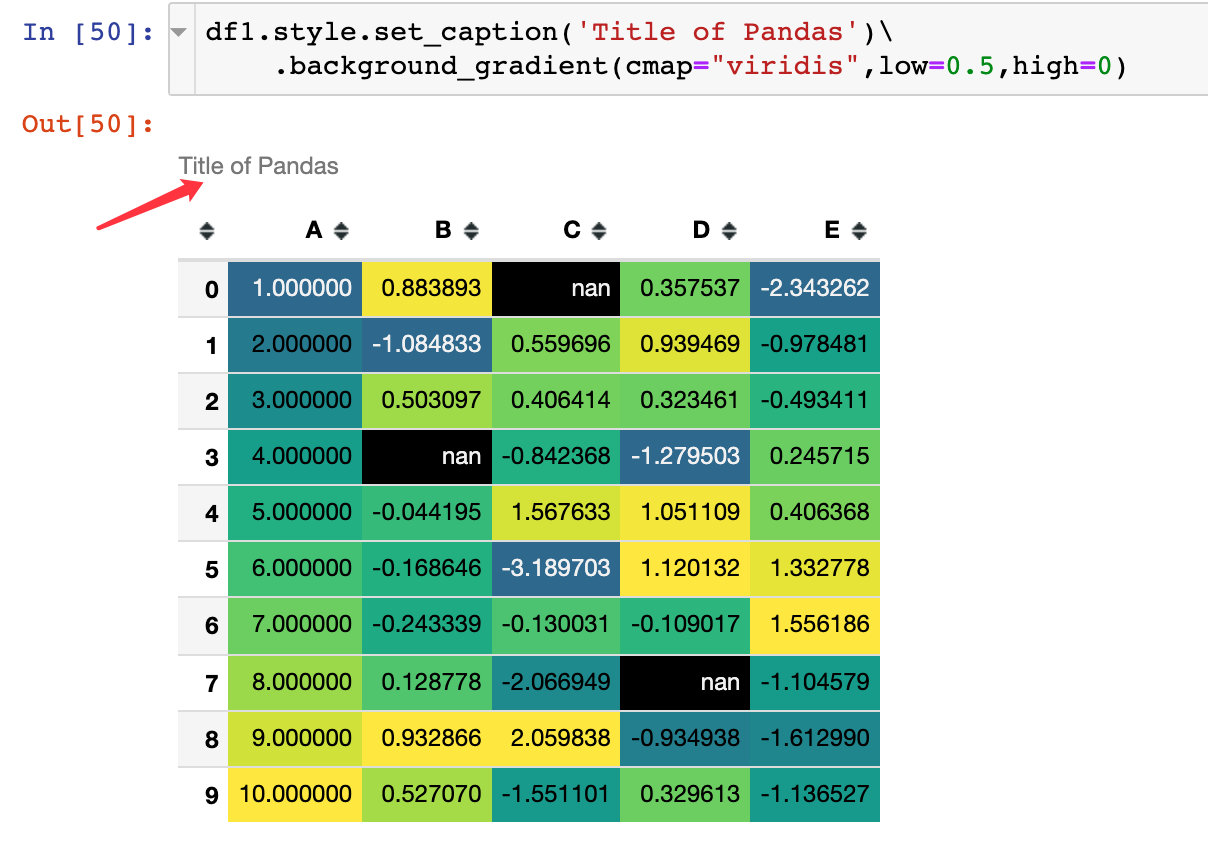
连续色谱
通过参数low和high来指定色谱的范围:
set_properties使用
### set_properties使用

df1.style.set_properties(**{"background":"yellow",  # 背景色
                           "color":"red",  # 字体
                           "border-color":"black"})  # 边界
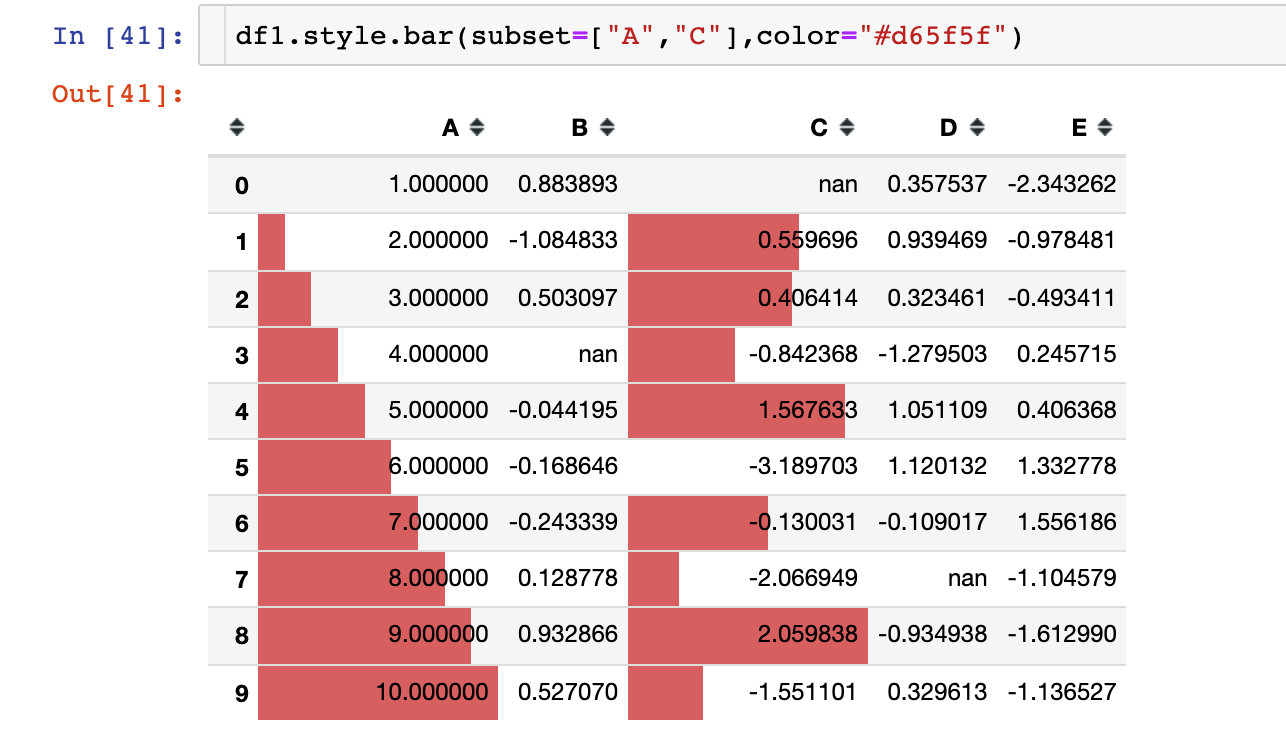
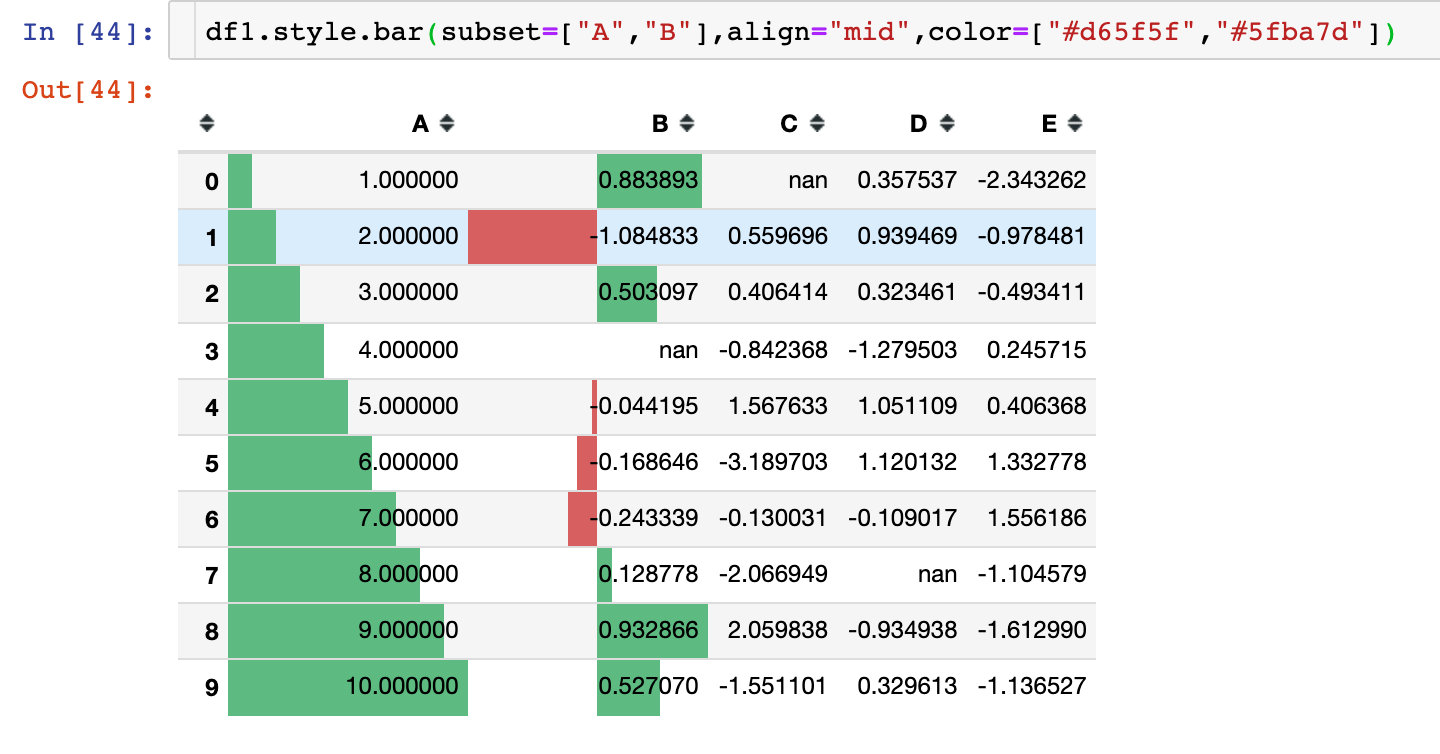
实例8:个性化条形图
默认方式
通过bar方法来操作:
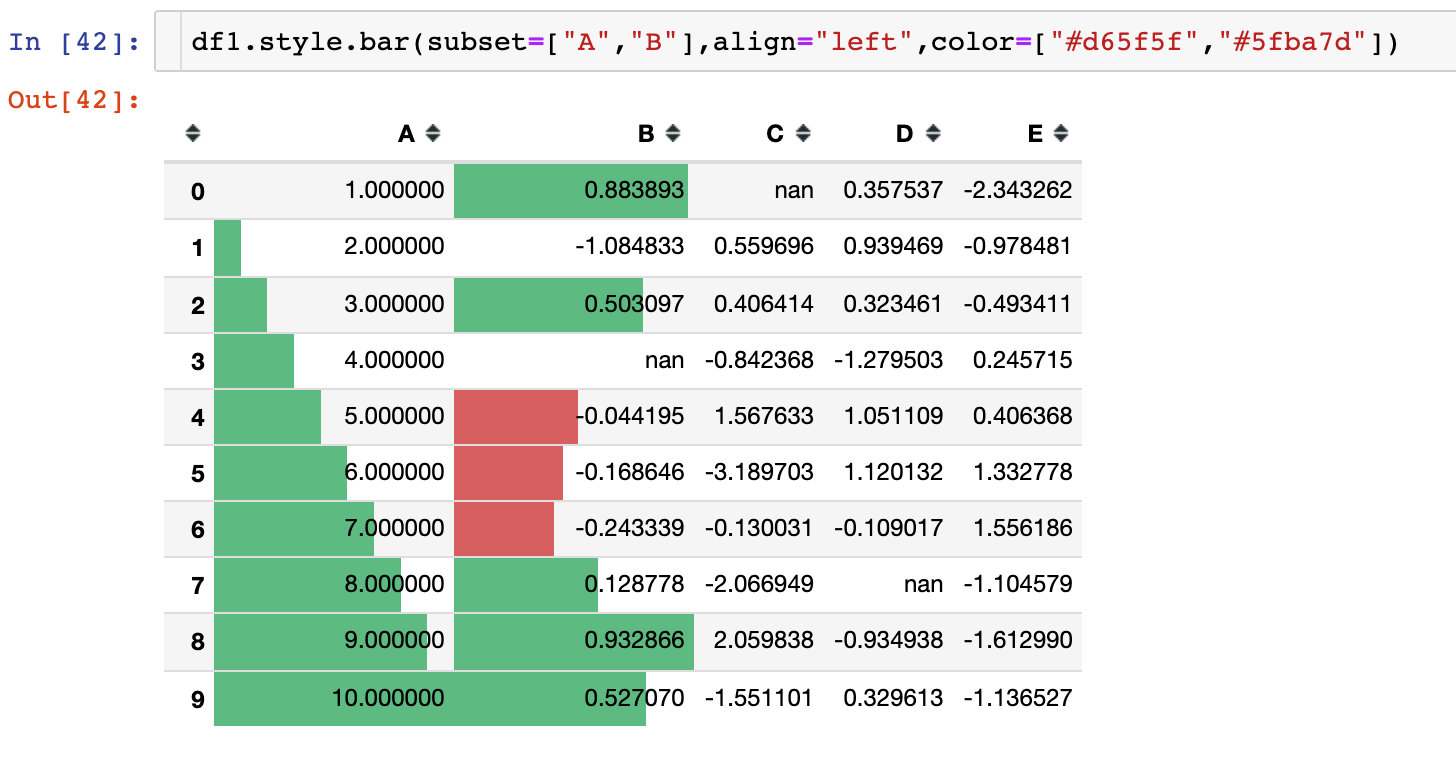
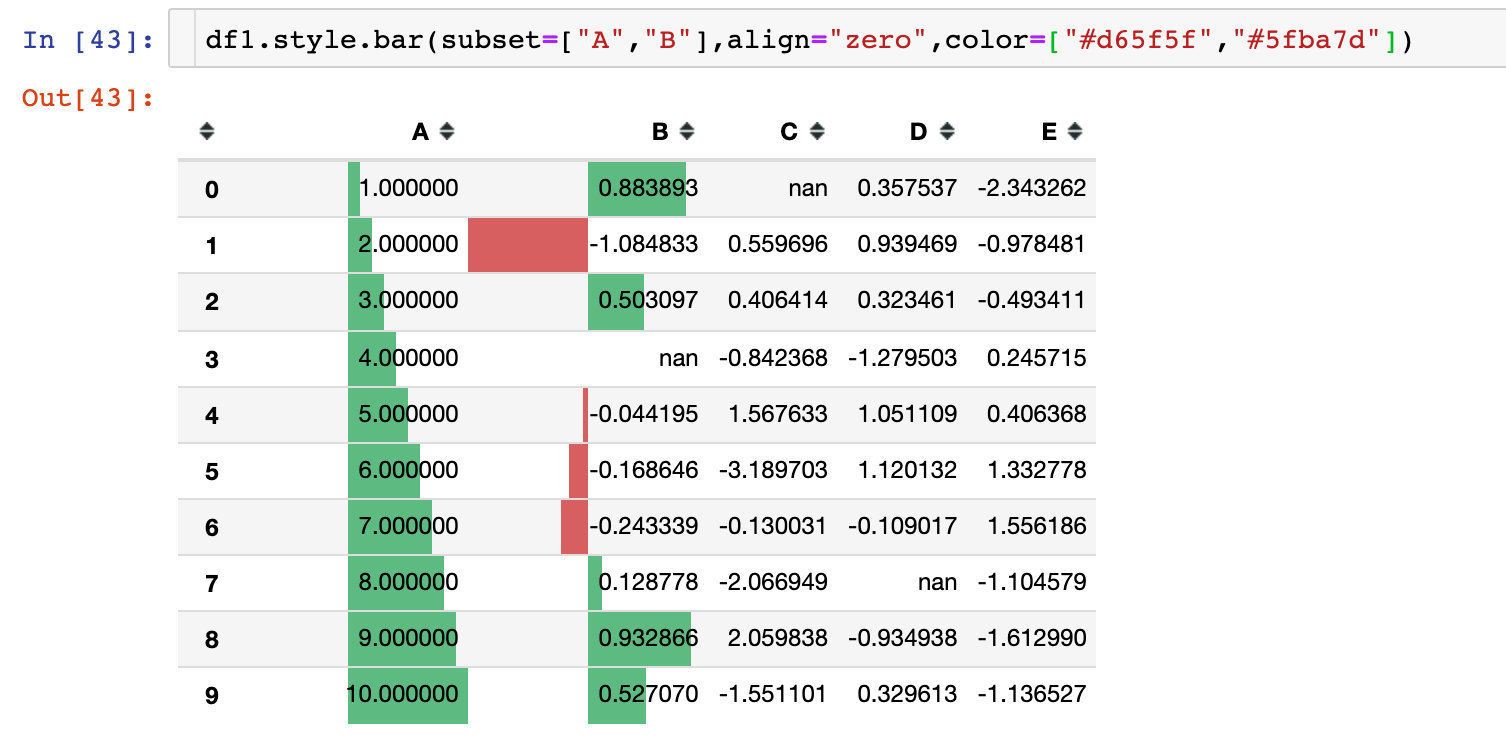
参数align
有3种对齐方式:
- left:最小值从单元格的左侧开始
- zero:零值位于单元格的中心
- mid:单元格中的中心在(max-min)/2处
实例9:样式共享
假设我们某个一个DataFrame创建了一个样式,然后想在另一个DataFrame中直接使用这个样式,该怎么做呢?
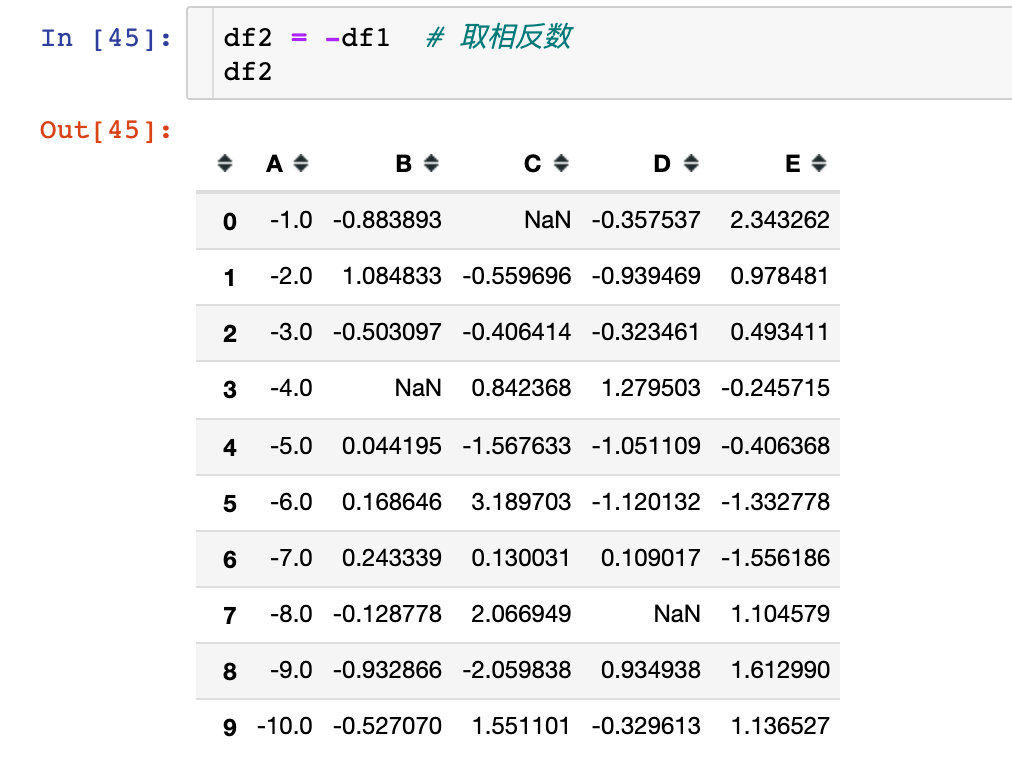
我们先创建一个样式style1:
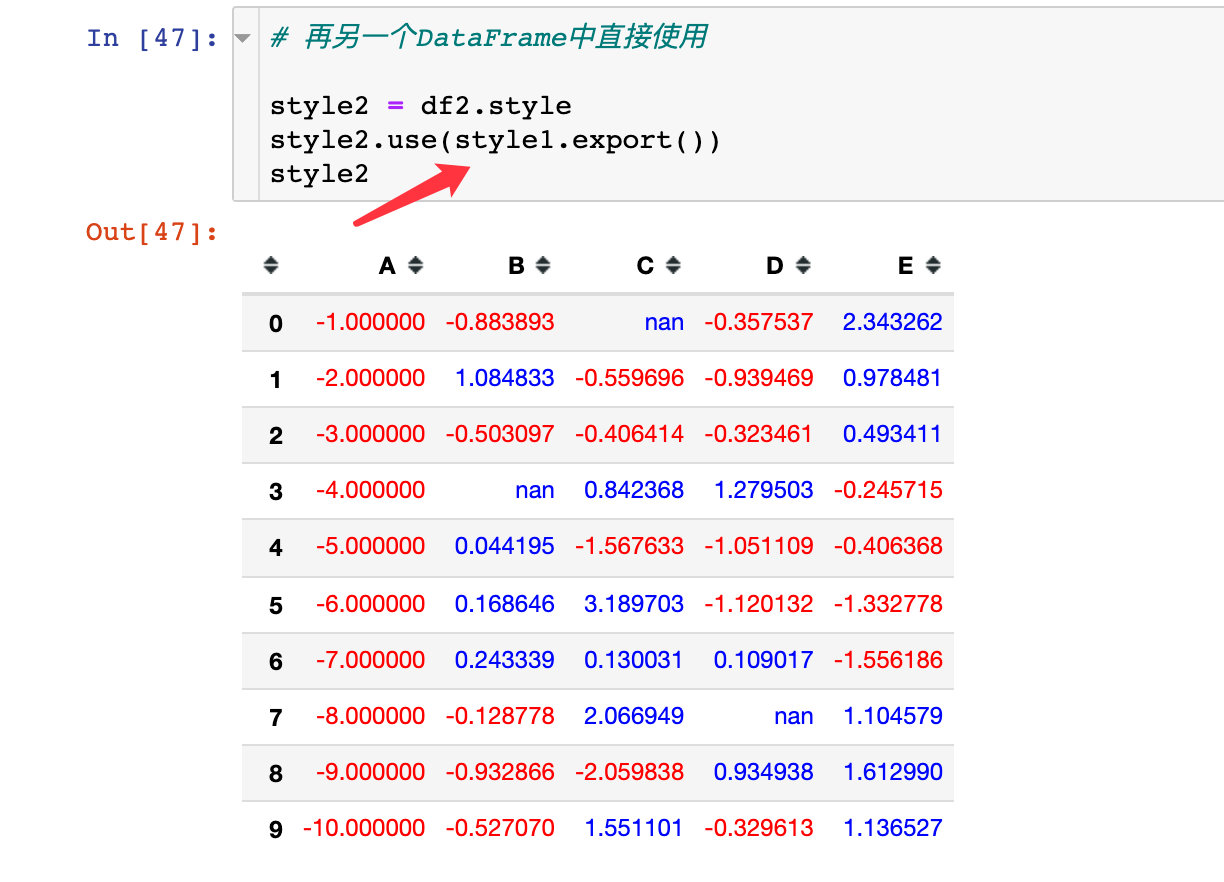
将style1运用到style2中:
实例10:设置精度set_precision
通常是给数据框中的数据指定精度(小数位):
实例11:设置标题
使用set_caption方法
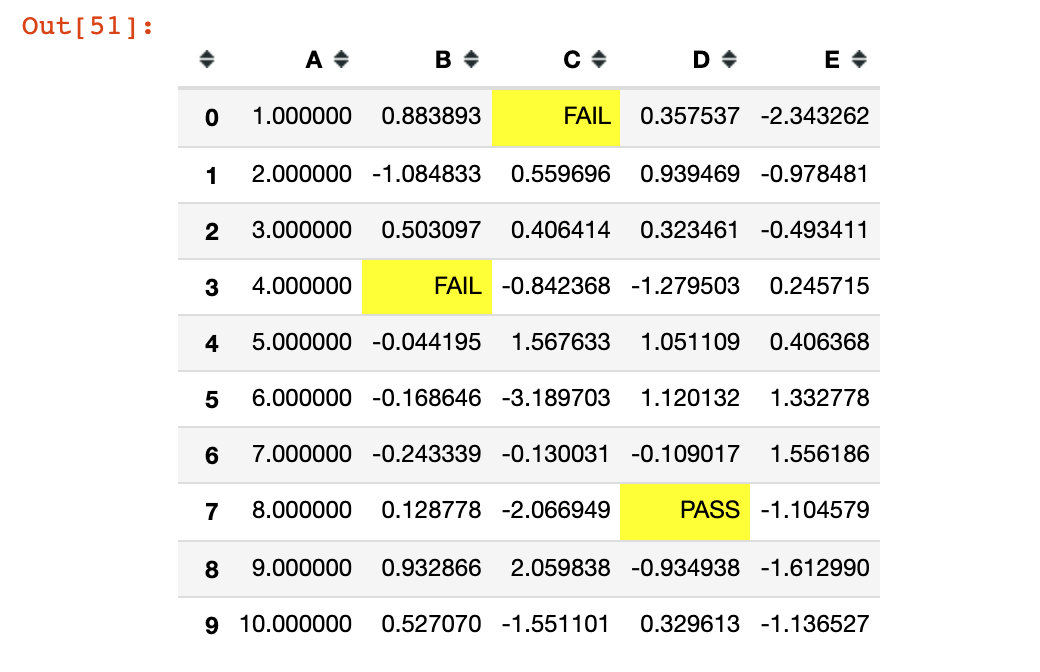
缺失值设置
使用的是set_na_rep函数:
(df1.style.set_na_rep("FAIL")
    .format(None, na_rep="PASS", subset=["D"])
    .highlight_null("yellow"))
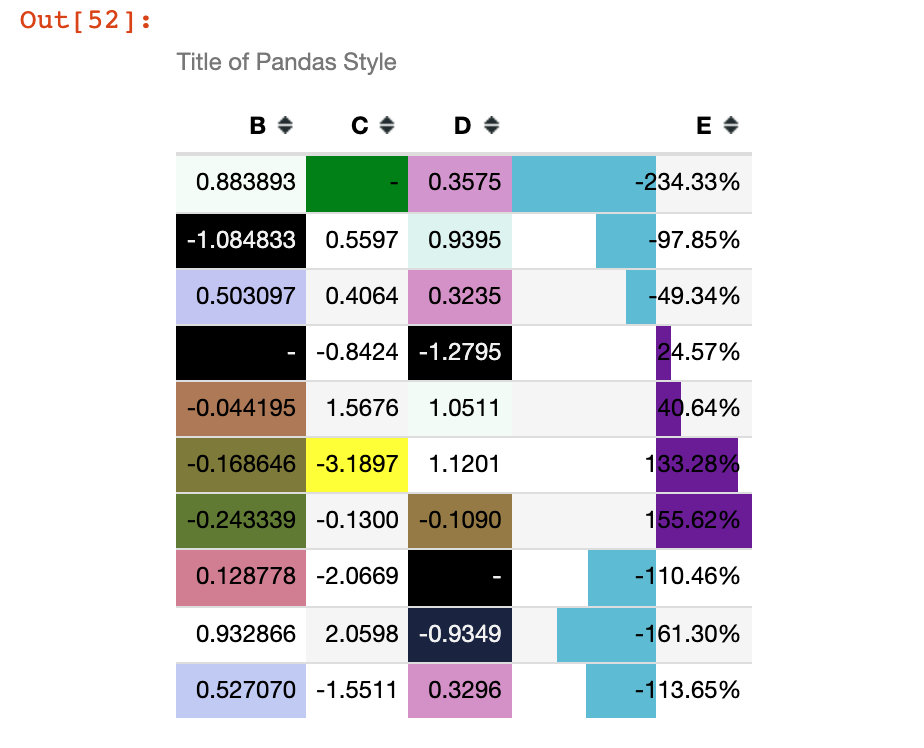
实例13:综合案例
(df1.style
  .set_na_rep('-')  # 设置空值
  .format({'C':'{:.4f}',  # 精度设置
           'D':'{:.4f}',
           'E':'{:.2%}'},na_rep="-")  # 精度和空值同时设置
  .highlight_null("green")  # 空值高亮
  .applymap(color_change,subset=['D'])  # D列使用color_change函数
  .apply(highlight_min,subset=['C'])  # C列使用highlight_min
  .background_gradient(cmap='cubehelix',subset=['B','D'])  # 背景色设置
  .bar(subset=['E'], align='mid', color=['#60BCD4','#6A1B9A'])  # 柱状图设置
  .set_caption("Title of Pandas Style")  # 标题设置
  .hide_index()  # 隐藏索引
  .hide_columns(subset=['A']))  # 隐藏A列
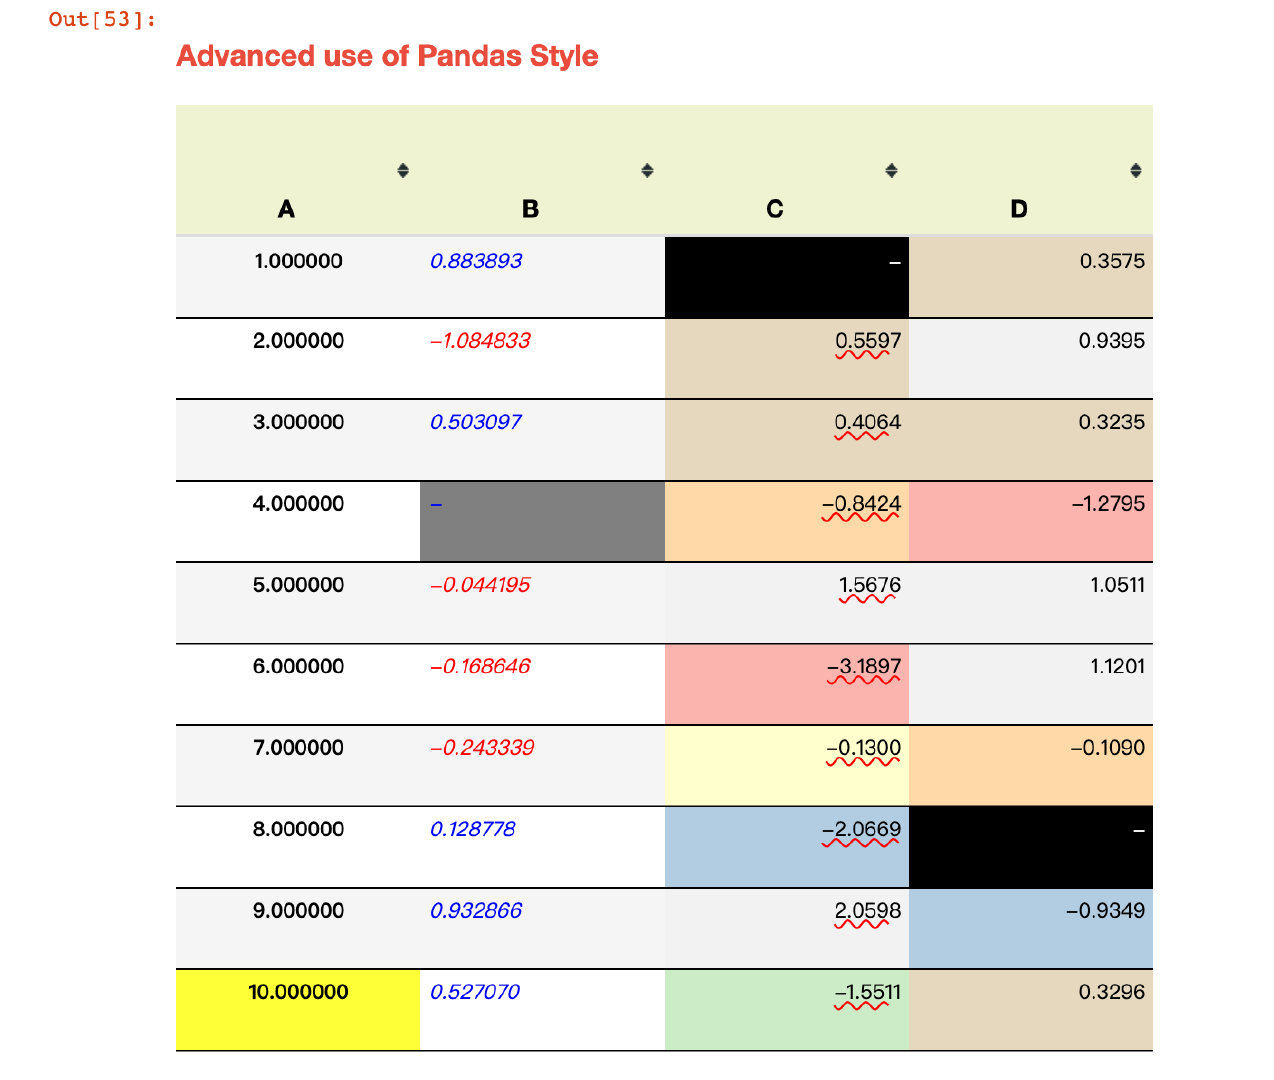
实例14:终极武器
# 版本至少需要pandas1.2.0
style1 = [
    dict(selector="th", props=[("font-size", "125%"),
                               ("text-align", "center"),
                               ("background-color", "#F0F3CF"),
                               ('width',"100px"),
                               ('height','80px')]),

    dict(selector="td", props=[("font-size", "105%"),
                               ("text-align", "right"),
                               ('width',"150px"),
                               ('height','50px')]),

    dict(selector="caption", props=[("caption-side", "top"),
                                    ("font-size","150%"),
                                    ("font-weight","bold"),
                                    ("text-align", "left"),
                                    ('height','50px'),
                                    ('color','#E74C3C')])]

style2 = {
    'A': [dict(selector='td', props=[('text-align','center'),
                                     ("font-weight","bold"),
                                     ("text-transform","capitalize")])],
    'B': [dict(selector='td', props=[('text-align','left'),
                                     ("font-style","italic")])],
    'C': [dict(selector='td', props=[('text-decoration','underline'),
                                     ('text-decoration-color','red'),
                                     ('text-decoration-style','wavy')])]}
# 链式调用各种设置方法
(df1.style
  .set_na_rep('-')  # 整体空值
  .format({'C':'{:.4f}','D':'{:.4f}','E':'{:.2%}'},na_rep="-")  # 精度
  .highlight_null("gray")  # 高亮空值
  .applymap(color_change,subset=['B']).highlight_max(subset=['A'])  # color_change函数和最大值高亮
  .background_gradient(cmap='Pastel1',subset=['C','D'])  #  背景
  .bar(subset=['E'], align='mid', color=['#90BCD4','#6A1B9A'])  # 柱状
  .set_caption("Advanced use of Pandas Style")  # 标题
 	.hide_index()  # 隐藏索引
  .hide_columns(subset=['E'])  # 隐藏E列
  .set_table_styles(style1).set_table_styles(style2,overwrite=False)  # 样式传递
  .set_properties(**{'font-family': 'Microsoft Yahei','border-collapse': 'collapse',  # 属性设置
                     'border-top': '1px solid black','border-bottom': '1px solid black'}))
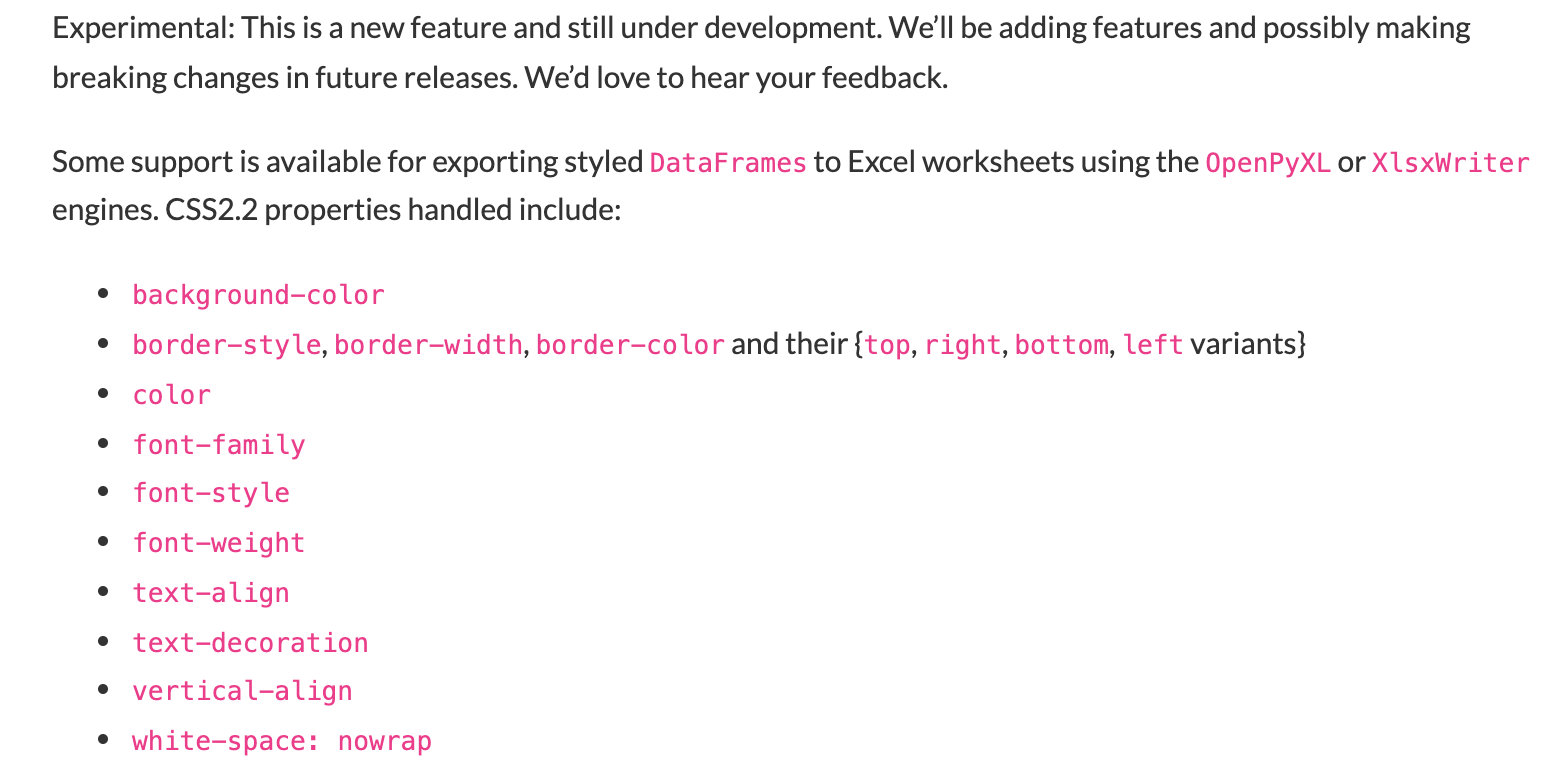
输出到Excel
这是一个还在开发阶段的功能,将DataFrame使用openyxl或者xlswriter作为引擎导出到Excel表格中,官网是这样说的:
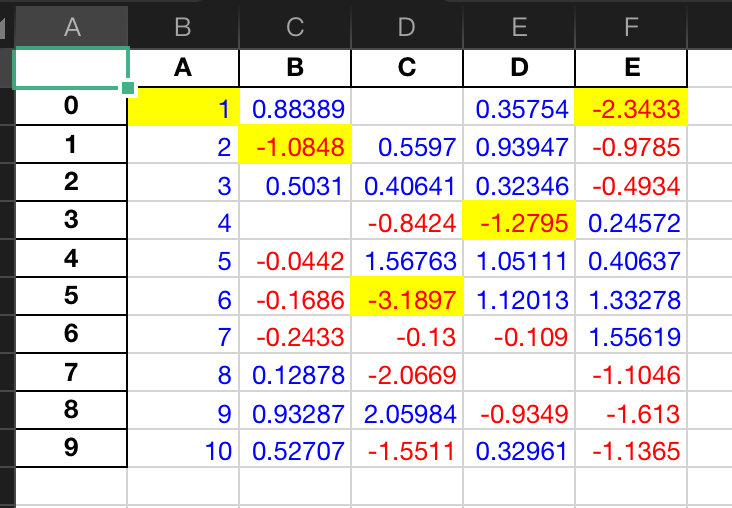
在这里看一个简单的案例:
(df1.style
   .applymap(color_change)  # 正负改变颜色
   .apply(highlight_min)  # 高亮最小值
   .to_excel('styled.xlsx', engine='openpyxl'))
如果我们不想要索引号,添加index=False:
(df1.style
   .applymap(color_change)  # 正负改变颜色
   .apply(highlight_min)  # 高亮最小值
   .to_excel('styled.xlsx', engine='openpyxl', index=False))