Matplotlib绘图示例
1. 绘制线形图
import numpy as np
import matplotlib.pyplot as plt
# 导入字体属性模块 font_manager
from matplotlib.font_manager import FontProperties

x = np.linspace(-2, 2, 100)
y = x**2
z = np.sqrt(4-x**2)

# 字体配置:路径
font = FontProperties(fname='C:/Windows/Fonts/STZHONGS.TTF')

# 打开绘图窗口,figsize配置图像窗口大小4×4
plt.figure(figsize=(4, 4))
# label:图例名称,color:线颜色,linewidth:线宽度
plt.plot(x, y, label='$y=^2$', color='red', linewidth=2)
plt.plot(x, z, 'b--', label='$x^2+y^2=4$')
plt.plot(x, -z, 'y--', label='$x^2+y^2=4$')
# 设置横坐标名称
plt.xlabel('x轴', fontproperties=font)
plt.ylabel('y轴', fontproperties=font)
# 设置标题名称
plt.title('线形图', fontproperties=font)
# 设置坐标范围
plt.xlim(-5, 5)
plt.ylim(-5, 5)
# 绘制图例
plt.legend()
# 绘制图像网格
plt.grid()
# 保存图像:图像名称,图像格式,图像分辨率
plt.savefig('pyplot.png', format='png', dpi=500)
# 显示图像
plt.show()
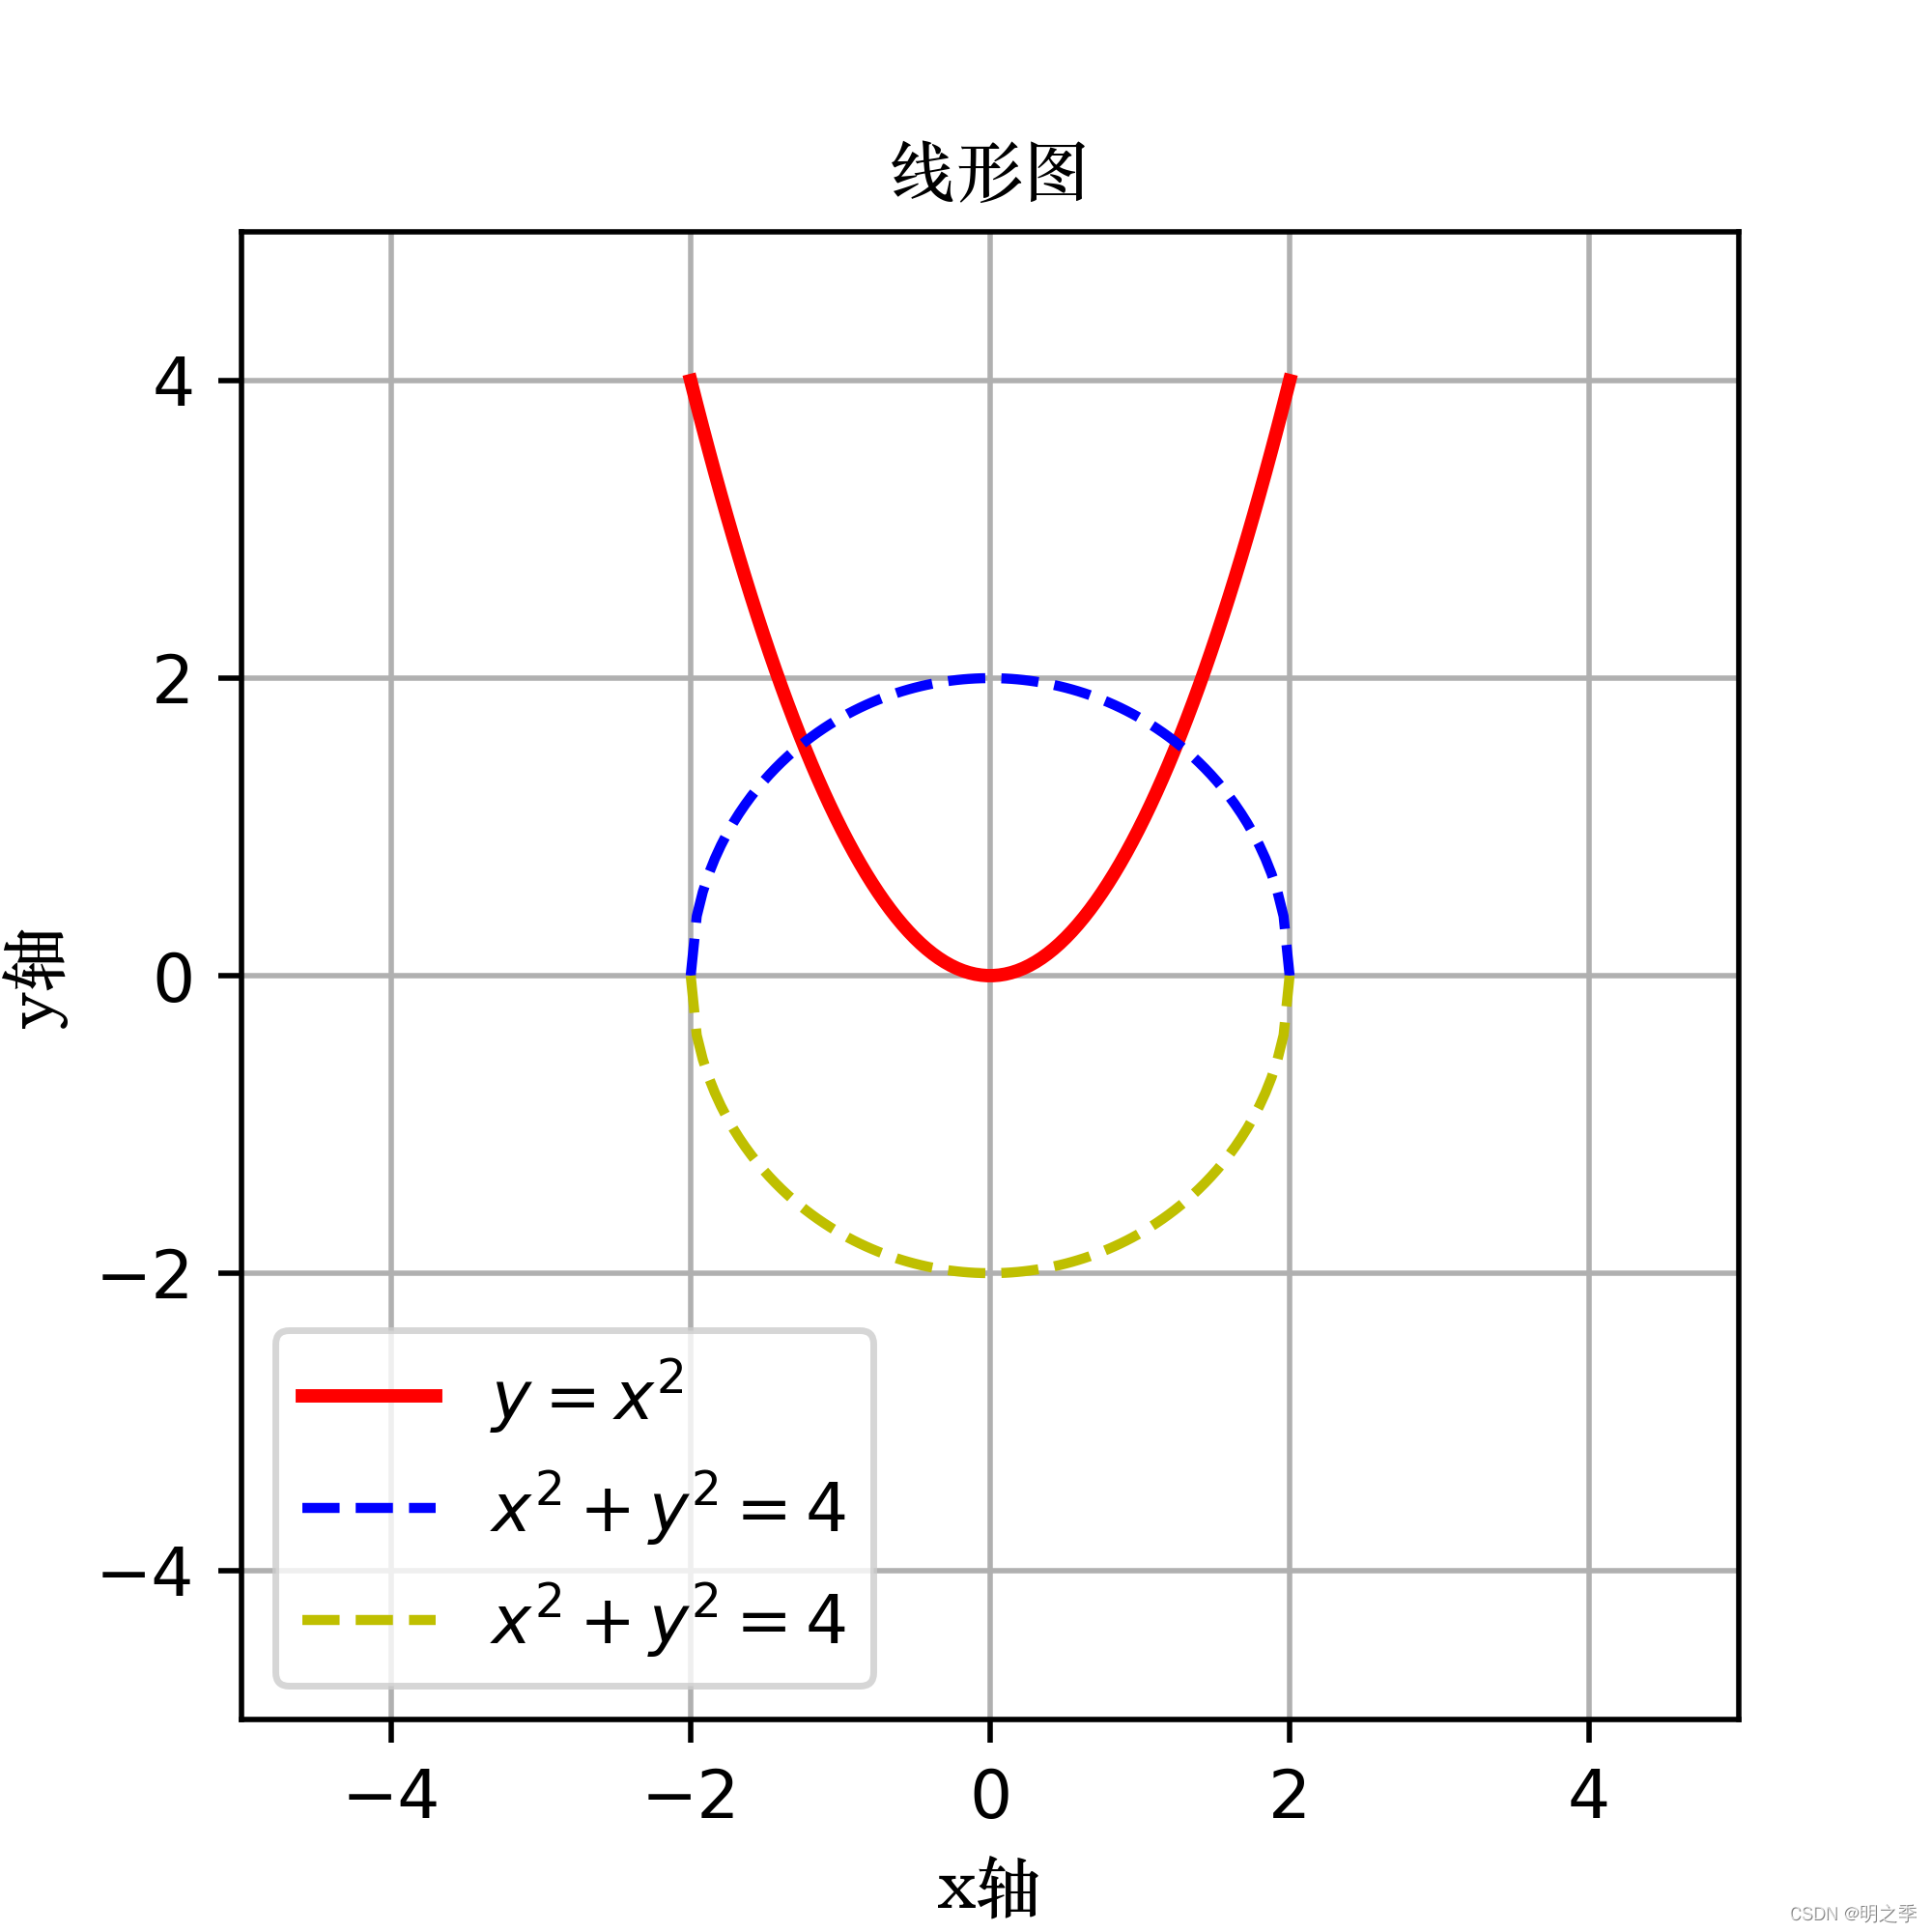
线形图绘制结果如下图所示。

2. 绘制坐标轴箭头图像
Matplotlib绘制坐标轴一般没有箭头,只有坐标度,为了满足部分带箭头坐标轴的需要,代码如下。
import matplotlib.pyplot as plt
# 导入坐标处理模块
import mpl_toolkits.axisartist as axisartist
import numpy as np

# 新建绘图区
fig = plt.figure(figsize=(6, 6))
# 坐标配置
ax = axisartist.Subplot(fig, 111)
# 添加坐标
fig.add_axes(ax)
# 隐藏坐标轴
ax.axis[:].set_visible(False)
# 添加坐标轴
ax.axis['x'] = ax.new_floating_axis(0, 0)
ax.axis['y'] = ax.new_floating_axis(1, 0)
# x、y轴添加箭头
ax.axis['x'].set_axisline_style('-|>', size=1.0)
ax.axis['y'].set_axisline_style('-|>', size=1.0)
# 设置坐标轴刻度显示方向
ax.axis['x'].set_axis_direction('top')
ax.axis['y'].set_axis_direction('right')
# 设置坐标尺寸
plt.xlim(-10, 10)
plt.ylim(-0.1, 1.2)
# 生成x轴(横轴)数据
x = np.arange(-10, 10, 0.1)
y = 1/(1+np.exp(-x))
plt.plot(x, y, label=r'$sigmoid=\frac{1}{1+e^{-x}}$', c='r')
# 开启图例并绘制
plt.legend()
# 保存图像
plt.savefig('sigmoid.png', format='png', dpi=500)
plt.show()
通过添加新坐标轴,隐藏Matplotlib默认坐标轴,设置新坐标轴的箭头形状,绘制出带箭头的坐标轴。

参考资料:深度学习实战-基于TensorFlow2.0的人工智能开发应用