数字图像与机器视觉基础学习记录
(一)位图简介
计算机能以位图和矢量图格式显示图像。
1.位图(Bitmap):
图像又称点阵图或光栅图,它使用我们称为像素(象素,Pixel)的一格一格的小点来描述图像。计算机屏幕其实就是一张包含大量像素点的网格。当我们把位图放大时,每一个像素小点看上去就像是一个个马赛克色块。
2.矢量图(Vector)
使用直线和曲线来描述图形,这些图形的元素是一些点、线、矩形、多边形、圆和弧线等等,它们都是通过数学公式计算获得的。
位图和矢量图最简单的区别就是:矢量图可以无限放大,而且不会失真;而位图则不能。
像Photoshop(PS)这样主要用于处理位图的软件,我们称之为图像处理软件;专门处理矢量图的软件,我们称之为图形设计软件,例如Adobe Illustrator,CorelDRAW,Flash MX等。
3BMP位图文件
常见的图像文件格式有:BMP、JPG(JPE,JPEG)、GIF等。
BMP图像文件(Bitmap-File)格式是Windows采用的图像文件存储格式,在Windows环境下运行的所有图像处理软件都支持这种格式。Windows 3.0以后的BMP文件都是指设备无关位图(DIB,device-independent bitmap)。BMP位图文件默认的文件扩展名是.BMP,有时它也会以.DIB或.RLE作扩展名。
4BMP文件结构
BMP文件由4部分组成:
位图文件头(bitmap-file header)
位图信息头(bitmap-informationheader)
颜色表(color table)
颜色点阵数据(bits data)
24位真彩色位图没有颜色表,所以只有1、2、4这三部分。
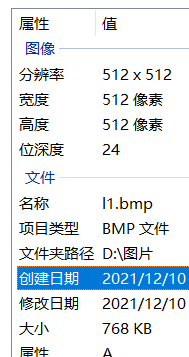
看图像属性,位深度,如果是24,就说明图片是24位真彩色
如下所示图片,即为24位位图。
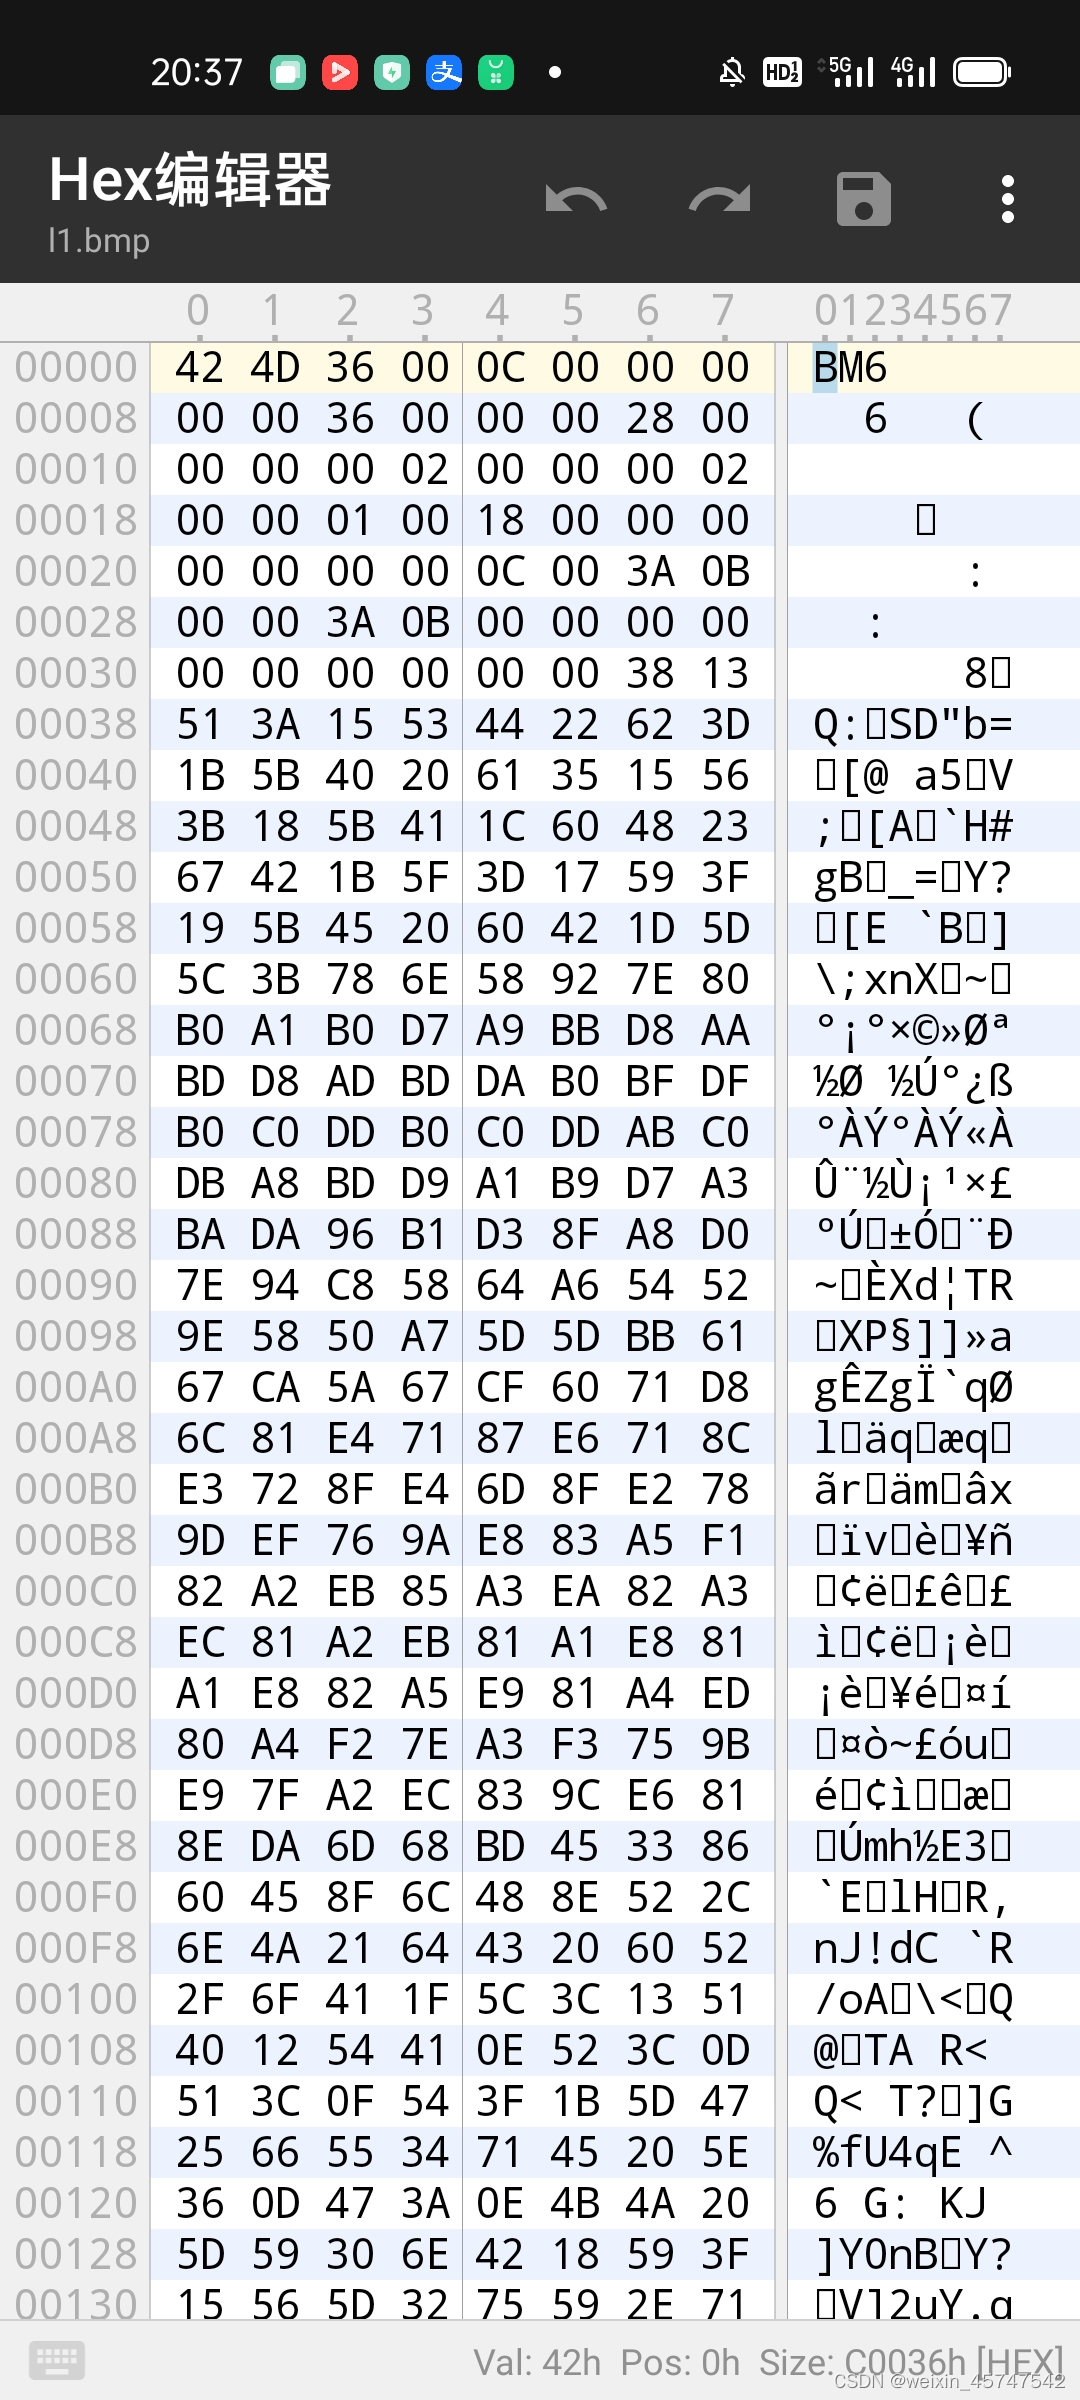
使用16进制编辑器打开文件,文件内容如下所示
5不同图片格式的压缩比
1.将图片分别保存为BMP、JPG、GIF、PNG格式
因为BMP不是压缩的,所以以它为基准
bmp 768kb
jpg 74.3kb
png 451kb
gif 180kb
可以看出,jpg格式压缩比最高
图片处理编程
1.奇异函数分解(SDV)
代码如下
import numpy as np
import os
from PIL import Image
import matplotlib.pyplot as plt
import matplotlib as mpl
from pprint import pprint
def restore1(sigma, u, v, K):  # 奇异值、左特征向量、右特征向量
    m = len(u)
    n = len(v[0])
    a = np.zeros((m, n))
    for k in range(K):
        uk = u[:, k].reshape(m, 1)
        vk = v[k].reshape(1, n)
        a += sigma[k] * np.dot(uk, vk)
    a[a < 0] = 0
    a[a > 255] = 255
    # a = a.clip(0, 255)
    return np.rint(a).astype('uint8')
def restore2(sigma, u, v, K):  # 奇异值、左特征向量、右特征向量
    m = len(u)
    n = len(v[0])
    a = np.zeros((m, n))
    for k in range(K+1):
        for i in range(m):
            a[i] += sigma[k] * u[i][k] * v[k]
    a[a < 0] = 0
    a[a > 255] = 255
    return np.rint(a).astype('uint8')
if __name__ == "__main__":
    A = Image.open("1.jpg", 'r')
    print(A)
    output_path = r'./SVD_Output'
    if not os.path.exists(output_path):
        os.mkdir(output_path)
    a = np.array(A)
    print(a.shape)
    K = 50
    u_r, sigma_r, v_r = np.linalg.svd(a[:, :, 0])
    u_g, sigma_g, v_g = np.linalg.svd(a[:, :, 1])
    u_b, sigma_b, v_b = np.linalg.svd(a[:, :, 2])
    plt.figure(figsize=(11, 9), facecolor='w')
    mpl.rcParams['font.sans-serif'] = ['simHei']
    mpl.rcParams['axes.unicode_minus'] = False
    print("****************************************")
    for k in range(1, K+1):
        R = restore1(sigma_r, u_r, v_r, k)
        G = restore1(sigma_g, u_g, v_g, k)
        B = restore1(sigma_b, u_b, v_b, k)
        I = np.stack((R, G, B), axis=2)
        Image.fromarray(I).save('%s\\svd_%d.png' % (output_path, k))
        if k in(10,20,30,40,50):
            plt.subplot(3, 4, int(k/10))
            plt.imshow(I)
            plt.axis('off')
            plt.title('奇异值个数:%d' % k)
    plt.suptitle('SVD与图像分解', fontsize=20)
    plt.tight_layout(0.3, rect=(0, 0, 1, 0.92))
    plt.show()
运行结果如下
<PIL.JpegImagePlugin.JpegImageFile image mode=RGB size=600x400 at 0x221181F18B0>
(400, 600, 3)
****************************************


D:\Temp/ipykernel_8264/619670637.py:57: MatplotlibDeprecationWarning: Passing the pad parameter of tight_layout() positionally is deprecated since Matplotlib 3.3; the parameter will become keyword-only two minor releases later.
  plt.tight_layout(0.3, rect=(0, 0, 1, 0.92))
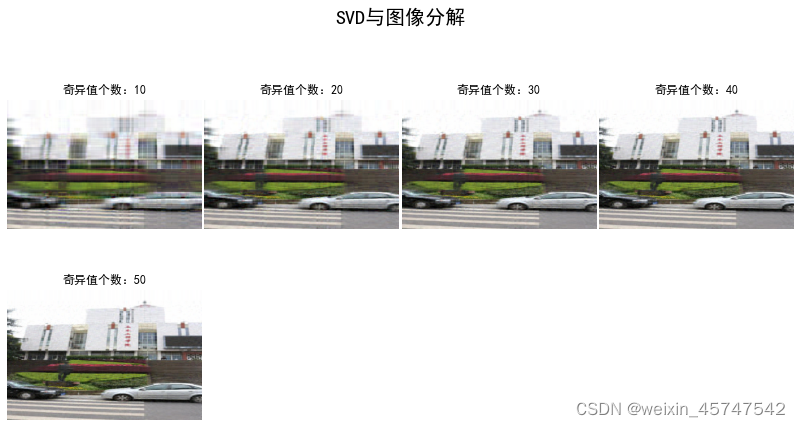
可以看出,特征值(奇异值)越多,还原出的图像越接近原图。
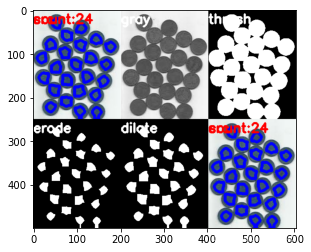
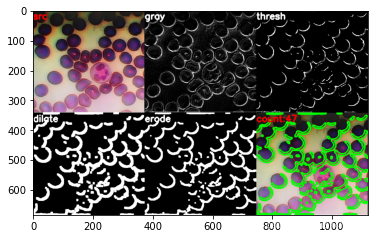
2.用图像的开闭运算(腐蚀-膨胀),检测出2个样本图像中硬币、细胞的个数
硬币:
相关包及图像同窗口显示
import cv2
import numpy as np
import matplotlib.pyplot as plt
def stackImages(scale, imgArray):
    """
        将多张图像压入同一个窗口显示
        :param scale:float类型,输出图像显示百分比,控制缩放比例,0.5=图像分辨率缩小一半
        :param imgArray:元组嵌套列表,需要排列的图像矩阵
        :return:输出图像
    """
    rows = len(imgArray)
    cols = len(imgArray[0])
    rowsAvailable = isinstance(imgArray[0], list)
    width = imgArray[0][0].shape[1]
    height = imgArray[0][0].shape[0]
    if rowsAvailable:
        for x in range(0, rows):
            for y in range(0, cols):
                if imgArray[x][y].shape[:2] == imgArray[0][0].shape[:2]:
                    imgArray[x][y] = cv2.resize(imgArray[x][y], (0, 0), None, scale, scale)
                else:
                    imgArray[x][y] = cv2.resize(imgArray[x][y], (imgArray[0][0].shape[1], imgArray[0][0].shape[0]),
                                                None, scale, scale)
                if len(imgArray[x][y].shape) == 2: imgArray[x][y] = cv2.cvtColor(imgArray[x][y], cv2.COLOR_GRAY2BGR)
        imageBlank = np.zeros((height, width, 3), np.uint8)
        hor = [imageBlank] * rows
        hor_con = [imageBlank] * rows
        for x in range(0, rows):
            hor[x] = np.hstack(imgArray[x])
        ver = np.vstack(hor)
    else:
        for x in range(0, rows):
            if imgArray[x].shape[:2] == imgArray[0].shape[:2]:
                imgArray[x] = cv2.resize(imgArray[x], (0, 0), None, scale, scale)
            else:
                imgArray[x] = cv2.resize(imgArray[x], (imgArray[0].shape[1], imgArray[0].shape[0]), None, scale, scale)
            if len(imgArray[x].shape) == 2: imgArray[x] = cv2.cvtColor(imgArray[x], cv2.COLOR_GRAY2BGR)
        hor = np.hstack(imgArray)
        ver = hor
    return ver
图像处理
#读取图片
src = cv2.imread("D:\pictures\Saved Pictures\l3.jpg")
img = src

#灰度
img_1 = cv2.cvtColor(img, cv2.COLOR_BGR2GRAY)

#二值化
ret, img_2 = cv2.threshold(img_1, 127, 255, cv2.THRESH_BINARY_INV + cv2.THRESH_OTSU)

#腐蚀(腐蚀主要为了把每个硬币区分开。过大会造成缺失,过低会无法区分开。参数可以自己设置以达到合适。)
kernel = np.ones((17, 17), int)
img_3 = cv2.erode(img_2, kernel, iterations=1)

#膨胀(膨胀到合适的值,这样每一个白色区域就是一个硬币。)
kernel = np.ones((3, 3), int)
img_4 = cv2.dilate(img_3, kernel, iterations=1)

#找到硬币中心
contours, hierarchy = cv2.findContours(img_4, cv2.RETR_EXTERNAL, cv2.CHAIN_APPROX_NONE)[-2:]

#标识硬币
cv2.drawContours(img, contours, -1, (0, 0, 255), 5)

#显示图片
cv2.putText(img, "count:{}".format(len(contours)), (0, 30), cv2.FONT_HERSHEY_SIMPLEX, 1.0, (255, 0, 0), 3)
cv2.putText(src, "src", (0, 30), cv2.FONT_HERSHEY_SIMPLEX, 1.0, (255, 0, 0), 3)
cv2.putText(img_1, "gray", (0, 30), cv2.FONT_HERSHEY_SIMPLEX, 1.0, (255, 0, 0), 3)
cv2.putText(img_2, "thresh", (0, 30), cv2.FONT_HERSHEY_SIMPLEX, 1.0, (255, 0, 0), 3)
cv2.putText(img_3, "erode", (0, 30), cv2.FONT_HERSHEY_SIMPLEX, 1.0, (255, 0, 0), 3)
cv2.putText(img_4, "dilate", (0, 30), cv2.FONT_HERSHEY_SIMPLEX, 1.0, (255, 0, 0), 3)
imgStack = stackImages(1, ([src, img_1, img_2], [img_3, img_4, img]))
plt.imshow(imgStack)
<matplotlib.image.AxesImage at 0x27a5a03ad90>
细胞:
import cv2
import numpy as np

def stackImages(scale, imgArray):
    """
        将多张图像压入同一个窗口显示
        :param scale:float类型,输出图像显示百分比,控制缩放比例,0.5=图像分辨率缩小一半
        :param imgArray:元组嵌套列表,需要排列的图像矩阵
        :return:输出图像
    """
    rows = len(imgArray)
    cols = len(imgArray[0])
    rowsAvailable = isinstance(imgArray[0], list)
    width = imgArray[0][0].shape[1]
    height = imgArray[0][0].shape[0]
    if rowsAvailable:
        for x in range(0, rows):
            for y in range(0, cols):
                if imgArray[x][y].shape[:2] == imgArray[0][0].shape[:2]:
                    imgArray[x][y] = cv2.resize(imgArray[x][y], (0, 0), None, scale, scale)
                else:
                    imgArray[x][y] = cv2.resize(imgArray[x][y], (imgArray[0][0].shape[1], imgArray[0][0].shape[0]),
                                                None, scale, scale)
                if len(imgArray[x][y].shape) == 2: imgArray[x][y] = cv2.cvtColor(imgArray[x][y], cv2.COLOR_GRAY2BGR)
        imageBlank = np.zeros((height, width, 3), np.uint8)
        hor = [imageBlank] * rows
        hor_con = [imageBlank] * rows
        for x in range(0, rows):
            hor[x] = np.hstack(imgArray[x])
        ver = np.vstack(hor)
    else:
        for x in range(0, rows):
            if imgArray[x].shape[:2] == imgArray[0].shape[:2]:
                imgArray[x] = cv2.resize(imgArray[x], (0, 0), None, scale, scale)
            else:
                imgArray[x] = cv2.resize(imgArray[x], (imgArray[0].shape[1], imgArray[0].shape[0]), None, scale, scale)
            if len(imgArray[x].shape) == 2: imgArray[x] = cv2.cvtColor(imgArray[x], cv2.COLOR_GRAY2BGR)
        hor = np.hstack(imgArray)
        ver = hor
    return ver


#读取图片
src = cv2.imread("D:\pictures\Saved Pictures\l2.png")
img = src.copy()

#转化
img_1 = cv2.cvtColor(img, cv2.COLOR_BGR2GRAY)
img_1 = cv2.GaussianBlur(img_1,(3,3),0)
temp = cv2.Sobel(img_1,-1,1,0,3)
temp1 = cv2.Sobel(img_1,-1,0,1,3)
ty = cv2.convertScaleAbs(temp)
tx = cv2.convertScaleAbs(temp1)
img_1 = tx + ty
#二值化
ret, img_2 = cv2.threshold(img_1, 127, 255, cv2.THRESH_BINARY_INV)
img_2 = cv2.bitwise_not(img_2)

#膨胀
kernel = np.ones((7,7), int)
img_3 = cv2.dilate(img_2, kernel, iterations=1)
#腐蚀
kernel = np.ones((3, 3), int)
img_4 = cv2.erode(img_3, kernel, iterations=1)


contours, hierarchy = cv2.findContours(img_4, cv2.RETR_EXTERNAL, cv2.CHAIN_APPROX_NONE)[-2:]

cv2.drawContours(img, contours, -1, (0, 255,0), 3)

#显示图片
cv2.putText(img, "count:{}".format(len(contours)), (0, 30), cv2.FONT_HERSHEY_SIMPLEX, 1.0, (255, 0, 0), 3)
cv2.putText(src, "src", (0, 30), cv2.FONT_HERSHEY_SIMPLEX, 1.0, (255, 0, 0), 3)
cv2.putText(img_1, "gray", (0, 30), cv2.FONT_HERSHEY_SIMPLEX, 1.0, (255, 0, 0), 3)
cv2.putText(img_2, "thresh", (0, 30), cv2.FONT_HERSHEY_SIMPLEX, 1.0, (255, 0, 0), 3)
cv2.putText(img_3, "dilate", (0, 30), cv2.FONT_HERSHEY_SIMPLEX, 1.0, (255, 0, 0), 3)
cv2.putText(img_4, "erode", (0, 30), cv2.FONT_HERSHEY_SIMPLEX, 1.0, (255, 0, 0), 3)
imgStack = stackImages(1, ([src, img_1, img_2], [img_3, img_4, img]))
plt.imshow(imgStack)
<matplotlib.image.AxesImage at 0x27a5b0a64c0>
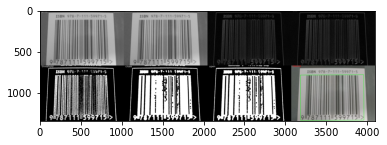
采用图像梯度、开闭、轮廓运算等,对图片中的条形码进行定位提取
代码如下
import cv2
import numpy as np
import imutils
from pyzbar import pyzbar
import matplotlib.pyplot as plt

# 定义亮度调整函数
def contrast_brightness_demo(image, c, b):
    h, w, channels = image.shape
    blank = np.zeros([h, w, channels], image.dtype)
    dst = cv2.addWeighted(image, c, blank, 1 - c, b)
    return dst
def stackImages(scale, imgArray):
    """
        将多张图像压入同一个窗口显示
        :param scale:float类型,输出图像显示百分比,控制缩放比例,0.5=图像分辨率缩小一半
        :param imgArray:元组嵌套列表,需要排列的图像矩阵
        :return:输出图像
    """
    rows = len(imgArray)
    cols = len(imgArray[0])
    rowsAvailable = isinstance(imgArray[0], list)
    width = imgArray[0][0].shape[1]
    height = imgArray[0][0].shape[0]
    if rowsAvailable:
        for x in range(0, rows):
            for y in range(0, cols):
                if imgArray[x][y].shape[:2] == imgArray[0][0].shape[:2]:
                    imgArray[x][y] = cv2.resize(imgArray[x][y], (0, 0), None, scale, scale)
                else:
                    imgArray[x][y] = cv2.resize(imgArray[x][y], (imgArray[0][0].shape[1], imgArray[0][0].shape[0]),
                                                None, scale, scale)
                if len(imgArray[x][y].shape) == 2: imgArray[x][y] = cv2.cvtColor(imgArray[x][y], cv2.COLOR_GRAY2BGR)
        imageBlank = np.zeros((height, width, 3), np.uint8)
        hor = [imageBlank] * rows
        hor_con = [imageBlank] * rows
        for x in range(0, rows):
            hor[x] = np.hstack(imgArray[x])
        ver = np.vstack(hor)
    else:
        for x in range(0, rows):
            if imgArray[x].shape[:2] == imgArray[0].shape[:2]:
                imgArray[x] = cv2.resize(imgArray[x], (0, 0), None, scale, scale)
            else:
                imgArray[x] = cv2.resize(imgArray[x], (imgArray[0].shape[1], imgArray[0].shape[0]), None, scale, scale)
            if len(imgArray[x].shape) == 2: imgArray[x] = cv2.cvtColor(imgArray[x], cv2.COLOR_GRAY2BGR)
        hor = np.hstack(imgArray)
        ver = hor
    return ver


#读取图片
src = cv2.imread("3.jpg")

img = contrast_brightness_demo(src,1.0,50)

#灰度
img_1 = cv2.cvtColor(img, cv2.COLOR_BGR2GRAY)

#高斯滤波
img_2 = cv2.GaussianBlur(img_1, (5, 5), 1)


#Sobel算子
sobel_x = cv2.Sobel(img_2, cv2.CV_64F, 1, 0, ksize=3)
sobel_y = cv2.Sobel(img_2, cv2.CV_64F, 0, 1, ksize=3)
sobel_x = cv2.convertScaleAbs(sobel_x)
sobel_y = cv2.convertScaleAbs(sobel_y)
img_3 = sobel_x + sobel_y

#均值方波
img_4 = cv2.blur(img_3, (5, 5))

#二值化
ret, img_5 = cv2.threshold(img_4, 127, 255, cv2.THRESH_BINARY + cv2.THRESH_OTSU)

#闭运算
kernel = np.ones((18, 18), int)
img_6 = cv2.morphologyEx(img_5, cv2.MORPH_CLOSE, kernel)

# x
kernel = np.ones((100,100), int)
img_7 = cv2.dilate(img_6, (3,3),iterations=5)
#img_7 = cv2.morphologyEx(img_7, cv2.MORPH_OPEN, kernel)

#绘制条形码区域
contours = cv2.findContours(img_7, cv2.RETR_EXTERNAL, cv2.CHAIN_APPROX_SIMPLE)
contours = imutils.grab_contours(contours)
c = sorted(contours, key = cv2.contourArea, reverse = True)[0]
rect = cv2.minAreaRect(c)
box = cv2.cv.BoxPoints(rect) if imutils.is_cv2() else cv2.boxPoints(rect)
box = np.int0(box)
cv2.drawContours(img, [box], -1, (0,255,0), 6)

#显示图片信息
cv2.putText(img, "results", (30, 30), cv2.FONT_HERSHEY_SIMPLEX, 2.0, (255, 0, 0), 3)
cv2.putText(img_1, "gray", (40, 40), cv2.FONT_HERSHEY_SIMPLEX, 2.0, (255, 0, 0), 3)
cv2.putText(img_2, "GaussianBlur",(40, 40), cv2.FONT_HERSHEY_SIMPLEX, 2.0, (255, 0, 0), 3)
cv2.putText(img_3, "Sobel", (40, 40), cv2.FONT_HERSHEY_SIMPLEX, 2.0, (255, 0, 0), 3)
cv2.putText(img_4, "blur", (40, 40), cv2.FONT_HERSHEY_SIMPLEX, 2.0, (255, 0, 0), 3)
cv2.putText(img_5, "threshold", (40, 40), cv2.FONT_HERSHEY_SIMPLEX, 2.0, (255, 0, 0), 3)
cv2.putText(img_6, "close", (40, 40), cv2.FONT_HERSHEY_SIMPLEX, 2.0, (255, 0, 0), 3)
cv2.putText(img_7, "open", (40, 40), cv2.FONT_HERSHEY_SIMPLEX, 2.0, (255, 0, 0), 3)

#输出条形码
barcodes = pyzbar.decode(src)
for barcode in barcodes:
    barcodeData = barcode.data.decode("utf-8")
    cv2.putText(img, barcodeData, (50, 70), cv2.FONT_HERSHEY_SIMPLEX, 1.0, (0, 255, 0), 3)

#显示所有图片
imgStack = stackImages(0.5, ([img_1, img_2,img_3,img_4],[img_5,img_6,img_7,img]))
plt.imshow(imgStack)
<matplotlib.image.AxesImage at 0x1cbba818670>
四、总结
本次实验了解了位图的原理,包括位图的文件头、信息头、颜色表他们各自的组成及位图之间的差异,以及不同图片格式的压缩比等,用编程来进行图像的处理.
五、参考资料
1. https://blog.csdn.net/aidem_brown/article/details/80500637
2. https://blog.csdn.net/weixin_46129506/article/details/121675361?spm=1001.2014.3001.5501
3. https://blog.csdn.net/qq_49296179/article/details/109597084?ops_request_misc=%257B%2522request%255Fid%2522%253A%2522163914204016780264038127%2522%252C%2522scm%2522%253A%252220140713.130102334..%2522%257D&request_id=163914204016780264038127&biz_id=0&utm_medium=distribute.pc_search_result.none-task-blog-2~all~sobaiduend~default-2-109597084.first_rank_v2_pc_rank_v29&utm_term=opencv%E8%B0%83%E8%8A%82%E5%9B%BE%E7%89%87%E4%BA%AE%E5%BA%A6&spm=1018.2226.3001.4187