【莫烦Python】Nnmpy & Pandas: https://www.bilibili.com/video/BV1Ex411L7oT
【莫烦Python】Matplotlib Python 画图教程: https://www.bilibili.com/video/BV1Jx411L7LU
Numpy 官网文档:https://www.numpy.org.cn/user/setting-up.html
Pandas 官网文档:https://www.pypandas.cn/docs/
Matplotlib 官网文档:https://www.matplotlib.org.cn/tutorials/
目录
- Numpy 介绍
- Numpy 基本属性: ndim, shape, size, dtype
- Numpy 创建矩阵: zeros, ones, empty, arange, linspace, random
- Numpy 计算: + - * / **, sin, dot, sum, max, min, mean, median, cumsum, diff, nonzero, sort, argmax, T, transpose, clip, flat
- Numpy 合并与分割: vstack, hstack, concatenate, split, array_split, vsplit, hsplit
- Numpy 拷贝: copy
- Pandas 介绍
- Pandas 多种创建方式: Series, DataFrame, date_range
- Pandas 常用属性和访问操作: dtypes, index, columns, values, describe, T, sort_index, sort_values
- Pandas 数据切片: loc, iloc
- Pandas 赋值,添加新列
- Pandas 处理缺失数据 NaN: isna, isnull, fillna, dropna
- Pandas 处理文件
- Pandas 合并: concat append
- Pandas 合并 merge
- Pandas 画图
- Matplotlib 基本使用
- Matplotlib Figure
- Matplotlib 坐标轴设置
- Matplotlib 图例 legend
- Matplotlib 添加注解
- Matplotlib 坐标轴的标签防遮挡
- Matplotlib 散点图
- Matplotlib 柱状图
- Matplotlib 等高线图
- Matplotlib 图片
- Matplotlib 3D图形
- Matplotlib 一个窗口显示多张子图 Subplot
- Matplotlib 多子图:subplot2grid、girdspec
- Matplotlib 图中图
- Matplotlib 主次坐标轴
- Matplotlib 动画 Animation
Numpy 介绍
- numpy 是基于C语言,对大量数据计算,快
- pandas 基于 numpy 再封装
Numpy 基本属性: ndim, shape, size, dtype
import numpy as np

# 列表转numpy矩阵
array = np.array([[1, 2, 3],
                  [3, 4, 5]])

print(array)  # [1, 2, 3], [3, 4, 5]]

# 维度
print(f'number of dim: {array.ndim}')  # number of dim: 2

# 各个维度的大小
print(f'shape: {array.shape}')  # shape: (2, 3)

# size: 多少个元素
print(f'size: {array.size}')  # size: 6
Numpy 创建矩阵: zeros, ones, empty, arange, linspace, random
# 从列表转化,可以指定类型
array = np.array([[1, 2, 3], [3, 4, 5]], dtype=np.int16)
print(f'type: {array.dtype}')  # type: int16

# 全0矩阵,参数为矩阵的shape
array = np.zeros([2, 3, 4])
print(array)
# [[[0. 0. 0. 0.]
#   [0. 0. 0. 0.]
#   [0. 0. 0. 0.]]
#  [[0. 0. 0. 0.]
#   [0. 0. 0. 0.]
#   [0. 0. 0. 0.]]]

# 全1矩阵
array = np.ones([1, 2, 3], dtype=np.int0)
print(array, array.dtype)
# [[[1 1 1]
#   [1 1 1]]] int64

# 空矩阵: 只分配内存但不初始化
array = np.empty([1, 2, 3,4])
print(array)

# 生成有序的矩阵: 起始(默认为0)、终止、步长(默认为1)
array = np.arange(10, 20, 2)
print(array)  # [10 12 14 16 18]

array = np.arange(12).reshape((3, 4))
print(array)
# [[ 0  1  2  3]
#  [ 4  5  6  7]
#  [ 8  9 10 11]]

# linspace: [1, 10] 分成2段,一共3个值,可以看做事等差数列
array = np.linspace(1, 10, 3)
print(array)  # [ 1.   5.5 10. ]

# 随机矩阵
array = np.random.random((2, 4))
print(array)
# [[0.70309398 0.72261462 0.66680394 0.42831447]
#  [0.80402385 0.40738157 0.59900451 0.62351528]]
Numpy 计算: + - * / **, sin, dot, sum, max, min, mean, median, cumsum, diff, nonzero, sort, argmax, T, transpose, clip, flat
import numpy as np

a = np.array([[1, 1], [0, 1]])
b = np.arange(4).reshape((2, 2))

# 对应元素操作: + - * / **
c = a - b
print(c)
# [[ 1  0]
#  [-2 -2]]

# 三角函数
c = 10 * np.sin(a)
print(c)
# [[8.41470985 8.41470985]
#  [0.         8.41470985]]

# 对应元素: < 返回一个bool列表
print(b < 3)
# [[ True  True]
#  [ True False]]

# 矩阵运算
c = np.dot(a, b)  # 相乘(叉乘) a X b
c = a.dot(b)
print(c)
# [[2 4]
#  [2 3]]

# 求和、最大最小值
print(np.sum(a))  # 3
print(np.max(a))  # 1
print(np.min(a))  # 0

# 求和、最大最小值,可以指定轴,axis 0表示列,1表示行
a = np.array([[1, 2], [3, 4]])
print(np.sum(a, axis=0))  # [4 6]
print(np.sum(a, axis=1))  # [3 7]

print(np.max(a, axis=0))  # [3 4]
print(np.max(a, axis=1))  # [2 4]

print(np.min(a, axis=0))  # [1 2]
print(np.min(a, axis=1))  # [1 3]

# 平均值
print(np.mean(a))  # 2.5
print(a.mean())  # 2.5

# 中位数
print(np.median(a))

# 逐一相加,并保留结果
print(np.cumsum(a))

# 相邻数据之差
print(np.diff(a))

# 查找非0数,返回索引
print(np.nonzero(a))

# 逐行排序
print(np.sort(a))


# 获取索引: 按一维数组的索引
print(np.argmax(a))  # 3

# 矩阵转置
print(np.transpose(a))
print(a.T)

# 过0比较器: 第一个1,所有小于1的数会换成1,第二个1,所有大于1的数会换成1
print(np.clip(a, 1, 1))

# Numpy 同索引访问值,同多维list
a = np.arange(3, 15)
print(a)
print(a[2])
# [ 3  4  5  6  7  8  9 10 11 12 13 14]
# 5

a = a.reshape((3, 4))
print(a)
print(a[2])
# [[ 3  4  5  6]
#  [ 7  8  9 10]
#  [11 12 13 14]]
# [11 12 13 14]

print(a[0][2])  # 5
print(a[0, 2])  # 5
print(a[0, :])  # [3 4 5 6]

# 打印行
for row in a:
    print(row)

# 打印列
for col in a.T:
    print(col)

# 打印单独元素
for item in a.flat:
    print(item)

# a.flat 是一个迭代器
# a.flatten() 返回一个铺平的list
print(a.flatten())  # [ 3  4  5  6  7  8  9 10 11 12 13 14]
Numpy 合并与分割: vstack, hstack, concatenate, split, array_split, vsplit, hsplit
import numpy as np

# ### Numpy array合并
a = np.array([1, 1, 1])
b = np.array([2, 2, 2])

# 上下合并 vertical stack
print(np.vstack((a, b)))
# [[1 1 1]
#  [2 2 2]]

print(a.shape, np.vstack((a, b)).shape)  # (3,) (2, 3)
# (3,) 并不是3行的意思,???
# (2, 3) 这个array中有2个小array,每个小array里有3个元素

# 左右合并 horizontal stack
print(np.hstack((a, b)))  # [1 1 1 2 2 2]

# 行向量转成列向量
print(a[:, np.newaxis])  # ???
print(np.vstack(a))  # ???
print(a.reshape(a.size, 1))
# [[1]
#  [1]
#  [1]]

print(a[np.newaxis, :])  # [[1 1 1]]

a = a[np.newaxis, :]
b = b[np.newaxis, :]
print(a, b)  # [[1 1 1]] [[2 2 2]]

# 这个合并函数是通过,axis指定合并的方向
c = np.concatenate((a, b), axis=0)
print(c)
# [[1 1 1]
#  [2 2 2]]

c = np.concatenate((a, b), axis=1)  #
print(c)  # [[1 1 1 2 2 2]]

# ### array 分割
a = np.arange(12).reshape((3, 4))
print(a)
# [[ 0  1  2  3]
#  [ 4  5  6  7]
#  [ 8  9 10 11]]

# 横向分割
# a 分成2块,按列分,竖着操作,均匀分
print(np.split(a, 2, axis=1))
# [array([[0, 1],
#        [4, 5],
#        [8, 9]]), array([[ 2,  3],
#        [ 6,  7],
#        [10, 11]])]

# 不均分: 默认,先均分,多的放到第一个里面去,也可以指定
print(np.array_split(a, 3, axis=1))
# [array([[0, 1],
#        [4, 5],
#        [8, 9]]), array([[ 2],
#        [ 6],
#        [10]]), array([[ 3],
#        [ 7],
#        [11]])]

print(np.array_split(a, (1, 2, 1), axis=1))
# [array([[0],
#        [4],
#        [8]]), array([[1],
#        [5],
#        [9]]), array([], shape=(3, 0), dtype=int64), array([[ 1,  2,  3],
#        [ 5,  6,  7],
#        [ 9, 10, 11]])]

# np.vsplit np.hsplit
print(np.vsplit(a, 3))
# [array([[0, 1, 2, 3]]), array([[4, 5, 6, 7]]), array([[ 8,  9, 10, 11]])]

print(np.hsplit(a, 2))
# [array([[0, 1],
#        [4, 5],
#        [8, 9]]), array([[ 2,  3],
#        [ 6,  7],
#        [10, 11]])]
Numpy 拷贝: copy
import numpy as np

a = np.arange(4)
b = a  # 两者指向同一数据,改变a,b也会跟着变
print(b is a)  # True

b = a.copy()  # 拷贝,a, b没有关系,会有单独副本
Pandas 介绍
- numpy是array是多维list
- pandas是字典,每一行和列可以自定义命名
- nan : no a mumber
Pandas 多种创建方式: Series, DataFrame, date_range
import numpy as np
import pandas as pd

# 从list,默认索引是0,1,2,3,类型是float64
s = pd.Series([1, 3, 6, np.nan, 44, 1])
print(s)
# 0     1.0
# 1     3.0
# 2     6.0
# 3     NaN
# 4    44.0
# 5     1.0
# dtype: float64

# 从numpy导入,矩阵这边叫DataFrame,可以设置索引
df = pd.DataFrame(np.arange(12).reshape((3, 4)))
print(df)
#    0  1   2   3
# 0  0  1   2   3
# 1  4  5   6   7
# 2  8  9  10  11

# 也可以设置索引,先创建索引,index
dates = pd.date_range('20211201', periods=6)
print(dates)
# DatetimeIndex(['2021-12-01', '2021-12-02', '2021-12-03', '2021-12-04',
#                '2021-12-05', '2021-12-06'],
#               dtype='datetime64[ns]', freq='D')

df = pd.DataFrame(np.random.rand(6, 4), index=dates,
                  columns=['a', 'b', 'c', 'd'])
print(df)
#                    a         b         c         d
# 2021-12-01  0.464341  0.785184  0.843978  0.683584
# 2021-12-02  0.090226  0.844951  0.882069  0.080591
# 2021-12-03  0.990635  0.975542  0.540292  0.199442
# 2021-12-04  0.628743  0.346208  0.559444  0.045485
# 2021-12-05  0.808089  0.799405  0.715815  0.133164
# 2021-12-06  0.814320  0.748949  0.460721  0.036809

# 自定义DataFrame,可以用字典来代替输入的值:字典的key代表列的索引,value代表这列的值
df = pd.DataFrame({
    'A': 1,
    'B': pd.Timestamp('20211201'),
    'C': pd.Series(1., index=list(range(4)), dtype='float64'),
    'D': np.array([3] * 4, dtype='int64'),
    'E': pd.Categorical(['test', 'train', 'test', 'train']),
    'F': 'foo'
})
print(df)  # 行是样本,列是特征
#    A          B    C  D      E    F
# 0  1 2021-12-01  1.0  3   test  foo
# 1  1 2021-12-01  1.0  3  train  foo
# 2  1 2021-12-01  1.0  3   test  foo
# 3  1 2021-12-01  1.0  3  train  foo
Pandas 常用属性和访问操作: dtypes, index, columns, values, describe, T, sort_index, sort_values
import numpy as np
import pandas as pd

df = = pd.DataFrame({
    'A': 1,
    'B': pd.Timestamp('20211201'),
    'C': pd.Series(1., index=list(range(4)), dtype='float64'),
    'D': np.array([3] * 4, dtype='int64'),
    'E': pd.Categorical(['test', 'train', 'test', 'train']),
    'F': 'foo'
})

# dtypes
print(df.dtypes)
# A             int64
# B    datetime64[ns]
# C           float64
# D             int64
# E          category
# F            object
# dtype: object

# index: 所有列的标序
print(df.index)
# Int64Index([0, 1, 2, 3], dtype='int64')

# columns: 所有列的名字
print(df.columns)
# Index(['A', 'B', 'C', 'D', 'E', 'F'], dtype='object')

# values: 获取所有值
print(df.values, type(df.values))
# [[1 Timestamp('2021-12-01 00:00:00') 1.0 3 'test' 'foo']
#  [1 Timestamp('2021-12-01 00:00:00') 1.0 3 'train' 'foo']
#  [1 Timestamp('2021-12-01 00:00:00') 1.0 3 'test' 'foo']
#  [1 Timestamp('2021-12-01 00:00:00') 1.0 3 'train' 'foo']] <class 'numpy.ndarray'>

# describ(): 描述变量(只针对数字形式的数据)
print(df.describe())
#          A    C    D
# count  4.0  4.0  4.0
# mean   1.0  1.0  3.0
# std    0.0  0.0  0.0
# min    1.0  1.0  3.0
# 25%    1.0  1.0  3.0
# 50%    1.0  1.0  3.0
# 75%    1.0  1.0  3.0
# max    1.0  1.0  3.0

# 当做矩阵翻转
print(df.T)
#                      0                    1                    2                    3
# A                    1                    1                    1                    1
# B  2021-12-01 00:00:00  2021-12-01 00:00:00  2021-12-01 00:00:00  2021-12-01 00:00:00
# C                  1.0                  1.0                  1.0                  1.0
# D                    3                    3                    3                    3
# E                 test                train                 test                train
# F                  foo                  foo                  foo                  foo

# 排序,是针对索引进行排序
# axis=1 对列索引排序,False表示倒序
print(df.sort_index(axis=1, ascending=False))
#      F      E  D    C          B  A
# 0  foo   test  3  1.0 2021-12-01  1
# 1  foo  train  3  1.0 2021-12-01  1
# 2  foo   test  3  1.0 2021-12-01  1
# 3  foo  train  3  1.0 2021-12-01  1

# axis=0 对行索引排序,False表示倒序
print(df.sort_index(axis=0, ascending=False))
#    A          B    C  D      E    F
# 3  1 2021-12-01  1.0  3  train  foo
# 2  1 2021-12-01  1.0  3   test  foo
# 1  1 2021-12-01  1.0  3  train  foo
# 0  1 2021-12-01  1.0  3   test  foo

# 根据某一列的值进行排序
print(df.sort_values(by='E'))
#    A          B    C  D      E    F
# 0  1 2021-12-01  1.0  3   test  foo
# 2  1 2021-12-01  1.0  3   test  foo
# 1  1 2021-12-01  1.0  3  train  foo
# 3  1 2021-12-01  1.0  3  train  foo
Pandas 数据切片: loc, iloc
import numpy as np
import pandas as pd
dates = pd.date_range('20211201', periods=6)
df = pd.DataFrame(np.arange(24).reshape((6, 4)),
                  index=dates, columns=['A', 'B', 'C', 'D'])
print(df)
#              A   B   C   D
# 2021-12-01   0   1   2   3
# 2021-12-02   4   5   6   7
# 2021-12-03   8   9  10  11
# 2021-12-04  12  13  14  15
# 2021-12-05  16  17  18  19
# 2021-12-06  20  21  22  23

# 选择某一列 这两种方式一样
print(df['A'])
print(df.A)
# 2021-12-01     0
# 2021-12-02     4
# 2021-12-03     8
# 2021-12-04    12
# 2021-12-05    16
# 2021-12-06    20
# Freq: D, Name: A, dtype: int64

# 选择某一行
print(df[0:3])  # 0 到 2行
#             A  B   C   D
# 2021-12-01  0  1   2   3
# 2021-12-02  4  5   6   7
# 2021-12-03  8  9  10  11

print(df['20211201':'20211203'])
#             A  B   C   D
# 2021-12-01  0  1   2   3
# 2021-12-02  4  5   6   7
# 2021-12-03  8  9  10  11

# loc: select by label 根据标签来选
print(df.loc['20211201'])
# A    0
# B    1
# C    2
# D    3
# Name: 2021-12-01 00:00:00, dtype: int64

# 纵向标签
print(df.loc[:, ['A', 'B']])
#              A   B
# 2021-12-01   0   1
# 2021-12-02   4   5
# 2021-12-03   8   9
# 2021-12-04  12  13
# 2021-12-05  16  17
# 2021-12-06  20  21

# 某一行的部分数据
print(df.loc['20211202':, ['A', 'B']])
#              A   B
# 2021-12-02   4   5
# 2021-12-03   8   9
# 2021-12-04  12  13
# 2021-12-05  16  17
# 2021-12-06  20  21

# iloc: select by position (根据下标来选)
print(df.iloc[3:5, 1:3])  # 第三行到第四行,第一列到第二列数据
#              B   C
# 2021-12-04  13  14
# 2021-12-05  17  18

print(df.iloc[[1, 3, 5], 1:3])
#              B   C
# 2021-12-02   5   6
# 2021-12-04  13  14
# 2021-12-06  21  22

# ix: mixed selecttion 混合筛选(3.7已经弃用)
# print(df.ix[:3, ['A', 'C']])

# 是或否筛选: Boolean indexing
print(df[df.A > 8])  # df.A > 8 返回的是 True or False,后面再把True的行打印出来
#              A   B   C   D
# 2021-12-04  12  13  14  15
# 2021-12-05  16  17  18  19
# 2021-12-06  20  21  22  23
Pandas 赋值,添加新列
import numpy as np
import pandas as pd
dates = pd.date_range('20211201', periods=6)
df = pd.DataFrame(np.arange(24).reshape((6, 4)),
                  index=dates, columns=['A', 'B', 'C', 'D'])
print(df)
#              A   B   C   D
# 2021-12-01   0   1   2   3
# 2021-12-02   4   5   6   7
# 2021-12-03   8   9  10  11
# 2021-12-04  12  13  14  15
# 2021-12-05  16  17  18  19
# 2021-12-06  20  21  22  23

# 修改值

# loc, iloc
print(df.iloc[2, 2])  # 10
df.iloc[2, 2] = 111
print(df.iloc[2, 2])  # 111

print(df.loc['20211203', 'C'])  # 111
df.loc['20211203', 'C'] = 222
print(df.loc['20211203', 'C'])  # 222

# 将A这一列中大于8的行的B赋值为0
df.B[df.A > 8] = 0
print(df)
#              A  B    C   D
# 2021-12-01   0  1    2   3
# 2021-12-02   4  5    6   7
# 2021-12-03   8  9  222  11
# 2021-12-04  12  0   14  15
# 2021-12-05  16  0   18  19
# 2021-12-06  20  0   22  23

# 将A这一列中小于8的这一行全赋值为0
df[df.A < 8] = 0
print(df)
#              A  B    C   D
# 2021-12-01   0  0    0   0
# 2021-12-02   0  0    0   0
# 2021-12-03   8  9  222  11
# 2021-12-04  12  0   14  15
# 2021-12-05  16  0   18  19
# 2021-12-06  20  0   22  23

# 加新的列
df['F'] = np.nan
print(df)
#              A  B    C   D   F
# 2021-12-01   0  0    0   0 NaN
# 2021-12-02   0  0    0   0 NaN
# 2021-12-03   8  9  222  11 NaN
# 2021-12-04  12  0   14  15 NaN
# 2021-12-05  16  0   18  19 NaN
# 2021-12-06  20  0   22  23 NaN

# 添加或修改原有的列,index要对应
df['D'] = pd.Series([1, 2, 3, 4, 5, 6], index=pd.date_range('20211201', periods=6))
print(df)
#              A  B    C  D   F
# 2021-12-01   0  0    0  1 NaN
# 2021-12-02   0  0    0  2 NaN
# 2021-12-03   8  9  222  3 NaN
# 2021-12-04  12  0   14  4 NaN
# 2021-12-05  16  0   18  5 NaN
# 2021-12-06  20  0   22  6 NaN

# 这种直接赋值也可以
df['D'] = list(range(6, 12))
print(df)
#              A  B    C   D   F
# 2021-12-01   0  0    0   6 NaN
# 2021-12-02   0  0    0   7 NaN
# 2021-12-03   8  9  222   8 NaN
# 2021-12-04  12  0   14   9 NaN
# 2021-12-05  16  0   18  10 NaN
# 2021-12-06  20  0   22  11 NaN
Pandas 处理缺失数据 NaN: isna, isnull, fillna, dropna
import numpy as np
import pandas as pd
dates = pd.date_range('20211201', periods=6)
df = pd.DataFrame(np.arange(24).reshape((6, 4)),
                  index=dates, columns=['A', 'B', 'C', 'D'])

# 制造NaN值
df.iloc[1, 1], df.iloc[2, 2] = np.nan, np.nan

print(df)
#              A     B     C   D
# 2021-12-01   0   1.0   2.0   3
# 2021-12-02   4   NaN   6.0   7
# 2021-12-03   8   9.0   NaN  11
# 2021-12-04  12  13.0  14.0  15
# 2021-12-05  16  17.0  18.0  19
# 2021-12-06  20  21.0  22.0  23

# isnull: 是否有缺失值 和 isna一样
print(df.isnull())
#                 A      B      C      D
# 2021-12-01  False  False  False  False
# 2021-12-02  False   True  False  False
# 2021-12-03  False  False   True  False
# 2021-12-04  False  False  False  False
# 2021-12-05  False  False  False  False
# 2021-12-06  False  False  False  False

# 可以这么判断 np.any 表至少一个元素等于 True
print(np.any(df.isnull() == True))  # True
print(np.any(df.isnull() is True))  # False
print(np.any(df.isnull()))  # True


# fillna: 替换NaN数据
print(df.fillna(value=99))
#              A     B     C   D
# 2021-12-01   0   1.0   2.0   3
# 2021-12-02   4  99.0   6.0   7
# 2021-12-03   8   9.0  99.0  11
# 2021-12-04  12  13.0  14.0  15
# 2021-12-05  16  17.0  18.0  19
# 2021-12-06  20  21.0  22.0  23


df.iloc[1, 1], df.iloc[2, 2] = np.nan, np.nan

# dropna: 丢弃含NaN的数据,axis=0 行,axis=1 列; any 有任何一个NaN就丢, all 所有数据都为NaN时才丢弃
print(df.dropna(axis=0, how='any'))
#              A     B     C   D
# 2021-12-01   0   1.0   2.0   3
# 2021-12-04  12  13.0  14.0  15
# 2021-12-05  16  17.0  18.0  19
# 2021-12-06  20  21.0  22.0  23
Pandas 处理文件
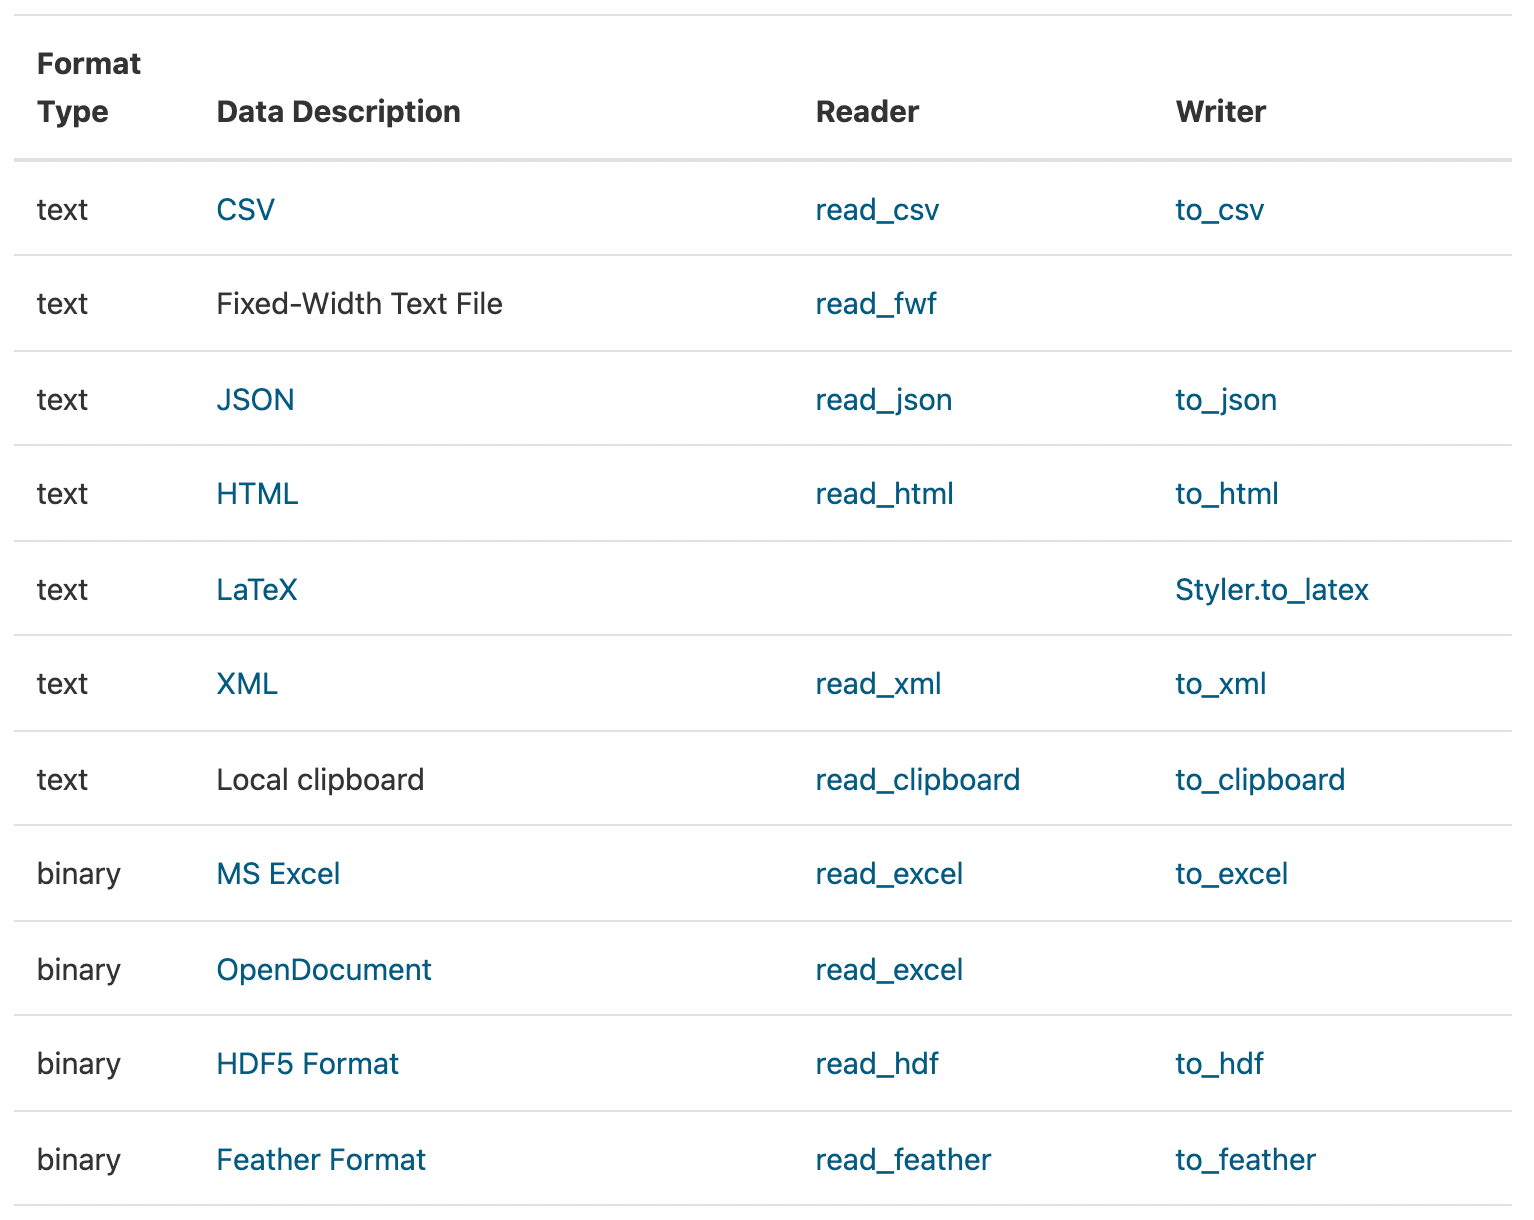
支持的文件: https://pandas.pydata.org/pandas-docs/stable/user_guide/io.html
import pandas as pd

# 创建一个cvs文件
csv_file = './test.csv'

writer = open(csv_file, 'w+', encoding='utf-8')
writer.write('id,name,num\n')

for i in range(10):
    writer.write(f'{i},{i},{i}\n')

writer.close()

# 读取,会自动加上行索引
data = pd.read_csv(csv_file)
print(data)
#    id  name  num
# 0   0     0    0
# 1   1     1    1
# 2   2     2    2
# 3   3     3    3
# 4   4     4    4
# 5   5     5    5
# 6   6     6    6
# 7   7     7    7
# 8   8     8    8
# 9   9     9    9

# 存储
data.to_pickle('./test.pickel')

data_pickel = pd.read_pickle('./test.pickel')
print(data_pickel)
#    id  name  num
# 0   0     0    0
# 1   1     1    1
# 2   2     2    2
# 3   3     3    3
# 4   4     4    4
# 5   5     5    5
# 6   6     6    6
# 7   7     7    7
# 8   8     8    8
# 9   9     9    9
Pandas 合并: concat append
import numpy as np
import pandas as pd
from pandas.io.spss import read_spss

# 准备数据
df1 = pd.DataFrame(np.ones((3, 4)) * 0, columns=['a', 'b', 'c', 'd'])
df2 = pd.DataFrame(np.ones((3, 4)) * 1, columns=['a', 'b', 'c', 'd'])
df3 = pd.DataFrame(np.ones((3, 4)) * 2, columns=['a', 'b', 'c', 'd'])
print(df1)
print(df2)
print(df3)
#      a    b    c    d
# 0  0.0  0.0  0.0  0.0
# 1  0.0  0.0  0.0  0.0
# 2  0.0  0.0  0.0  0.0
#      a    b    c    d
# 0  1.0  1.0  1.0  1.0
# 1  1.0  1.0  1.0  1.0
# 2  1.0  1.0  1.0  1.0
#      a    b    c    d
# 0  2.0  2.0  2.0  2.0
# 1  2.0  2.0  2.0  2.0
# 2  2.0  2.0  2.0  2.0

# concat: 上下合并 axis=0 竖向合并; igore 为True会忽略以前的索引
res = pd.concat([df1, df2, df3], axis=0, ignore_index=True)
print(res)
#      a    b    c    d
# 0  0.0  0.0  0.0  0.0
# 1  0.0  0.0  0.0  0.0
# 2  0.0  0.0  0.0  0.0
# 3  1.0  1.0  1.0  1.0
# 4  1.0  1.0  1.0  1.0
# 5  1.0  1.0  1.0  1.0
# 6  2.0  2.0  2.0  2.0
# 7  2.0  2.0  2.0  2.0
# 8  2.0  2.0  2.0  2.0

# 部分重合的数据
df4 = pd.DataFrame(np.ones((3, 4))*0, index=[1, 2, 3], columns=['a', 'b', 'c', 'd'])
df5 = pd.DataFrame(np.ones((3, 4))*1, index=[2, 3, 4], columns=['b', 'c', 'd', 'e'])
print(df4)
print(df5)
#      a    b    c    d
# 1  0.0  0.0  0.0  0.0
# 2  0.0  0.0  0.0  0.0
# 3  0.0  0.0  0.0  0.0
#      b    c    d    e
# 2  1.0  1.0  1.0  1.0
# 3  1.0  1.0  1.0  1.0
# 4  1.0  1.0  1.0  1.0

# 直接合并,默认join='outer',默认axis=0
res = pd.concat([df4, df5])
print(res)
#      a    b    c    d    e
# 1  0.0  0.0  0.0  0.0  NaN
# 2  0.0  0.0  0.0  0.0  NaN
# 3  0.0  0.0  0.0  0.0  NaN
# 2  NaN  1.0  1.0  1.0  1.0
# 3  NaN  1.0  1.0  1.0  1.0
# 4  NaN  1.0  1.0  1.0  1.0

res = pd.concat([df4, df5], axis=1)
print(res)
#      a    b    c    d    b    c    d    e
# 1  0.0  0.0  0.0  0.0  NaN  NaN  NaN  NaN
# 2  0.0  0.0  0.0  0.0  1.0  1.0  1.0  1.0
# 3  0.0  0.0  0.0  0.0  1.0  1.0  1.0  1.0
# 4  NaN  NaN  NaN  NaN  1.0  1.0  1.0  1.0

# 直接合并,使用join='inner',裁剪相同的部分,同样可以加ignore
res = pd.concat([df4, df5], join='inner')
print(res)
#      b    c    d
# 1  0.0  0.0  0.0
# 2  0.0  0.0  0.0
# 3  0.0  0.0  0.0
# 2  1.0  1.0  1.0
# 3  1.0  1.0  1.0
# 4  1.0  1.0  1.0

# append: 在后面添加,可以指定方向
res = df1.append([df2, df3], ignore_index=True)
print(res)
#      a    b    c    d
# 0  0.0  0.0  0.0  0.0
# 1  0.0  0.0  0.0  0.0
# 2  0.0  0.0  0.0  0.0
# 3  1.0  1.0  1.0  1.0
# 4  1.0  1.0  1.0  1.0
# 5  1.0  1.0  1.0  1.0
# 6  2.0  2.0  2.0  2.0
# 7  2.0  2.0  2.0  2.0
# 8  2.0  2.0  2.0  2.0

# 添加一行新的数据
s1 = pd.Series(np.arange(4), index=['a', 'b', 'c', 'd'])
print(s1)
# a    0
# b    1
# c    2
# d    3
# dtype: int64

print(df1.append(s1, ignore_index=True))
#      a    b    c    d
# 0  0.0  0.0  0.0  0.0
# 1  0.0  0.0  0.0  0.0
# 2  0.0  0.0  0.0  0.0
# 3  0.0  1.0  2.0  3.0
Pandas 合并 merge
- on: 有相同的属性(列名)
import pandas as pd

# 准备数据 有一列列名相同
left = pd.DataFrame({
    'key': ['K0', 'K1', 'K3', 'K4'],
    'A': ['A0', 'A1', 'A3', 'A4'],
    'B': ['B0', 'B1', 'B3', 'B4']
})
right = pd.DataFrame({
    'key': ['K0', 'K1', 'K3', 'K4'],
    'C': ['C0', 'C1', 'C3', 'C4'],
    'D': ['D0', 'D1', 'D3', 'D4']
})
print(left)
print(right)
#   key   A   B
# 0  K0  A0  B0
# 1  K1  A1  B1
# 2  K3  A3  B3
# 3  K4  A4  B4
#   key   C   D
# 0  K0  C0  D0
# 1  K1  C1  D1
# 2  K3  C3  D3
# 3  K4  C4  D4

# 在key上合并
res = pd.merge(left, right, on='key')
print(res)
#   key   A   B   C   D
# 0  K0  A0  B0  C0  D0
# 1  K1  A1  B1  C1  D1
# 2  K3  A3  B3  C3  D3
# 3  K4  A4  B4  C4  D4

# 准备数据: 有两列列名相同
left = pd.DataFrame({
    'key1': ['K0', 'K0', 'K1', 'K2'],
    'key2': ['K0', 'K1', 'K0', 'K1'],
    'A': ['A0', 'A1', 'A3', 'A4'],
    'B': ['B0', 'B1', 'B3', 'B4']
})
right = pd.DataFrame({
    'key1': ['K0', 'K1', 'K1', 'K2'],
    'key2': ['K0', 'K0', 'K0', 'K0'],
    'C': ['C0', 'C1', 'C3', 'C4'],
    'D': ['D0', 'D1', 'D3', 'D4']
})
print(left)
print(right)
#   key1 key2   A   B
# 0   K0   K0  A0  B0
# 1   K0   K1  A1  B1
# 2   K1   K0  A3  B3
# 3   K2   K1  A4  B4
#   key1 key2   C   D
# 0   K0   K0  C0  D0
# 1   K1   K0  C1  D1
# 2   K1   K0  C3  D3
# 3   K2   K0  C4  D4

res = pd.merge(left, right, on=['key1', 'key2'])  # 默认是how='inner'
print(res)  # key1 key2 都相同时,把其他的对应元素也拷贝下来
#   key1 key2   A   B   C   D
# 0   K0   K0  A0  B0  C0  D0
# 1   K1   K0  A3  B3  C1  D1
# 2   K1   K0  A3  B3  C3  D3

# how = ['letf', 'right', 'outer', 'inner']
res = pd.merge(left, right, on=['key1', 'key2'], how='outer')
print(res)  # key1 key2 不管相不相同都留下来,没有的值为NaN
#   key1 key2    A    B    C    D
# 0   K0   K0   A0   B0   C0   D0
# 1   K0   K1   A1   B1  NaN  NaN
# 2   K1   K0   A3   B3   C1   D1
# 3   K1   K0   A3   B3   C3   D3
# 4   K2   K1   A4   B4  NaN  NaN
# 5   K2   K0  NaN  NaN   C4   D4

res = pd.merge(left, right, on=['key1', 'key2'], how='left')
print(res)  # 拿left的key去right中找,找到几个留几个,找不到用NaN填充
#   key1 key2   A   B    C    D
# 0   K0   K0  A0  B0   C0   D0
# 1   K0   K1  A1  B1  NaN  NaN
# 2   K1   K0  A3  B3   C1   D1
# 3   K1   K0  A3  B3   C3   D3
# 4   K2   K1  A4  B4  NaN  NaN

res = pd.merge(left, right, on=['key1', 'key2'], how='right')
print(res)
#   key1 key2    A    B   C   D
# 0   K0   K0   A0   B0  C0  D0
# 1   K1   K0   A3   B3  C1  D1
# 2   K1   K0   A3   B3  C3  D3
# 3   K2   K0  NaN  NaN  C4  D4

# indicator: 显示合并方式
res = pd.merge(left, right, on=['key1', 'key2'], how='right', indicator=True)
print(res)
#   key1 key2    A    B   C   D      _merge
# 0   K0   K0   A0   B0  C0  D0        both
# 1   K1   K0   A3   B3  C1  D1        both
# 2   K1   K0   A3   B3  C3  D3        both
# 3   K2   K0  NaN  NaN  C4  D4  right_only

# indicator: 指定列名
res = pd.merge(left, right, on=['key1', 'key2'], how='right', indicator='tset-name')
print(res)
#   key1 key2    A    B   C   D   tset-name
# 0   K0   K0   A0   B0  C0  D0        both
# 1   K1   K0   A3   B3  C1  D1        both
# 2   K1   K0   A3   B3  C3  D3        both
# 3   K2   K0  NaN  NaN  C4  D4  right_only
- 通过index合并
# 准备数据
left = pd.DataFrame({
    'A': ['A0', 'A1', 'A2'],
    'B': ['B0', 'B1', 'B2']
}, index=['K0', 'K1', 'K2'])
right = pd.DataFrame({
    'C': ['C0', 'C1', 'C3'],
    'D': ['D0', 'D1', 'D3']
}, index=['K0', 'K2', 'K3'])
print(left)
print(right)
#      A   B
# K0  A0  B0
# K1  A1  B1
# K2  A2  B2
#      C   D
# K0  C0  D0
# K2  C1  D1
# K3  C3  D3

# 通过index合并,left_index right_index 默认是 False,为True之后不在考虑列的索引
res = pd.merge(left, right, left_index=True, right_index=True, how='outer')
print(res)
#       A    B    C    D
# K0   A0   B0   C0   D0
# K1   A1   B1  NaN  NaN
# K2   A2   B2   C1   D1
# K3  NaN  NaN   C3   D3

res = pd.merge(left, right, left_index=True, right_index=True, how='inner')
print(res)
#     A   B   C   D
# K0  A0  B0  C0  D0
# K2  A2  B2  C1  D1
- 相同列名,加后缀
import pandas as pd

# 准备数据 两个数据表的有属性名一样
boys = pd.DataFrame({'k': ['K0', 'K1', 'K2'], 'age': [1, 2, 3], 'test_1': [1, 2, 2]})
girls = pd.DataFrame({'k': ['K0', 'K0', 'K3'], 'age': [4, 5, 3], 'test_2': [2, 2, 2]})
print(boys)
print(girls)
#     k  age  test_1
# 0  K0    1       1
# 1  K1    2       2
# 2  K2    3       2
#     k  age  test_2
# 0  K0    4       2
# 1  K0    5       2
# 2  K3    3       2

# 如果列名相同会加后缀,不同就不需要
res = pd.merge(boys, girls, on='k', suffixes=['_boy', '_girls'], how='outer')
print(res)
#     k  age_boy  test_1  age_girls  test_2
# 0  K0      1.0     1.0        4.0     2.0
# 1  K0      1.0     1.0        5.0     2.0
# 2  K1      2.0     2.0        NaN     NaN
# 3  K2      3.0     2.0        NaN     NaN
# 4  K3      NaN     NaN        3.0     2.0
Pandas 画图
import numpy as np
import pandas as pd
import matplotlib.pyplot as plt

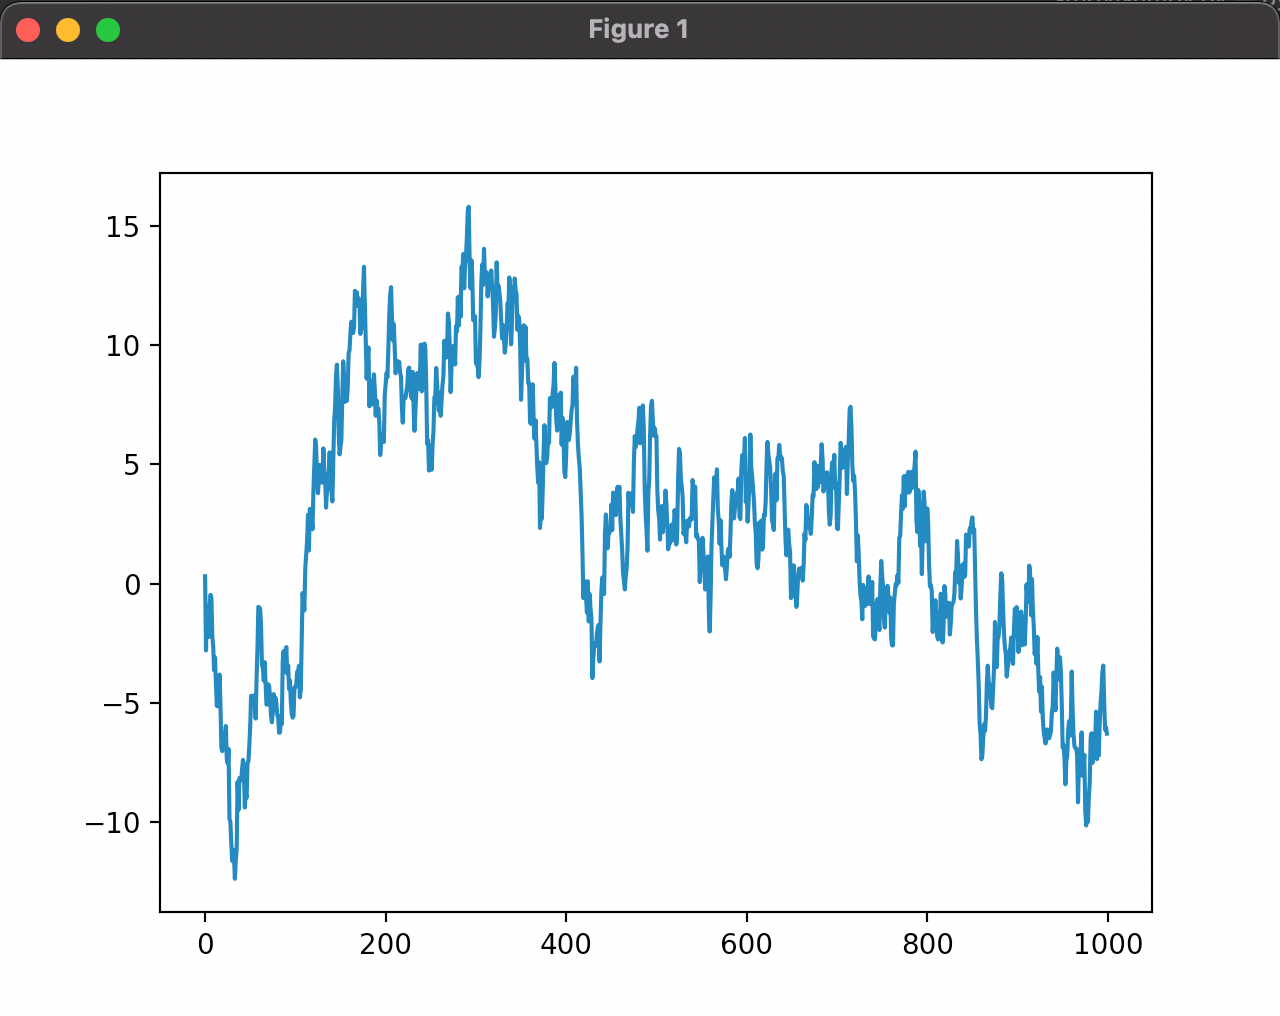
# Series
# 生成1000个随机数,下标是[0, 1000)
data = pd.Series(np.random.randn(1000), index=np.arange(1000))
data = data.cumsum()  # 逐步累加,并保留值
data.plot()  # 显示上去了,加载数据
plt.show()

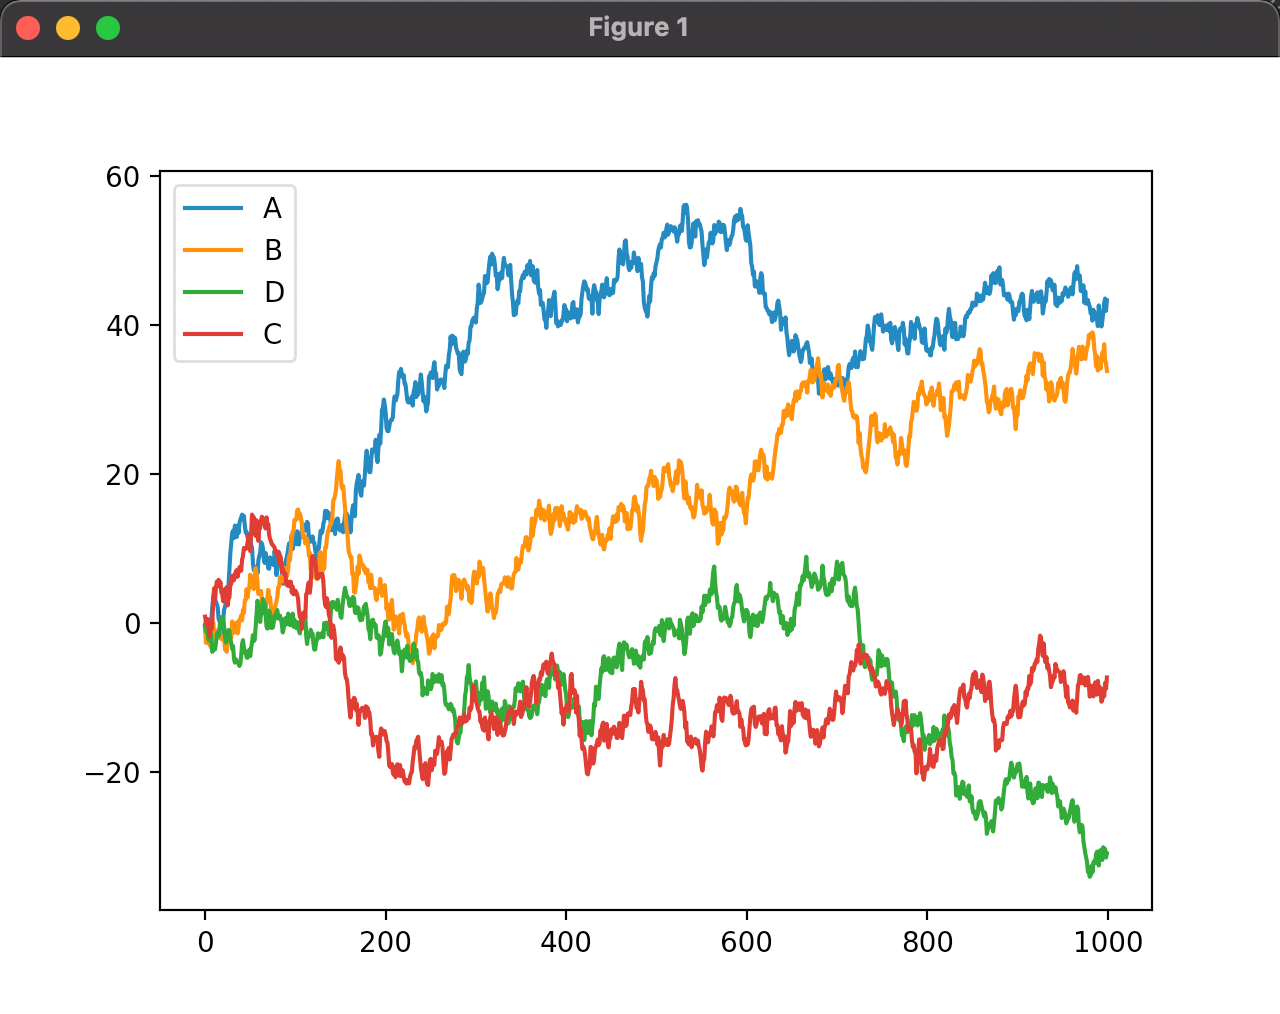
# DataFrame
# 1000个数据,每个数据4个属性,分别为ABDC
data = pd.DataFrame(np.random.randn(1000, 4), index=np.arange(1000), columns=list('ABDC'))
data = data.cumsum()

# 打印前5个数据
print(data.head(5))
#           A         B         D         C
# 0  1.137261 -0.151256 -1.768632 -0.553897
# 1  0.824339  0.570760 -2.483564  0.190463
# 2  0.488407 -0.699785 -1.906383  0.053245
# 3 -1.073358 -2.450119 -2.178400  0.119925
# 4 -0.588325 -2.945741 -4.263403 -1.111191

data.plot()  # plot 中可以设置图形参数
plt.show()

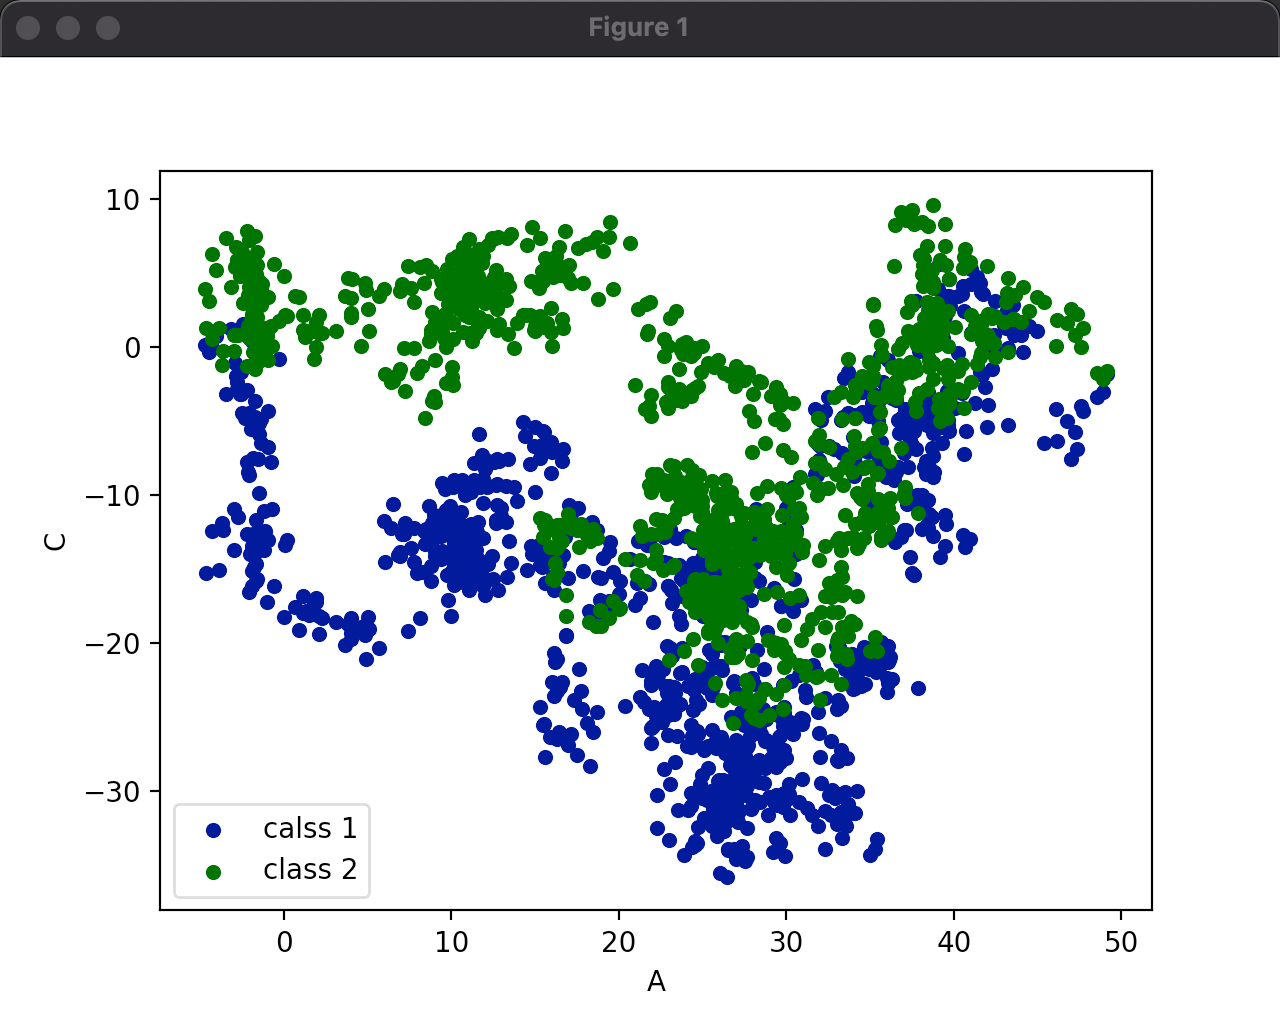
# plot methods: bar, hist, box, kde, area, scatter, hexbin, pie
pic = data.plot.scatter(x='A', y='B', color='DarkBlue', label='calss 1')
data.plot.scatter(x='A', y='C', color='DarkGreen', label='class 2', ax=pic)
data.plot()
plt.show()
Matplotlib 基本使用
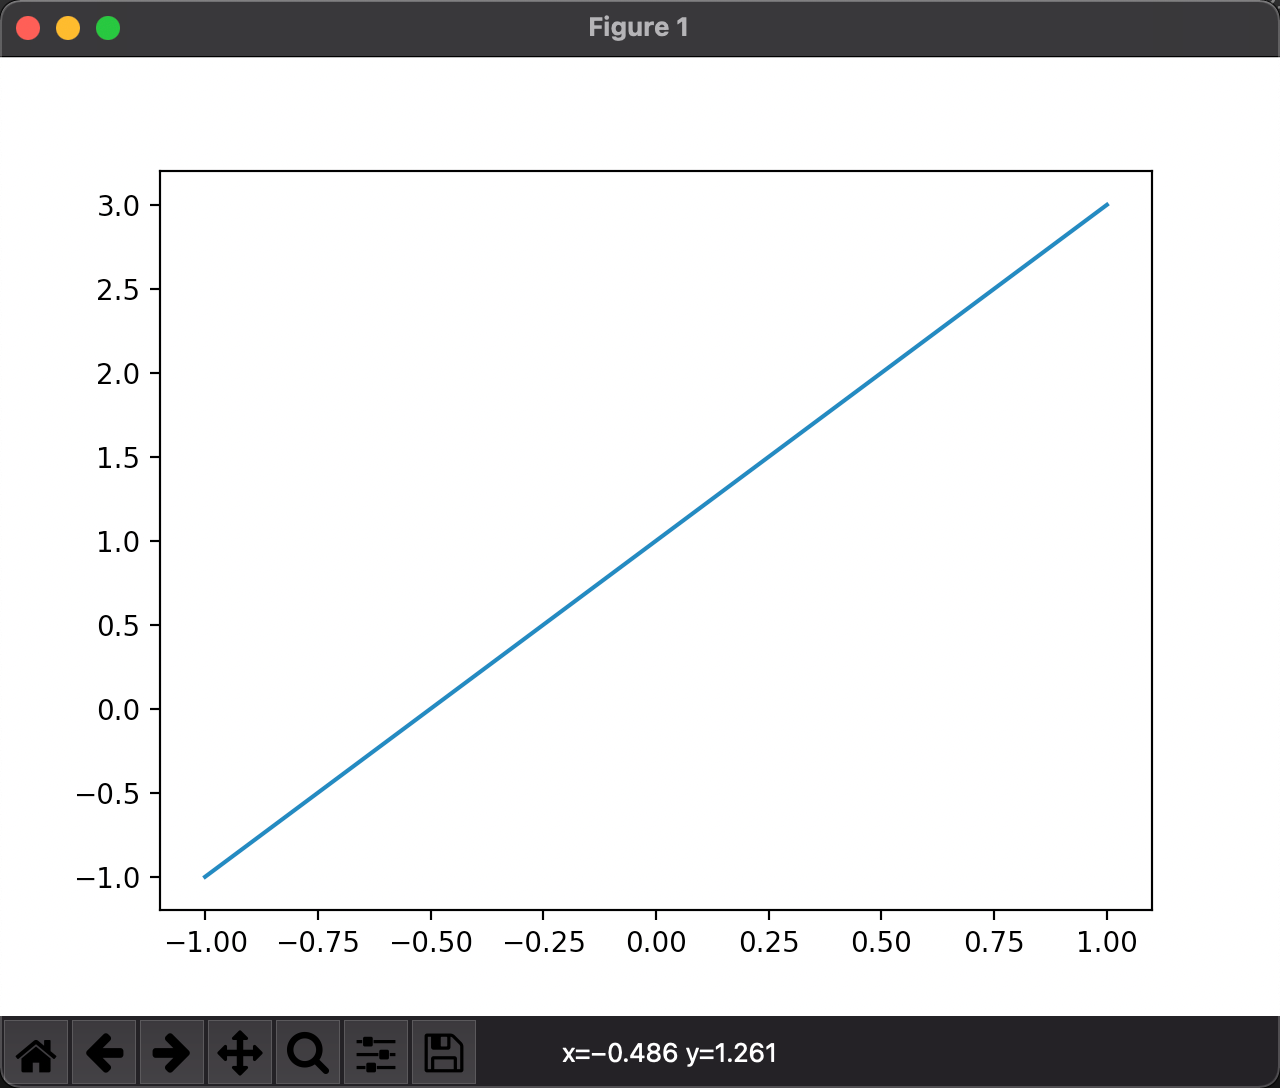
import matplotlib.pyplot as plt
import numpy as np

# [-1, 1] 分成50份
x = np.linspace(-1, 1, 50)
y = x * 2 + 1
plt.plot(x, y)  # 设置数据和属性
plt.show()      # 画图
Matplotlib Figure
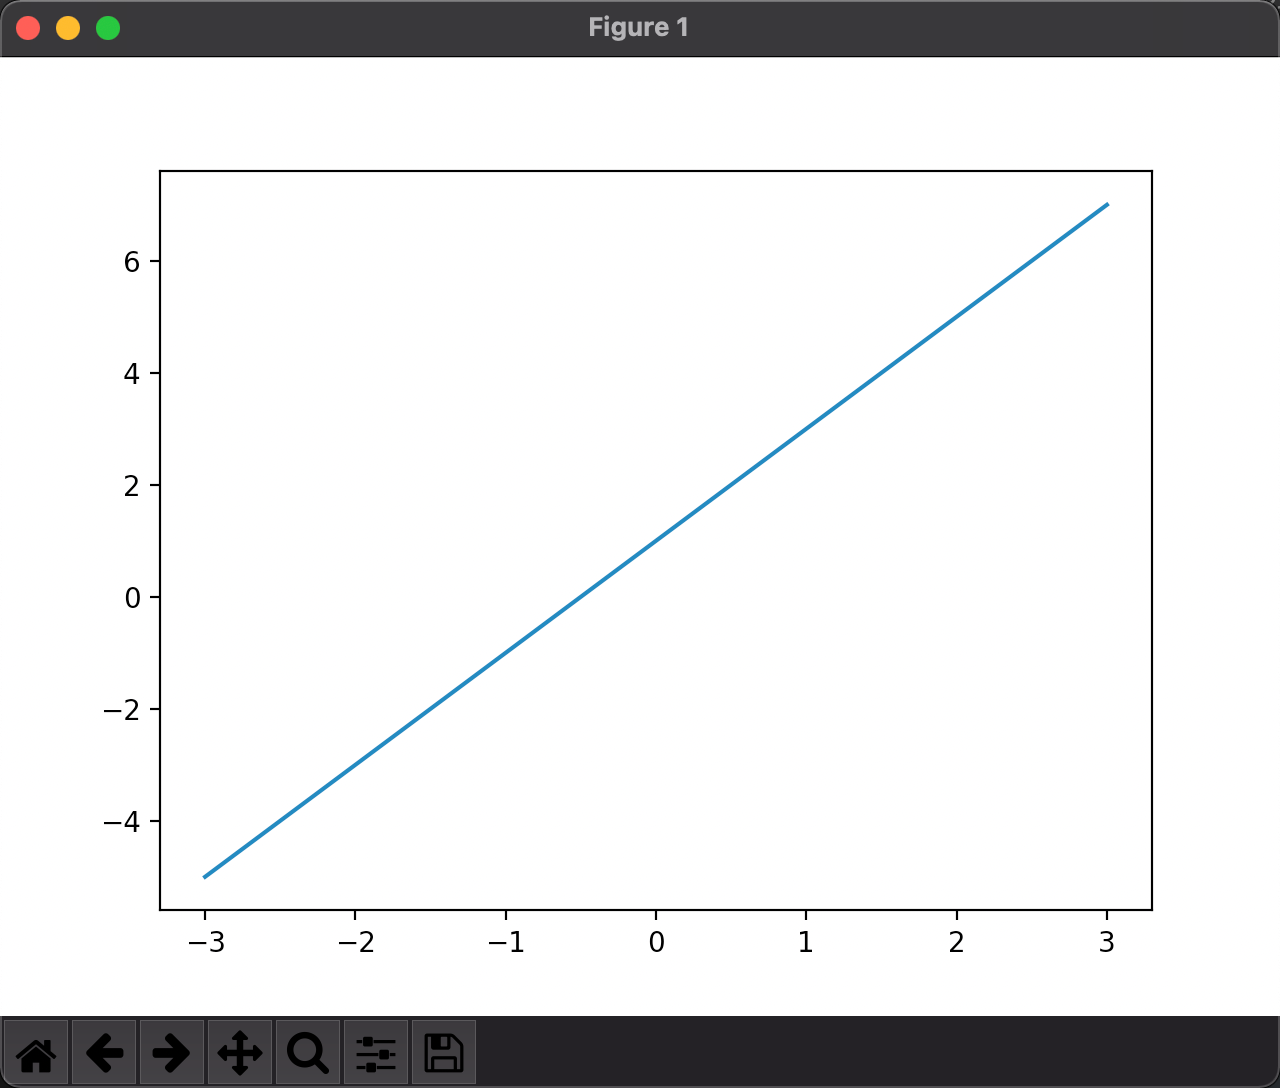
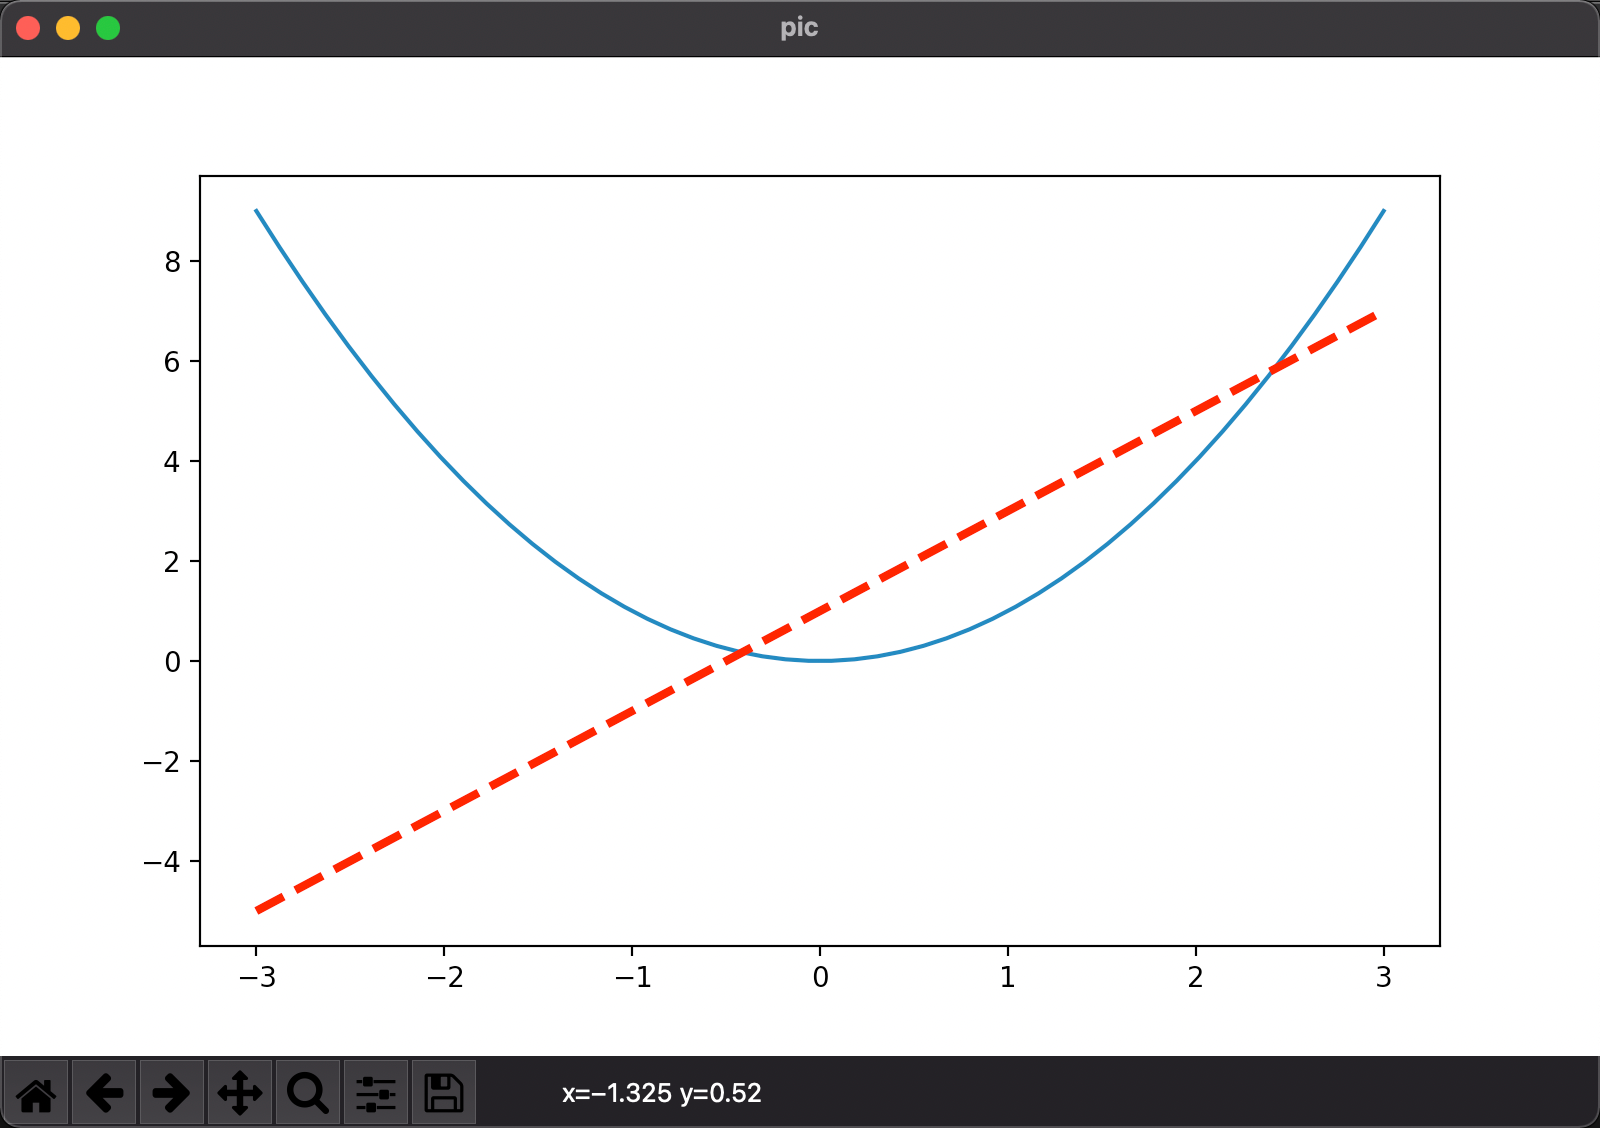
- 默认是显示在一个figure上,可以手动创建,设置大小、名字
- 多个figure时,当前figure的属性设置代码直到遇到创建下一个figure
import matplotlib.pyplot as plt
import numpy as np

x = np.linspace(-3, 3, 50)
y1 = x * 2 + 1
y2 = x ** 2

plt.figure()  # 创建一个figure,这个下面设置的数据和属性都是个画板的
plt.plot(x, y1)

plt.figure('pic', figsize=(8, 5))  # 创建第二个画板,并给个名字,设置大小
plt.plot(x, y2)

# 在第二个画板加入y1,设置红色,虚线
plt.plot(x, y1, color='red', linewidth=3, linestyle='--')

plt.show()
Matplotlib 坐标轴设置
import matplotlib.pyplot as plt
import numpy as np

x = np.linspace(-3, 3, 50)
y1 = x * 2 + 1
y2 = x ** 2

# 在图形中加入y1,设置红色,虚线
plt.plot(x, y1, color='red', linewidth=3, linestyle='--')
# 加入y2
plt.plot(x, y2)

# 设置坐标轴

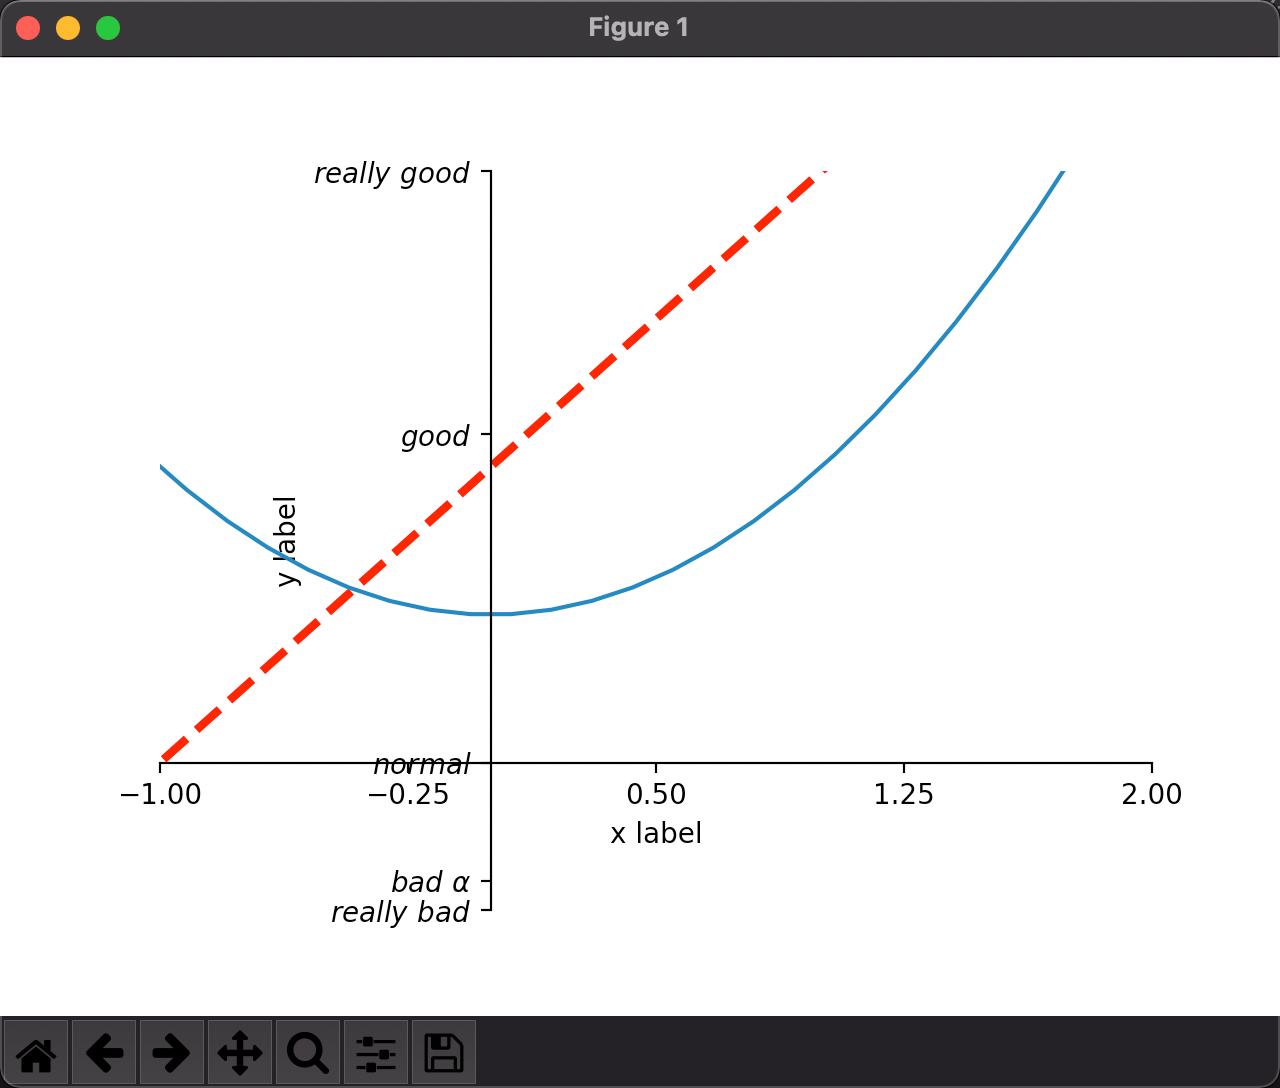
# 设置: 取值范围
plt.xlim((-1, 2))
plt.ylim((-2, 3))

# 设置名称
plt.xlabel('x label')
plt.ylabel('y label')

# 设置分割范围,没有设置的刻度就不显示
new_ticks = np.linspace(-1, 2, 5)
plt.xticks(new_ticks)

plt.yticks(
    [-2, -1.8, -1, 1.22, 3],
    ['really bad', 'bad', 'normal', 'good', 'really good']
)

# 设置新字体,数学形式,且可读,两边加$符号,空格前加斜杆,r表示是正则
plt.yticks(
    [-2, -1.8, -1, 1.22, 3],
    [r'$really\ bad$', r'$bad\ \alpha$', r'$normal$', r'$good$', r'$really\ good$']
)

# 设置坐标轴的位置
# gca = get current axis 有四个轴,上下左右,常说的xy就是下和左
ax = plt.gca()

# 隐藏右边和上边的轴
ax.spines['right'].set_color('none')
ax.spines['top'].set_color('none')

# 设置下边和左边的轴为x y
ax.xaxis.set_ticks_position('bottom')
ax.yaxis.set_ticks_position('left')

# x轴 所在的位置是y轴的-1
ax.spines['bottom'].set_position(('data', -1))
ax.spines['left'].set_position(('data', 0))

plt.show()
Matplotlib 图例 legend
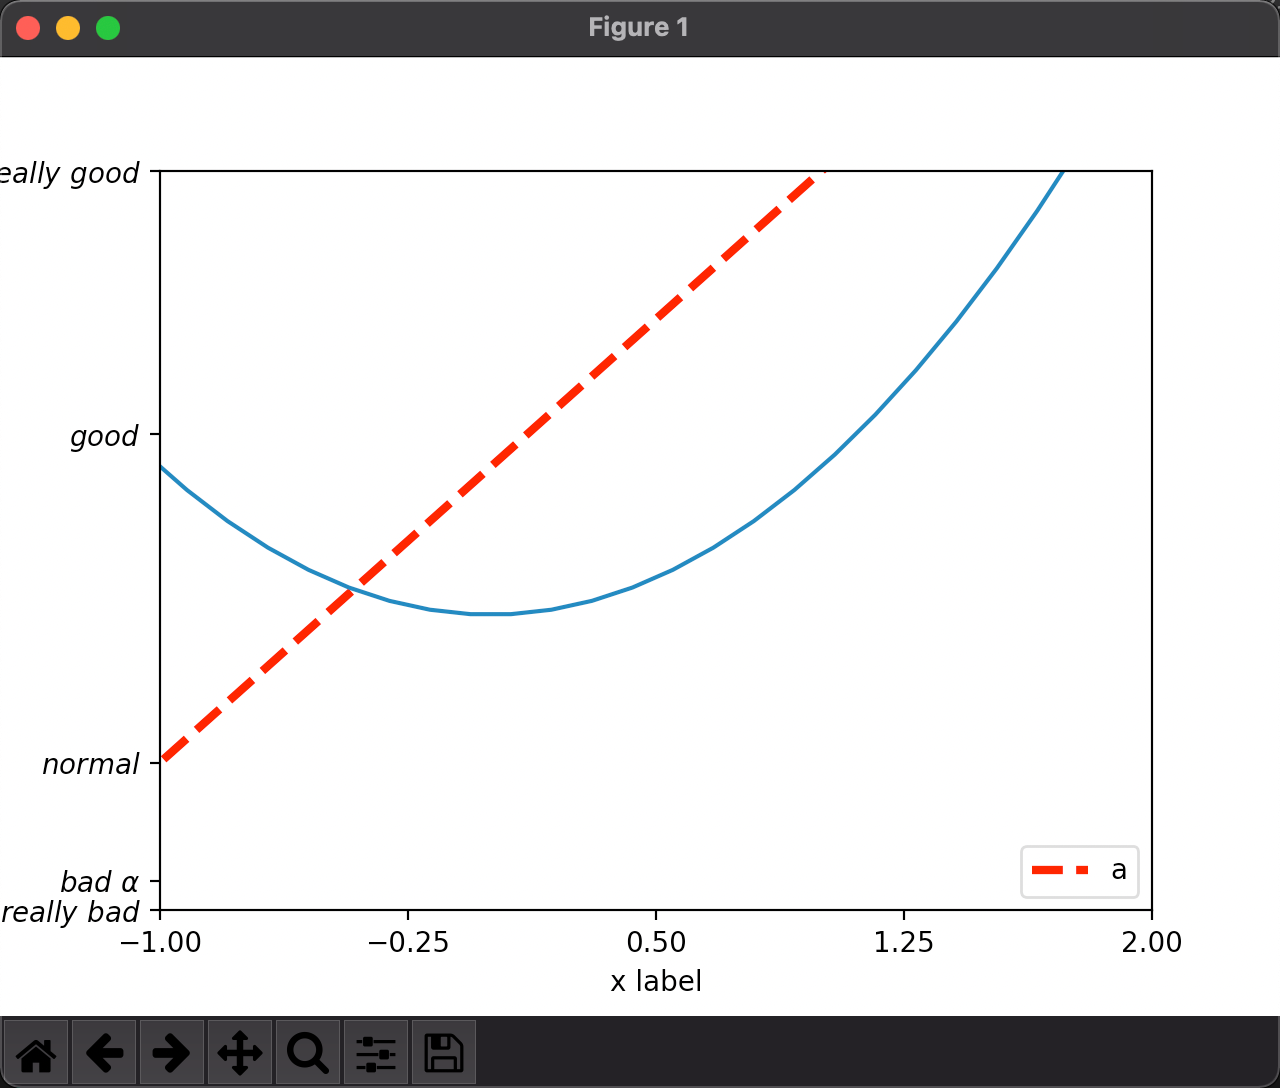
from logging import Handler
import matplotlib.pyplot as plt
import numpy as np

x = np.linspace(-3, 3, 50)
y1 = x * 2 + 1
y2 = x ** 2

# 设置坐标轴: 取值范围
plt.xlim((-1, 2))
plt.ylim((-2, 3))

# 设置名称
plt.xlabel('x label')
plt.ylabel('y label')

# 设置分割范围,没有设置的刻度就不显示
new_ticks = np.linspace(-1, 2, 5)
plt.xticks(new_ticks)

plt.yticks(
    [-2, -1.8, -1, 1.22, 3],
    ['really bad', 'bad', 'normal', 'good', 'really good']
)

# 设置新字体,数学形式,且可读,两边加$符号,空格前加斜杆,r表示是正则
plt.yticks(
    [-2, -1.8, -1, 1.22, 3],
    [r'$really\ bad$', r'$bad\ \alpha$', r'$normal$', r'$good$', r'$really\ good$']
)

# 在图形中加入y1,设置红色,虚线,名字
line1, = plt.plot(x, y1, color='red', linewidth=3, linestyle='--', label='up')
# 加入y2; 后面加个逗号,就解包的写法
line2, = plt.plot(x, y2, label='down')

# 图例 loc='best' 会自动选择一个地方
plt.legend(handles=[line1, line2, ], labels=['a', 'b'], loc='lower right')

# 只打印 a
plt.legend(handles=[line1,], labels=['a',], loc='lower right')

plt.show()
Matplotlib 添加注解
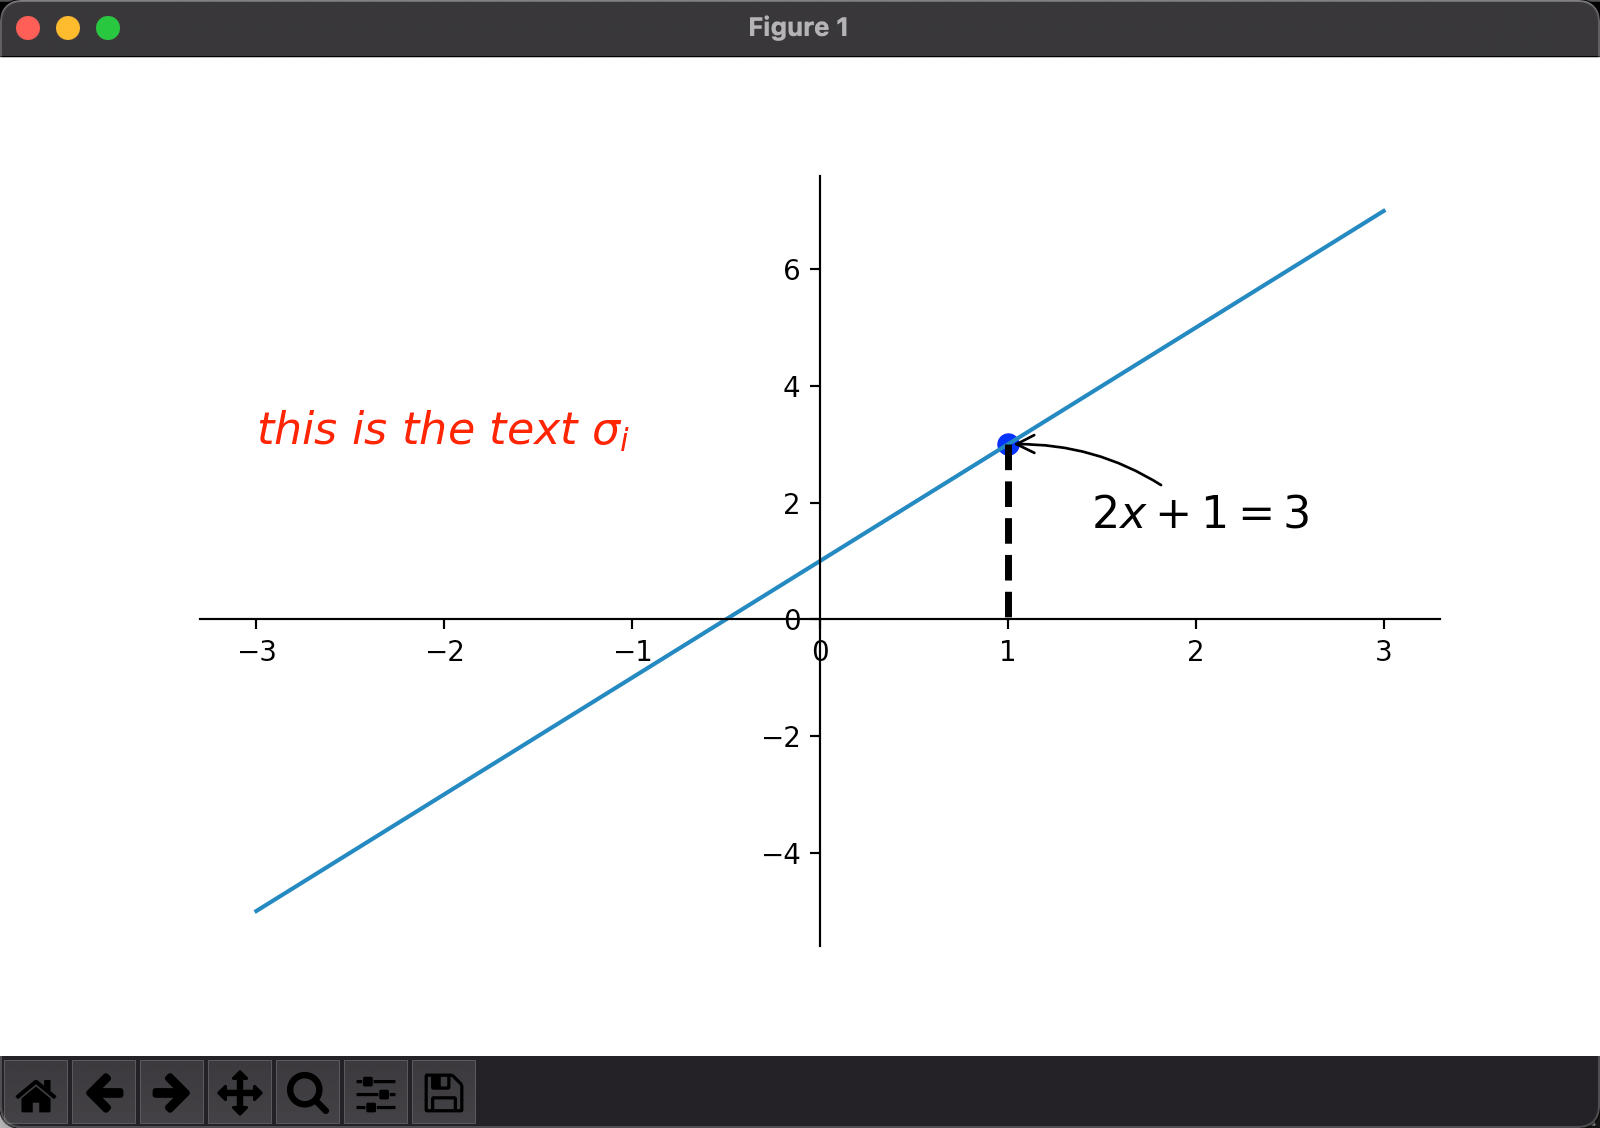
import matplotlib.pyplot as plt
import numpy as np

x = np.linspace(-3, 3, 50)
y = x * 2 + 1

plt.figure(num=1, figsize=(8, 5))
plt.plot(x, y)

ax = plt.gca()
ax.spines['right'].set_color('none')
ax.spines['top'].set_color('none')
ax.xaxis.set_ticks_position('bottom')
ax.spines['bottom'].set_position(('data', 0))
ax.yaxis.set_ticks_position('left')
ax.spines['left'].set_position(('data', 0))

# 添加点(1, 3)的注释
a = 1
b = a * 2 + 1
plt.scatter(a, b, s=50, color='b')
# 画一条虚线: 黑色虚线,宽度为2.5
plt.plot([a, a], [b, 0], 'k--', lw=2.5)

# 添加标注
# xy是文本位置;xycoords表示a b是坐标数值;xytext表示最终位置相对xy; textcoords表示基于某个点
# arrowprops就是这个弧线:arrowstyle样式,connectionstyle弧度
plt.annotate(f'$2x+1={b}$', xy=(a, b), xycoords='data', xytext=(+30, -30), textcoords='offset points',
             fontsize=16, arrowprops=dict(arrowstyle='->', connectionstyle='arc3, rad=.2'))

# 添加文本
plt.text(-3, 3, r'$this\ is\ the\ text\ \sigma_i$', fontdict={'size': 16, 'color': 'r'})

plt.show()
Matplotlib 坐标轴的标签防遮挡
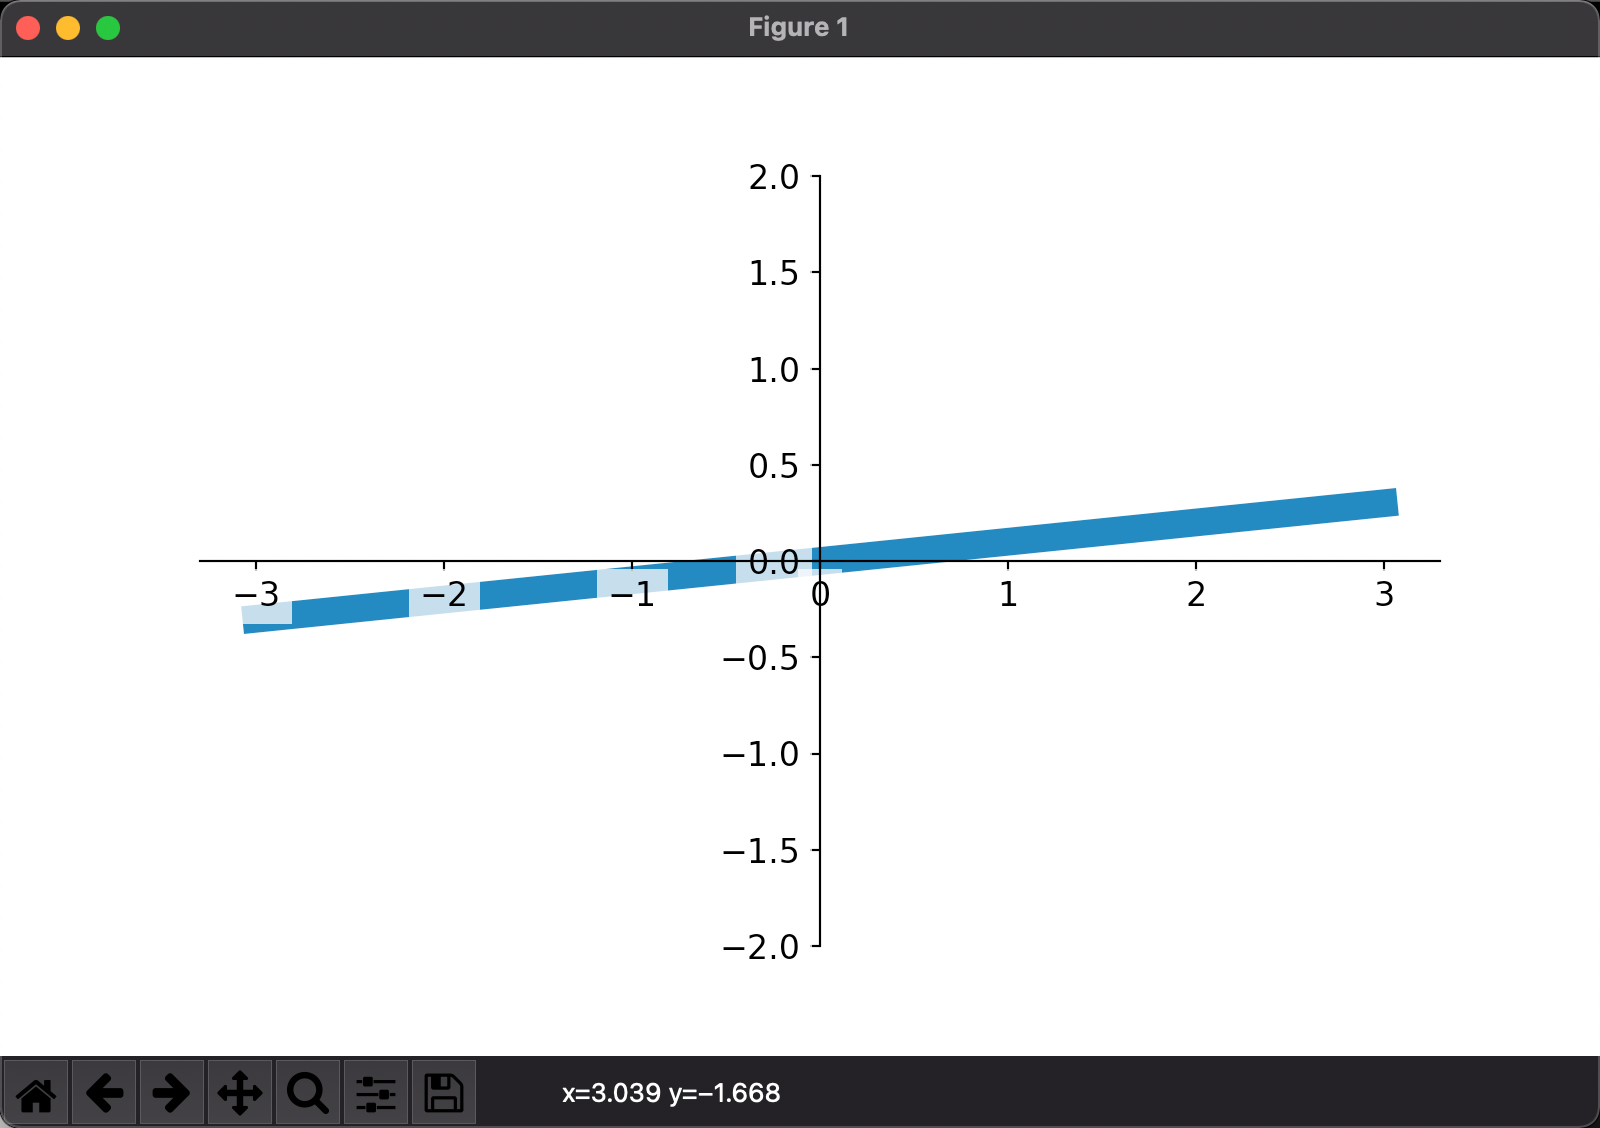
import matplotlib.pyplot as plt
import numpy as np

x = np.linspace(-3, 3, 50)
y = x * 0.1

plt.figure(num=1, figsize=(8, 5))
plt.plot(x, y, lw=10)
plt.ylim(-2, 2)

ax = plt.gca()
ax.spines['right'].set_color('none')
ax.spines['top'].set_color('none')
ax.xaxis.set_ticks_position('bottom')
ax.spines['bottom'].set_position(('data', 0))
ax.yaxis.set_ticks_position('left')
ax.spines['left'].set_position(('data', 0))

ax.xaxis.set_zorder(2)
ax.yaxis.set_zorder(2)

for label in ax.get_xticklabels() + ax.get_yticklabels():
    label.set_fontsize(12)
    label.set_bbox(dict(facecolor='white', edgecolor='None', alpha=0.7))
    label.set_zorder(1)
plt.show()
Matplotlib 散点图
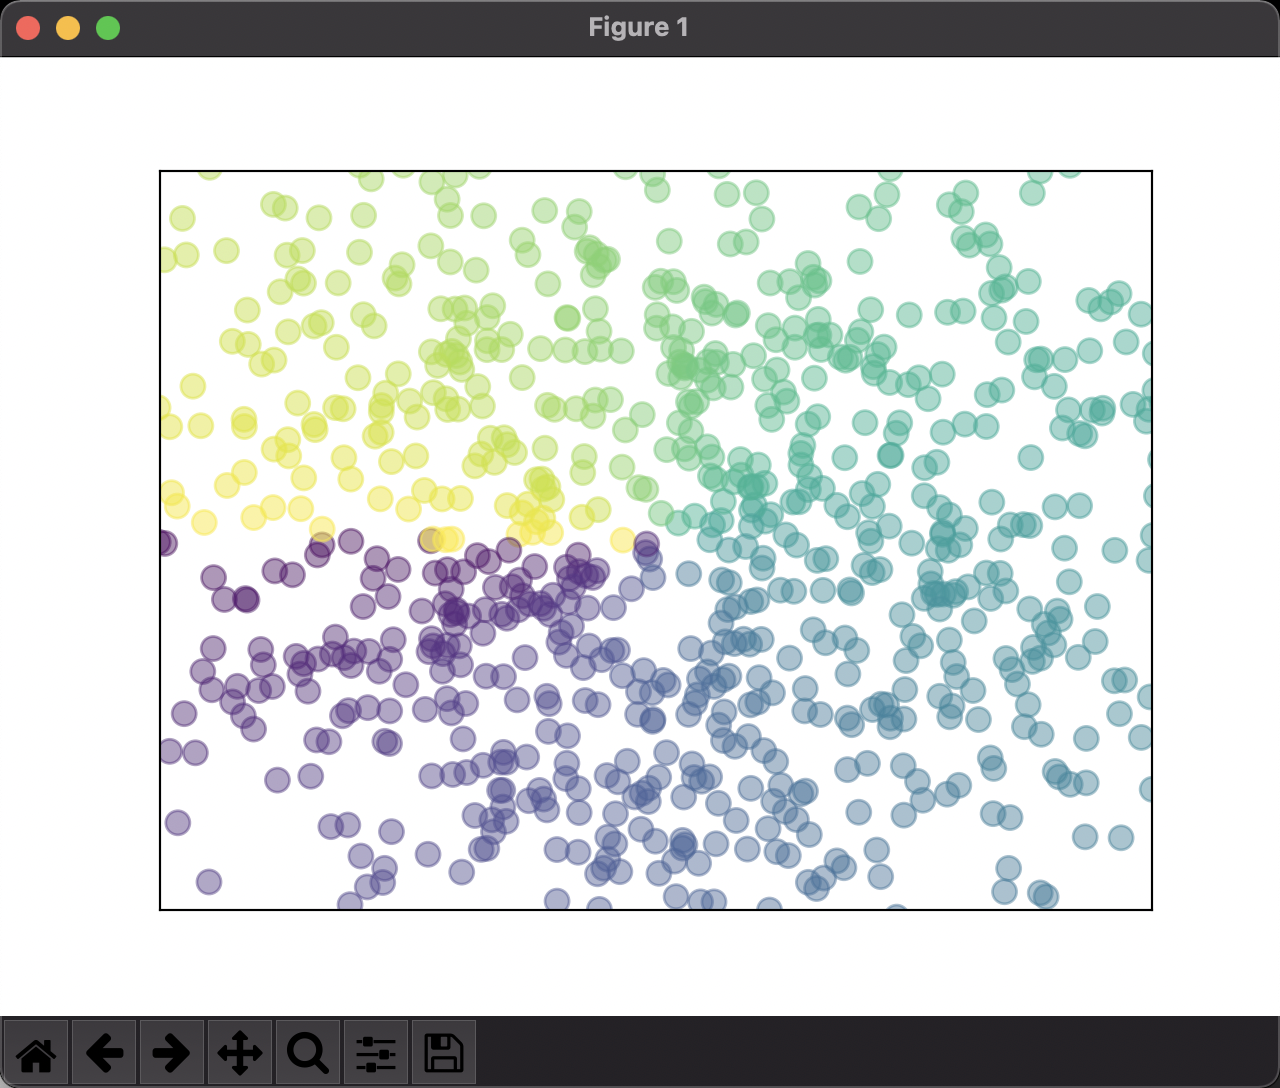
import matplotlib.pyplot as plt
import numpy as np

n = 1024
# 均值为0、方差为1、n个
x = np.random.normal(0, 1, n)
y = np.random.normal(0, 1, n)

# 颜色值
t = np.arctan2(y, x)

plt.scatter(x, y, s=75, c=t, alpha=0.5)
plt.xlim((-1.5, 1.5))
plt.ylim((-1.5, 1.5))

# 隐藏坐标轴标签
plt.xticks(())
plt.yticks(())

plt.show()
Matplotlib 柱状图
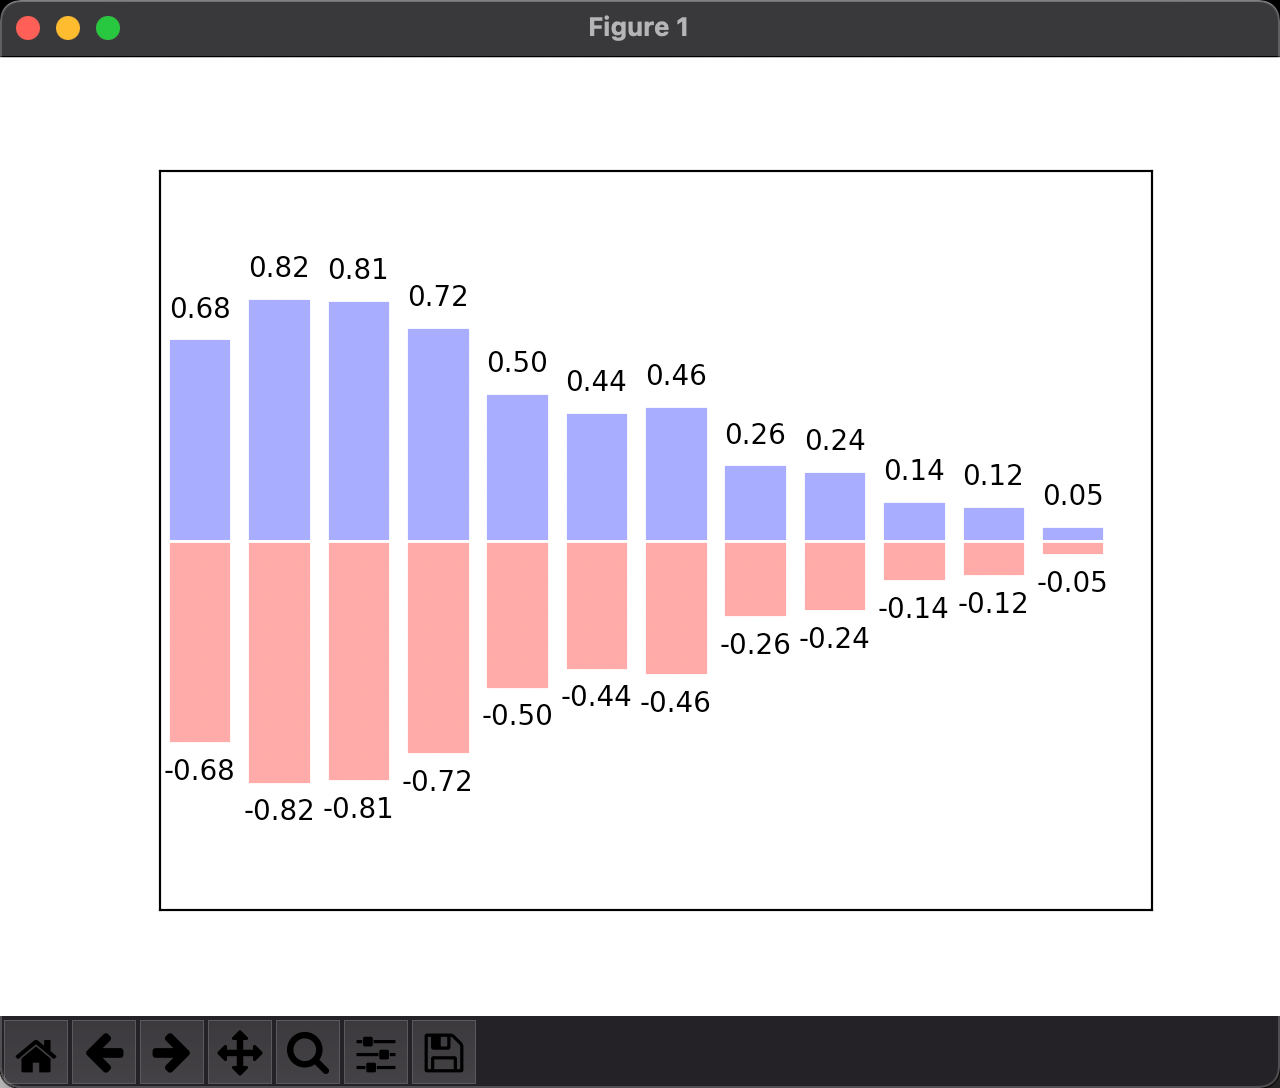
import matplotlib.pyplot as plt
import numpy as np

n = 12
# 均匀分布
x = np.arange(n)
y = (1 - x/float(n)) * np.random.uniform(0.5, 1.0, n)

plt.bar(x, y, facecolor='#9999ff', edgecolor='white')
plt.bar(x, -y, facecolor='#ff9999', edgecolor='white')

# 设置标签
for xv, yv in zip(x, y):
    # ha: 水平对齐
    plt.text(xv, yv+0.05, '%.2f' % yv, ha='center', va='bottom')
    plt.text(xv, -yv-0.05, '%.2f' % -yv, ha='center', va='top')

plt.xlim(-0.5, n)
plt.ylim(-1.25, 1.25)

# 隐藏坐标轴标签
plt.xticks(())
plt.yticks(())

plt.show()
Matplotlib 等高线图
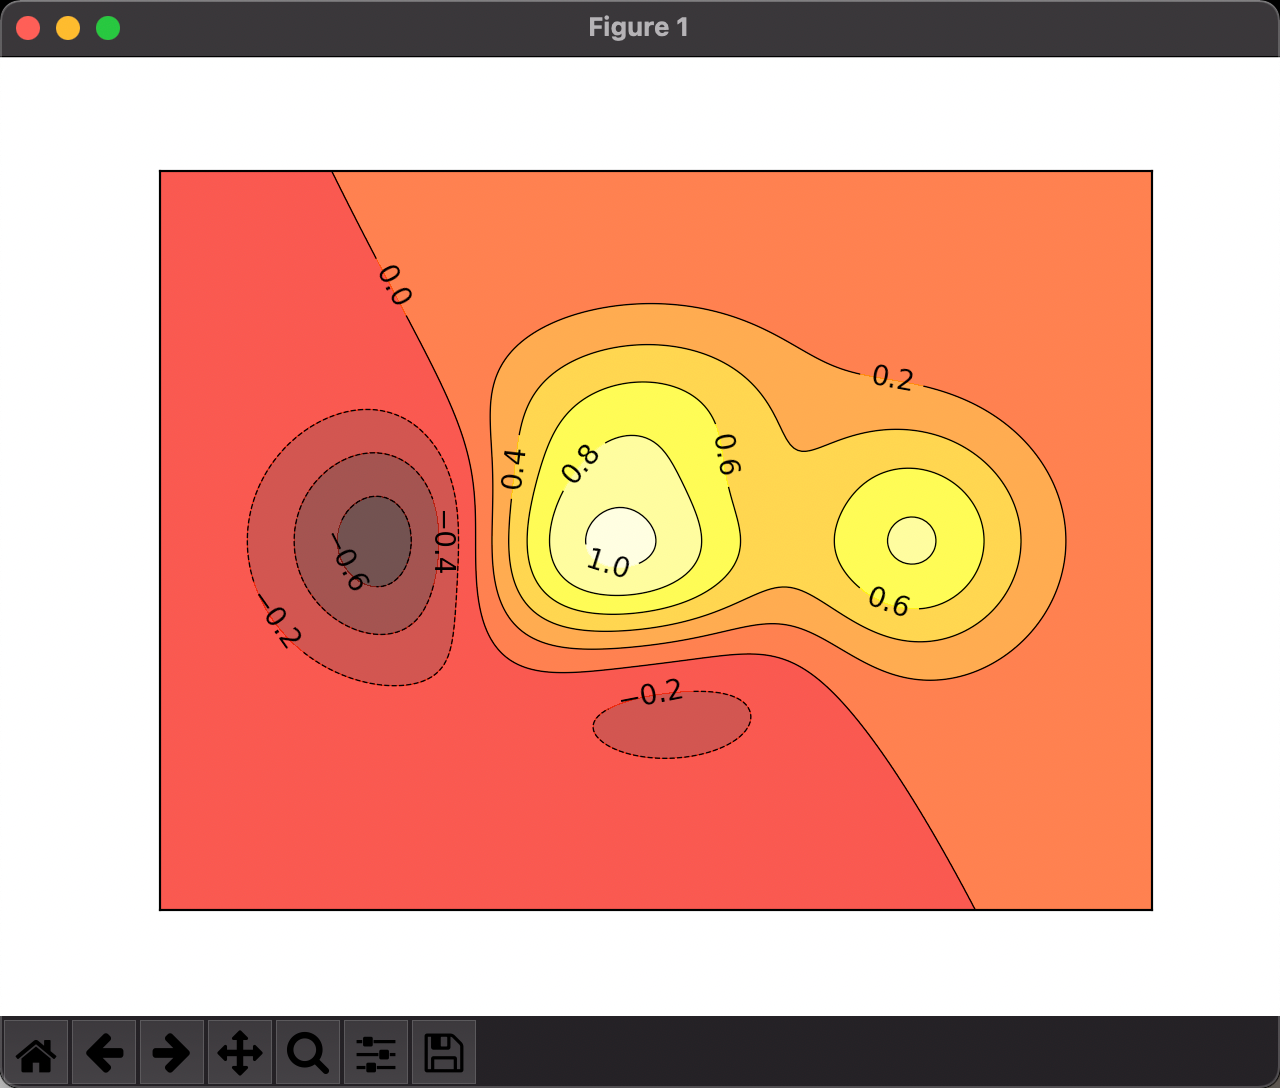
import matplotlib.pyplot as plt
import numpy as np

def getHeight(x, y):
    return (1 - x/2 + x**5 + y**3) * np.exp(-x**2 - y**2)

n = 256
x = np.linspace(-3, 3, n)
y = np.linspace(-3, 3, n)

# 设置网格
X, Y = np.meshgrid(x, y)

# 添加颜色
plt.contourf(X, Y, getHeight(X, Y), 8, alpha=0.75, cmap=plt.cm.hot)

# 添加等高线
C = plt.contour(X, Y, getHeight(X, Y), 8, colors='black', linewidths=0.5)

# 在线旁边添加标签
plt.clabel(C, inline=True, fontsize=10)

# 隐藏坐标轴标签
plt.xticks(())
plt.yticks(())

plt.show()
Matplotlib 图片
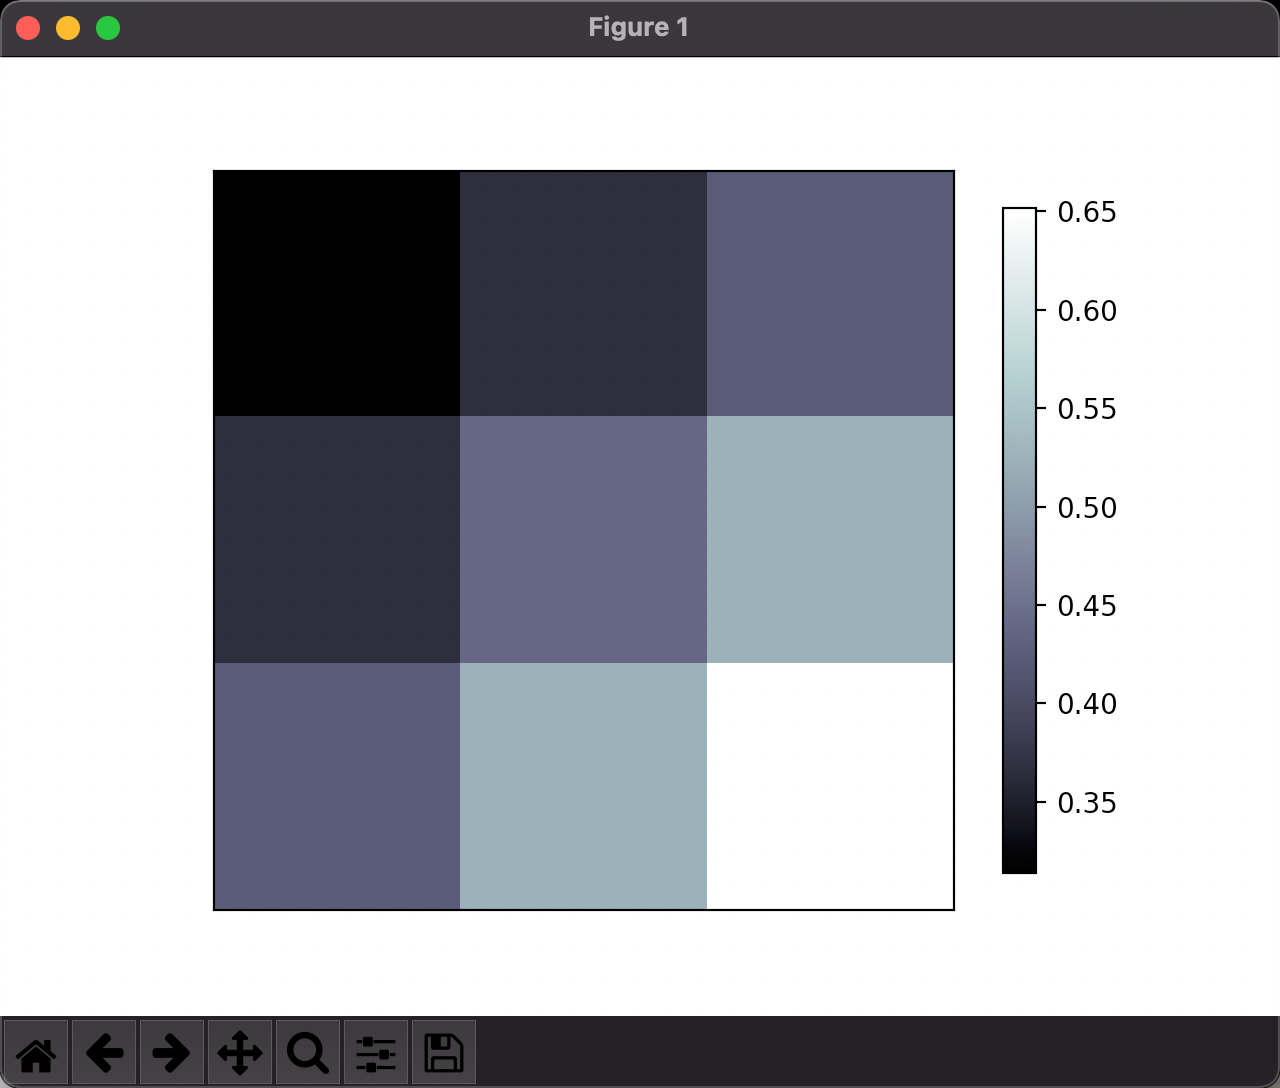
import matplotlib.pyplot as plt
import numpy as np

# image data
a = np.array([0.313660827978, 0.365348418405, 0.423733120134,
              0.365348418405, 0.439599930621, 0.525083754405,
              0.423733120134, 0.525083754405, 0.651536351379]).reshape(3, 3)

plt.imshow(a, interpolation='nearest', cmap='bone', origin='upper')

# 颜色条的长度为90%
plt.colorbar(shrink=0.9)

plt.xticks(())
plt.yticks(())
plt.show()
Matplotlib 3D图形
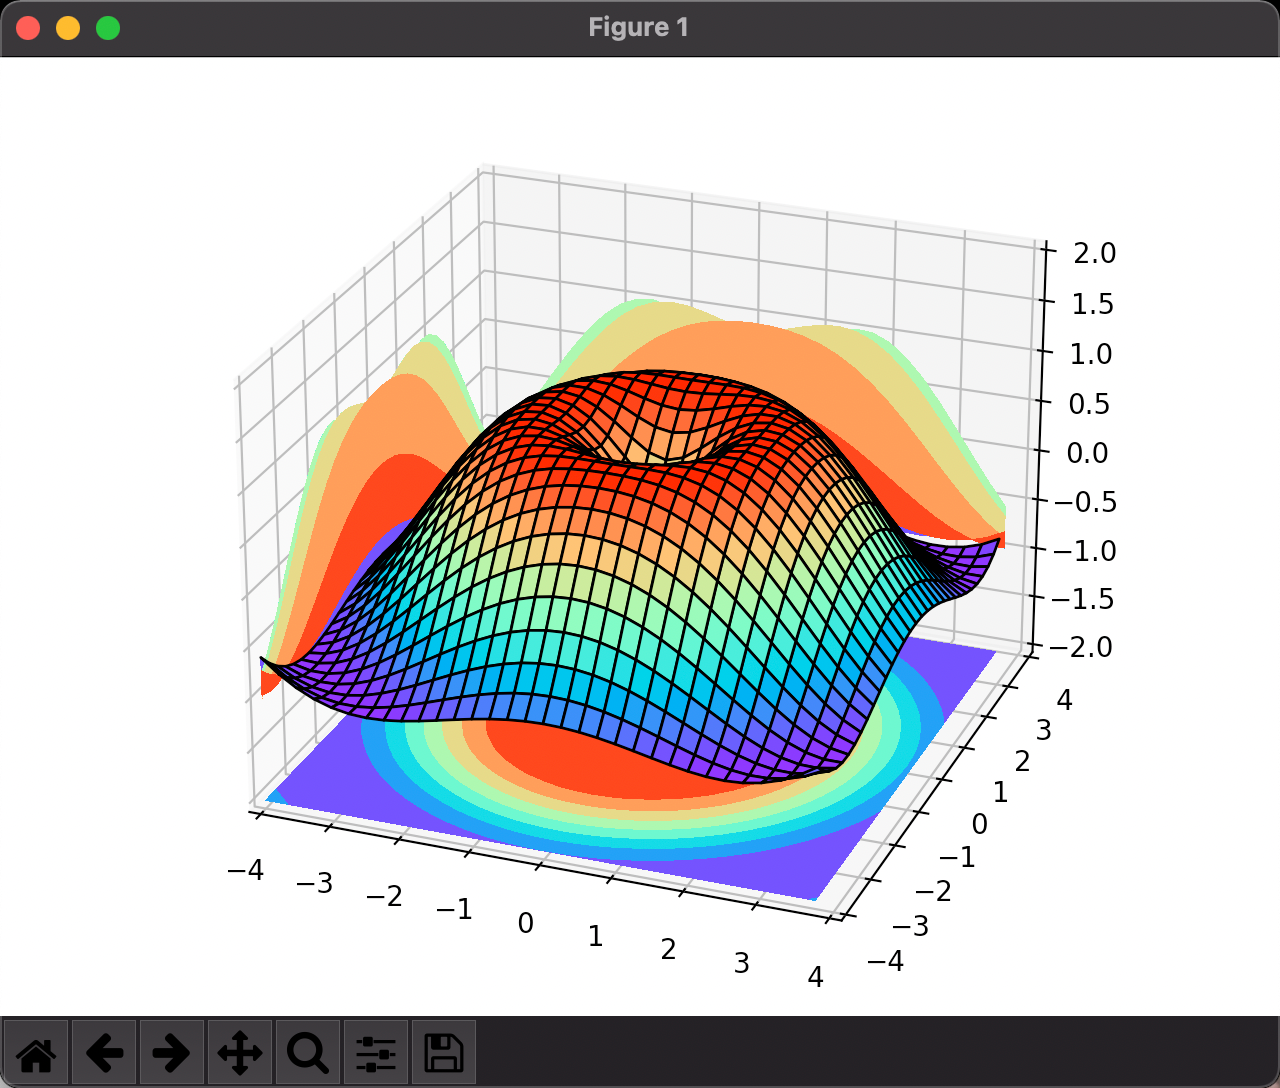
import matplotlib.pyplot as plt
import numpy as np
# 导入3D
from mpl_toolkits.mplot3d import Axes3D

# 显示窗口
fig = plt.figure()

# 添加坐标轴
ax = Axes3D(fig)

# X,Y的值
x = np.arange(-4, 4, 0.25)
y = np.arange(-4, 4, 0.25)
X, Y = np.meshgrid(x, y)
Z = np.sin(np.sqrt(X**2 + Y**2))

# 添加数据: 三个轴的数据;cstride 是线和线的跨度;;edgecolor 显示黑线,默认不显示
ax.plot_surface(X, Y, Z, rstride=1, cstride=1, cmap=plt.get_cmap('rainbow'), edgecolor='black')

# 设置轴
ax.set_xlim(-4, 4)
ax.set_ylim(-4, 4)
ax.set_zlim(-2, 2)

# 加上等高线
# zdir 设置从上压下去,offset 表示压到z=-2这个面上来
ax.contourf(X, Y, Z, zdir='z', offset=-2, cmap='rainbow')
ax.contourf(X, Y, Z, zdir='x', offset=-4, cmap='rainbow')
ax.contourf(X, Y, Z, zdir='y', offset=4, cmap='rainbow')

plt.show()
Matplotlib 一个窗口显示多张子图 Subplot
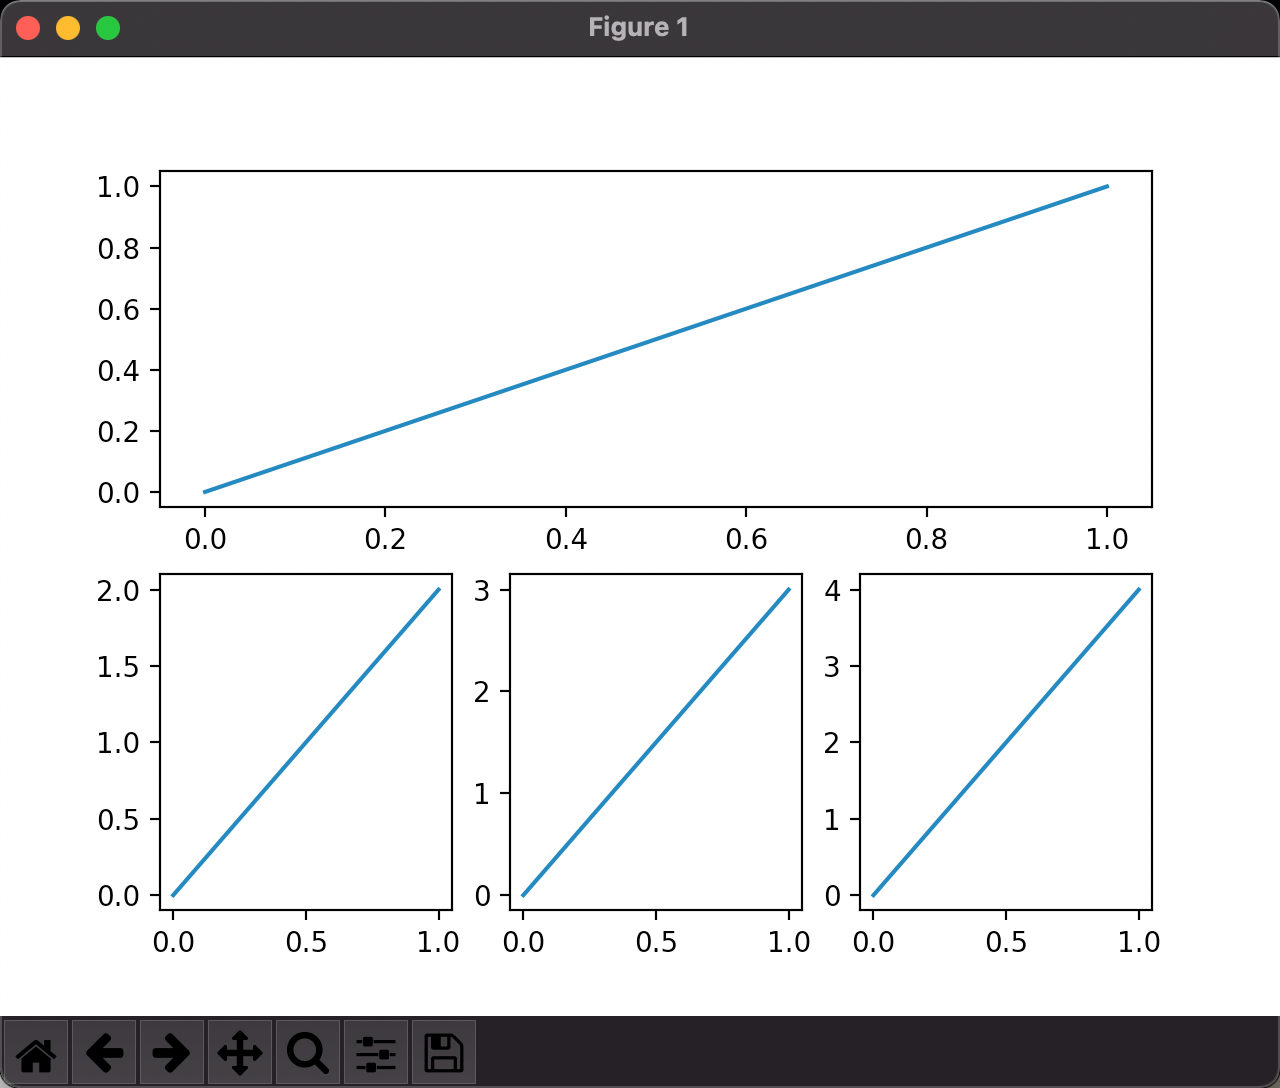
import matplotlib.pyplot as plt
import numpy as np

plt.figure()

# 按2行1列分,这个占一行
plt.subplot(2, 1, 1)
plt.plot([0, 1], [0, 1])

# 按2行3列分,这个在第4个位置,后面依次
plt.subplot(234)
plt.plot([0, 1], [0, 2])
plt.subplot(235)
plt.plot([0, 1], [0, 3])
plt.subplot(236)
plt.plot([0, 1], [0, 4])

plt.show()
Matplotlib 多子图:subplot2grid、girdspec
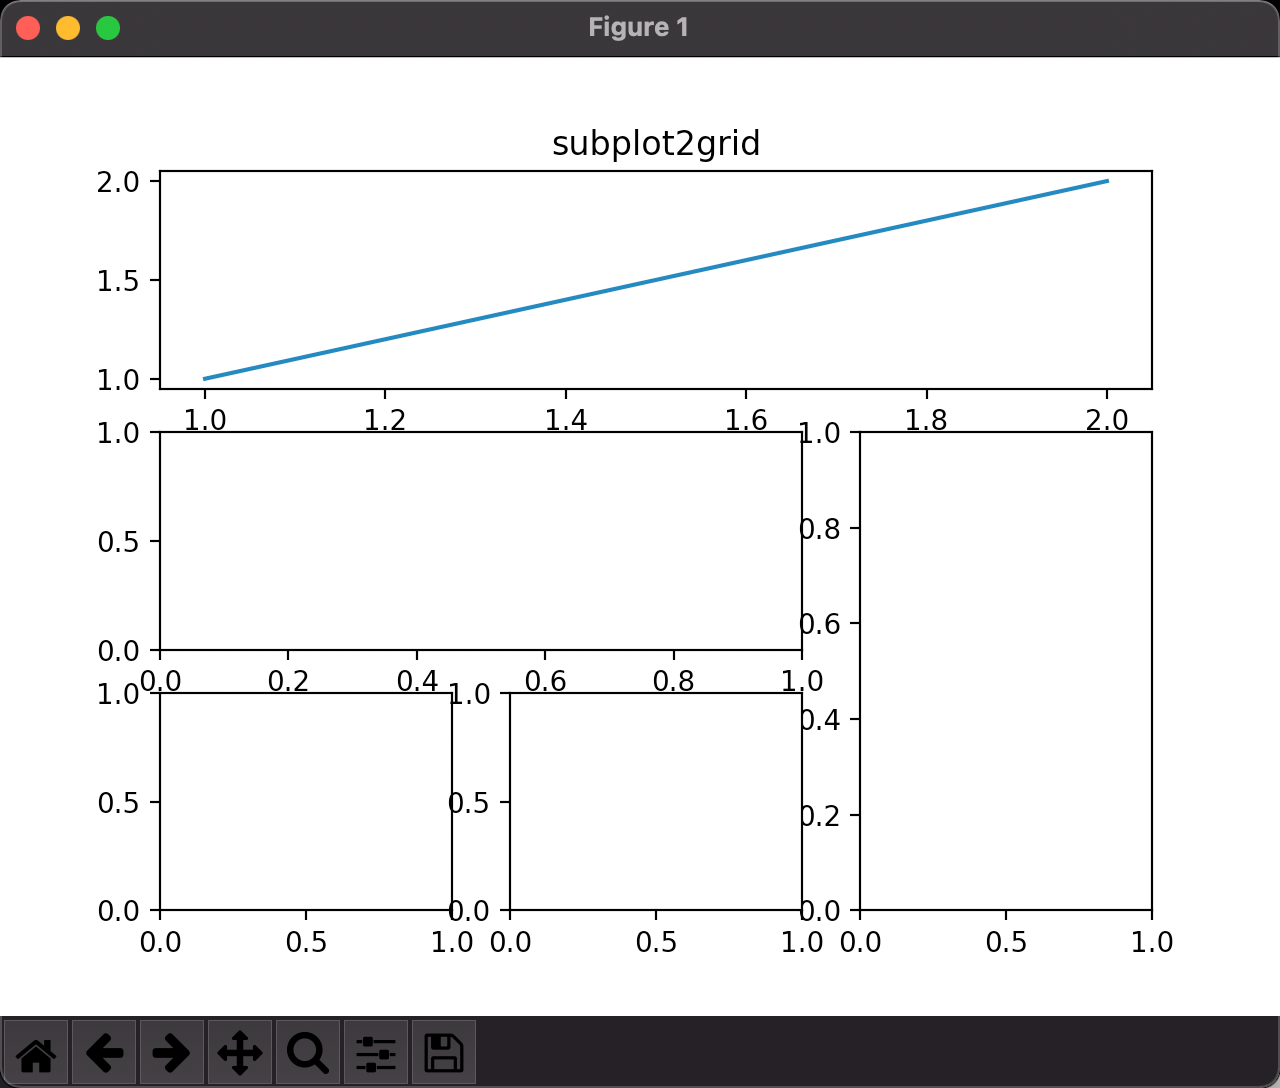
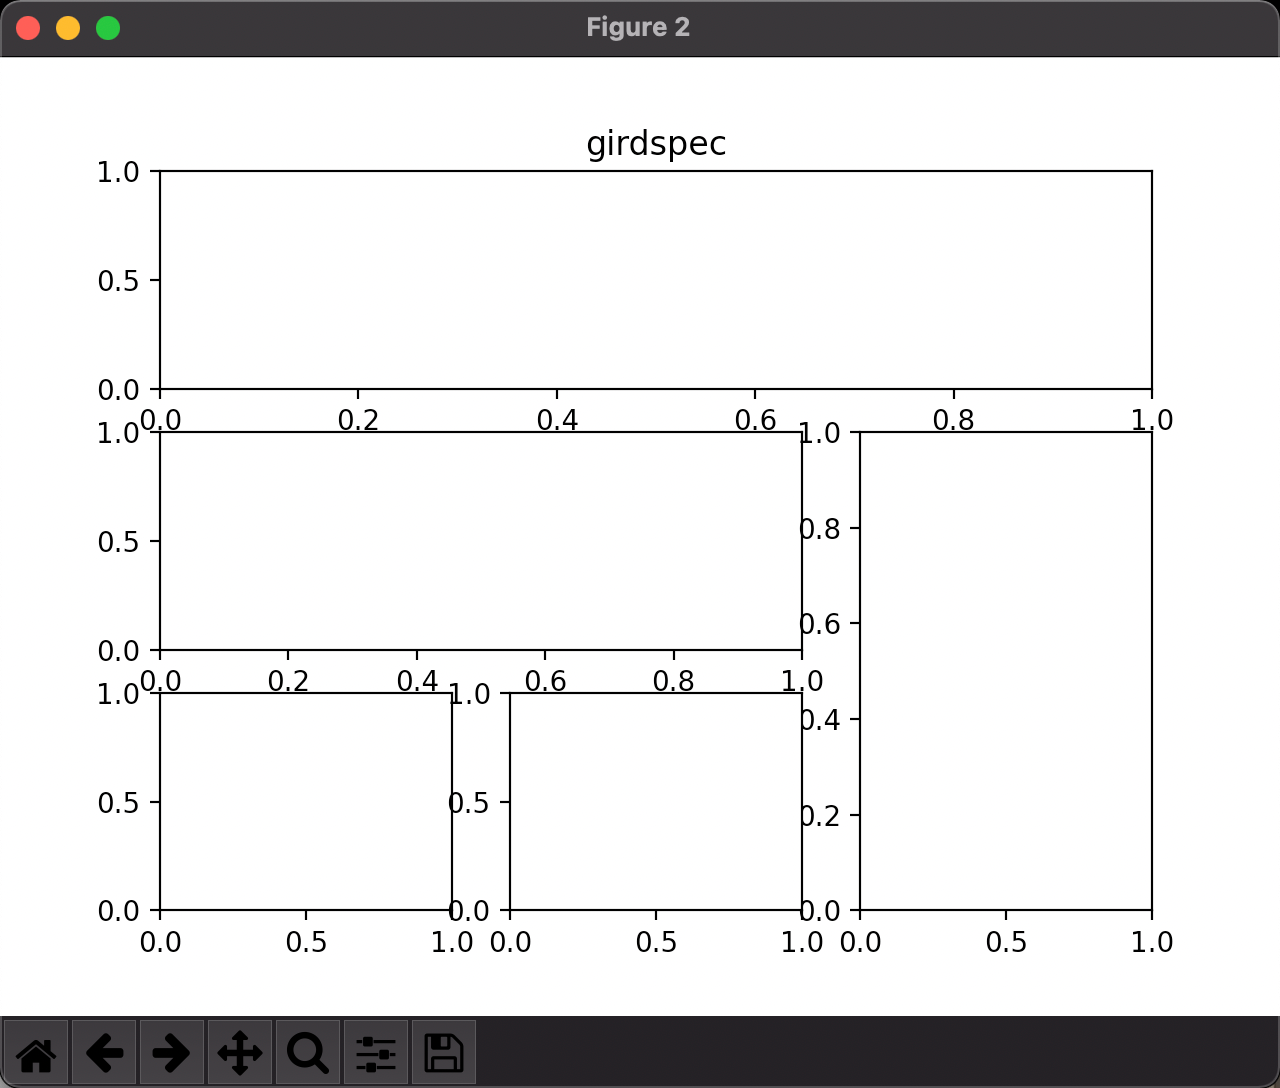
import matplotlib.pyplot as plt
import numpy as np
import matplotlib.gridspec as girdspec

# figure 1
plt.figure()

# 分成3X3,从0,0开始,占1行3列
ax1 = plt.subplot2grid((3, 3), (0, 0), colspan=3, rowspan=1)
ax1.plot([1, 2], [1, 2])
ax1.set_title('subplot2grid')

ax2 = plt.subplot2grid((3, 3), (1, 0), colspan=2, rowspan=1)
ax3 = plt.subplot2grid((3, 3), (1, 2), colspan=1, rowspan=2)
ax4 = plt.subplot2grid((3, 3), (2, 0), colspan=1, rowspan=1)
ax5 = plt.subplot2grid((3, 3), (2, 1), colspan=1, rowspan=1)

# figure 2
plt.figure()
gs = girdspec.GridSpec(3, 3)

# 第一行,全部列;负数是倒着数
ax1 = plt.subplot(gs[0, :])
ax1.set_title('girdspec')
plt.subplot(gs[1, :2])
plt.subplot(gs[1:, 2])
plt.subplot(gs[-1, 0])
plt.subplot(gs[-1, -2])

plt.show()
Matplotlib 图中图
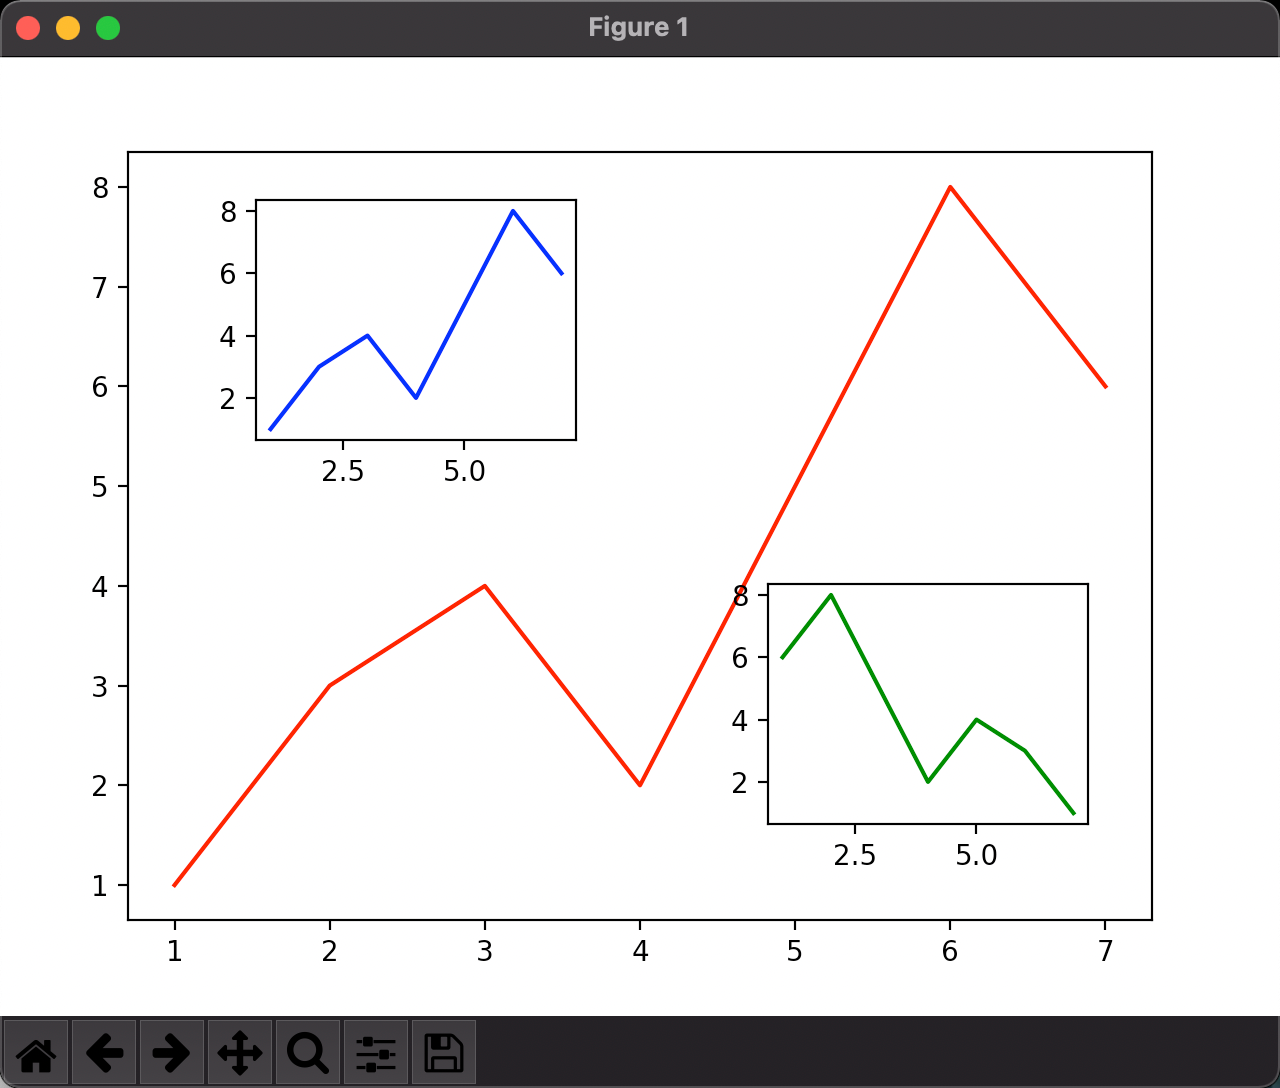
import matplotlib.pyplot as plt
import numpy as np

# figure
fig = plt.figure()
x = np.arange(1, 8)
y = [1, 3, 4, 2, 5, 8, 6]

# 图的大小 百分比 起始位置+宽高
l, b, w, h = 0.1, 0.1, 0.8, 0.8
ax1 = fig.add_axes([l, b, w, h])

# 外面大图
ax1.plot(x, y, 'r')

# 小图 1
l, b, w, h = 0.2, 0.6, 0.25, 0.25
ax2 = fig.add_axes([l, b, w, h])
ax2.plot(x, y, 'b')

# 小图 2
plt.axes([0.6, 0.2, 0.25, 0.25])
# y[::-1] -1表示从后往前,间隔1
plt.plot(x, y[::-1], 'g')

plt.show()
Matplotlib 主次坐标轴
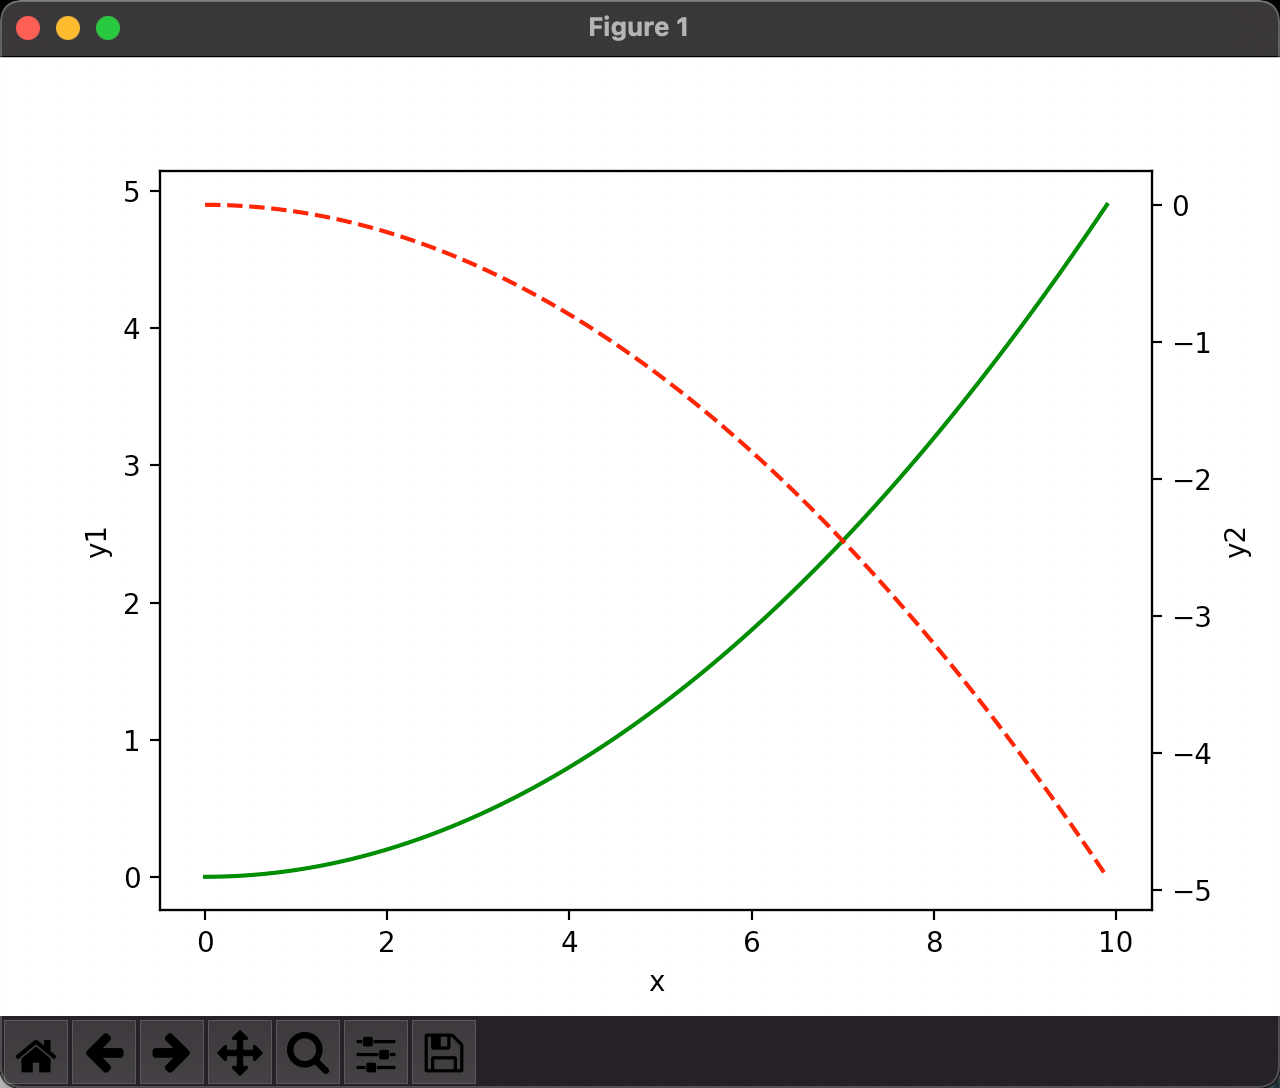
import matplotlib.pyplot as plt
import numpy as np

x = np.arange(0, 10, 0.1)
y1 = 0.05 * x**2
y2 = -1 * y1

fig, ax1 = plt.subplots()

# ax2 用 ax1 的镜像轴
ax2 = ax1.twinx()

ax1.plot(x, y1, 'g-')
ax2.plot(x, y2, 'r--')

ax1.set_xlabel('x')
ax1.set_ylabel('y1')
ax2.set_ylabel('y2')

plt.show()
Matplotlib 动画 Animation
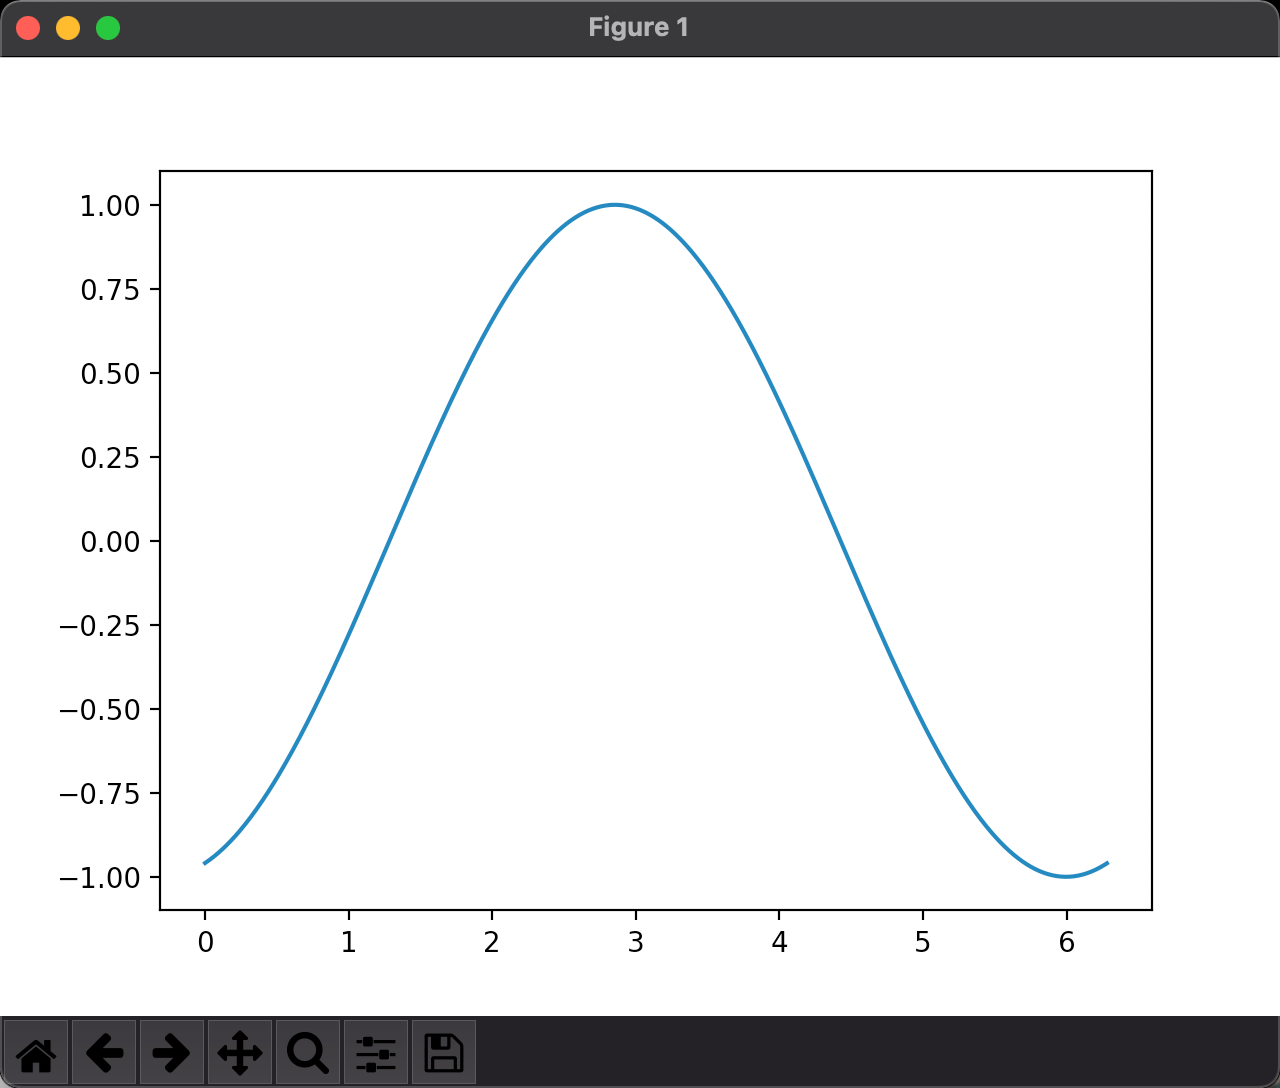
import matplotlib.pyplot as plt
import numpy as np
from matplotlib import animation

x = np.arange(0, 2*np.pi, 0.01)

fig, ax = plt.subplots()
line, = ax.plot(x, np.sin(x))

def animationFunc(i):
    # i 表示第几帧
    line.set_ydata(np.sin(x+i/10))
    return line,

def initAnimationFunc():
    line.set_ydata(np.sin(x))
    return line,

# 创建动画: frames 表示多少帧,init_func 最开始什么样子; interval 频率,多少毫秒; blit 表示是否只更新变动的数据
ani = animation.FuncAnimation(fig=fig, func=animationFunc, frames=100, init_func=initAnimationFunc, interval=20, blit=False)

plt.show()