机器学习-XGBoost
XGBoost的主要优点:
简单易用。相对其他机器学习库,用户可以轻松使用XGBoost并获得相当不错的效果。
高效可扩展。在处理大规模数据集时速度快效果好,对内存等硬件资源要求不高。
鲁棒性强。相对于深度学习模型不需要精细调参便能取得接近的效果。
XGBoost内部实现提升树模型,可以自动处理缺失值。
XGBoost的主要缺点:
相对于深度学习模型无法对时空位置建模,不能很好地捕获图像、语音、文本等高维数据。
在拥有海量训练数据,并能找到合适的深度学习模型时,深度学习的精度可以遥遥领先XGBoost。
代码流程
Part1 基于天气数据集的XGBoost分类实践
Step1: 库函数导入
Step2: 数据读取/载入
Step3: 数据信息简单查看
Step4: 可视化描述
Step5: 对离散变量进行编码
Step6: 利用 XGBoost 进行训练与预测
Step7: 利用 XGBoost 进行特征选择
Step8: 通过调整参数获得更好的效果
算法实践
基于天气数据集的XGBoost分类实战
在实践的最开始,我们首先需要导入一些基础的函数库包括:numpy (Python进行科学计算的基础软件包),pandas(pandas是一种快速,强大,灵活且易于使用的开源数据分析和处理工具),matplotlib和seaborn绘图。
#导入需要用到的数据集
!wget https://tianchi-media.oss-cn-beijing.aliyuncs.com/DSW/7XGBoost/train.csv

step1;库函数导入
##  基础函数库
import numpy as np
import pandas as pd
## 绘图函数库
import matplotlib.pyplot as plt
import seaborn as sns
,现在有一些由气象站提供的每日降雨数据,我们需要根据历史降雨数据来预测明天会下雨的概率。样例涉及到的测试集数据test.csv与train.csv的格式完全相同,但其RainTomorrow未给出,为预测变量。
数据的各个特征描述如下:
特征名称 意义 取值范围
Date 日期 字符串
Location 气象站的地址 字符串
MinTemp 最低温度 实数
MaxTemp 最高温度 实数
Rainfall 降雨量 实数
Evaporation 蒸发量 实数
Sunshine 光照时间 实数
WindGustDir 最强的风的方向 字符串
WindGustSpeed 最强的风的速度 实数
WindDir9am 早上9点的风向 字符串
WindDir3pm 下午3点的风向 字符串
WindSpeed9am 早上9点的风速 实数
WindSpeed3pm 下午3点的风速 实数
Humidity9am 早上9点的湿度 实数
Humidity3pm 下午3点的湿度 实数
Pressure9am 早上9点的大气压 实数
Pressure3pm 早上3点的大气压 实数
Cloud9am 早上9点的云指数 实数
Cloud3pm 早上3点的云指数 实数
Temp9am 早上9点的温度 实数
Temp3pm 早上3点的温度 实数
RainToday 今天是否下雨 No,Yes
RainTomorrow 明天是否下雨 No,Yes
Step2:数据读取/载入
## 我们利用Pandas自带的read_csv函数读取并转化为DataFrame格式

data = pd.read_csv('train.csv')

Step3:数据信息简单查看
## 利用.info()查看数据的整体信息
data.info()

## 进行简单的数据查看,我们可以利用 .head() 头部.tail()尾部
data.head()
这里我们发现数据集中存在NaN,一般的我们认为NaN在数据集中代表了缺失值,可能是数据采集或处理时产生的一种错误。这里我们采用-1将缺失值进行填补,还有其他例如“中位数填补、平均数填补”的缺失值处理方法有兴趣的同学也可以尝试。
data = data.fillna(-1)

data.tail()
	Date	Location	MinTemp	MaxTemp	Rainfall	Evaporation	Sunshine	WindGustDir	WindGustSpeed	WindDir9am	...	Humidity9am	Humidity3pm	Pressure9am	Pressure3pm	Cloud9am	Cloud3pm	Temp9am	Temp3pm	RainToday	RainTomorrow
106639	2011/5/23	Launceston	10.1	16.1	15.8	-1.0	-1.0	SE	31.0	NNW	...	99.0	86.0	999.2	995.2	-1.0	-1.0	13.0	15.6	Yes	Yes
106640	2014/12/9	GoldCoast	19.3	31.7	36.0	-1.0	-1.0	SE	80.0	NNW	...	75.0	76.0	1013.8	1010.0	-1.0	-1.0	26.0	25.8	Yes	Yes
106641	2014/10/7	Wollongong	17.5	22.2	1.2	-1.0	-1.0	WNW	65.0	WNW	...	61.0	56.0	1008.2	1008.2	-1.0	-1.0	17.8	21.4	Yes	No
106642	2012/1/16	Newcastle	17.6	27.0	3.0	-1.0	-1.0	-1	-1.0	NE	...	68.0	88.0	-1.0	-1.0	6.0	5.0	22.6	26.4	Yes	No
106643	2014/10/21	AliceSprings	16.3	37.9	0.0	14.2	12.2	ESE	41.0	NNE	...	8.0	6.0	1017.9	1014.0	0.0	1.0	32.2	35.7	No	No
## 利用value_counts函数查看训练集标签的数量
pd.Series(data['RainTomorrow']).value_counts()

No     82786
,Yes    23858
,Name: RainTomorrow, dtype: int64
我们发现数据集中的负样本数量远大于正样本数量,这种常见的问题叫做“数据不平衡”问题,在某些情况下需要进行一些特殊处理。

## 对于特征进行一些统计描述
data.describe()
Step4:可视化描述
为了方便,我们先纪录数字特征与非数字特征:
numerical_features = [x for x in data.columns if data[x].dtype == np.float]

category_features = [x for x in data.columns if data[x].dtype != np.float and x != 'RainTomorrow']

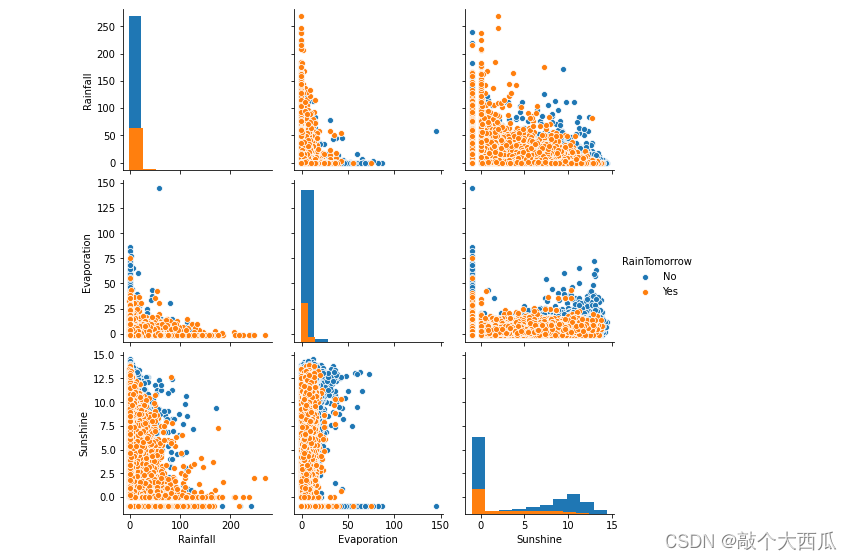
## 选取三个特征与标签组合的散点可视化
sns.pairplot(data=data[['Rainfall',
'Evaporation',
'Sunshine'] + ['RainTomorrow']], diag_kind='hist', hue= 'RainTomorrow')
plt.show()

从上图可以发现,在2D情况下不同的特征组合对于第二天下雨与不下雨的散点分布,以及大概的区分能力。相对的Sunshine与其他特征的组合更具有区分能力
for col in data[numerical_features].columns:
    if col != 'RainTomorrow':
        sns.boxplot(x='RainTomorrow', y=col, saturation=0.5, palette='pastel', data=data)
        plt.title(col)
        plt.show()
利用箱型图我们也可以得到不同类别在不同特征上的分布差异情况。我们可以发现Sunshine,Humidity3pm,Cloud9am,Cloud3pm的区分能力较强
tlog = {}
for i in category_features:
    tlog[i] = data[data['RainTomorrow'] == 'Yes'][i].value_counts()
flog = {}
for i in category_features:
    flog[i] = data[data['RainTomorrow'] == 'No'][i].value_counts(
    ```
plt.figure(figsize=(10,10))
plt.subplot(1,2,1)
plt.title(‘RainTomorrow’)
sns.barplot(x = pd.DataFrame(tlog[‘Location’]).sort_index()[‘Location’], y = pd.DataFrame(tlog[‘Location’]).sort_index().index, color = “red”)
plt.subplot(1,2,2)
plt.title(‘Not RainTomorrow’)
sns.barplot(x = pd.DataFrame(flog[‘Location’]).sort_index()[‘Location’], y = pd.DataFrame(flog[‘Location’]).sort_index().index, color = “blue”)
plt.show()

从上图可以发现不同地区降雨情况差别很大,有些地方明显更容易降雨
plt.figure(figsize=(10,2))
plt.subplot(1,2,1)
plt.title(‘RainTomorrow’)
sns.barplot(x = pd.DataFrame(tlog[‘RainToday’][:2]).sort_index()[‘RainToday’], y = pd.DataFrame(tlog[‘RainToday’][:2]).sort_index().index, color = “red”)
plt.subplot(1,2,2)
plt.title(‘Not RainTomorrow’)
sns.barplot(x = pd.DataFrame(flog[‘RainToday’][:2]).sort_index()[‘RainToday’], y = pd.DataFrame(flog[‘RainToday’][:2]).sort_index().index, color = “blue”)
plt.show()

Step5:对离散变量进行编码
由于XGBoost无法处理字符串类型的数据,我们需要一些方法讲字符串数据转化为数据。一种最简单的方法是把所有的相同类别的特征编码成同一个值,例如女=0,男=1,狗狗=2,所以最后编码的特征值是在 [0,特征数量?1]之间的整数。除此之外,还有独热编码、求和编码、留一法编码等等方法可以获得更好的效果
–把所有的相同类别的特征编码为同一个值
def get_mapfunction(x):
mapp = dict(zip(x.unique().tolist(),
range(len(x.unique().tolist()))))
def mapfunction(y):
if y in mapp:
return mapp[y]
else:
return -1
return mapfunction
for i in category_features:
data[i] = data[i].apply(get_mapfunction(data[i]))
– 编码后的字符串特征变成了数字
data[‘Location’].unique()
array([ 0, 1, 2, 3, 4, 5, 6, 7, 8, 9, 10, 11, 12, 13, 14, 15, 16,
, 17, 18, 19, 20, 21, 22, 23, 24, 25, 26, 27, 28, 29, 30, 31, 32, 33,
, 34, 35, 36, 37, 38, 39, 40, 41, 42, 43, 44, 45, 46, 47, 48])
Step6:利用 XGBoost 进行训练与预测
为了正确评估模型性能,将数据划分为训练集和测试集,并在训练集上训练模型,在测试集上验证模型性能。
from sklearn.model_selection import train_test_split
–选择其类别为0和1的样本 (不包括类别为2的样本)
data_target_part = data[‘RainTomorrow’]
data_features_part = data[[x for x in data.columns if x != ‘RainTomorrow’]]
–测试集大小为20%, 80%/20%分
x_train, x_test, y_train, y_test = train_test_split(data_features_part, data_target_part, test_size = 0.2, random_state = 2020)
– 导入XGBoost模型
from xgboost.sklearn import XGBClassifier
–定义 XGBoost模型
clf = XGBClassifier()
–在训练集上训练XGBoost模型
clf.fit(x_train, y_train)
– 在训练集和测试集上分布利用训练好的模型进行预测
train_predict = clf.predict(x_train)
test_predict = clf.predict(x_test)
from sklearn import metrics
–利用accuracy(准确度)【预测正确的样本数目占总预测样本数目的比例】评估模型效果
print(‘The accuracy of the Logistic Regression is:’,metrics.accuracy_score(y_train,train_predict))
print(‘The accuracy of the Logistic Regression is:’,metrics.accuracy_score(y_test,test_predict))
–查看混淆矩阵 (预测值和真实值的各类情况统计矩阵)
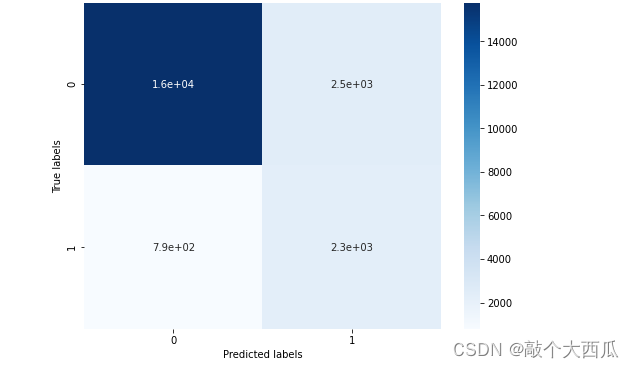
confusion_matrix_result = metrics.confusion_matrix(test_predict,y_test)
print(‘The confusion matrix result:\n’,confusion_matrix_result)
–利用热力图对于结果进行可视化
plt.figure(figsize=(8, 6))
sns.heatmap(confusion_matrix_result, annot=True, cmap=‘Blues’)
plt.xlabel(‘Predicted labels’)
plt.ylabel(‘True labels’)
plt.show()

我们可以发现共有15759 + 2306个样本预测正确,2470 + 794个样本预测错误。
Step7: 利用 XGBoost 进行特征选择
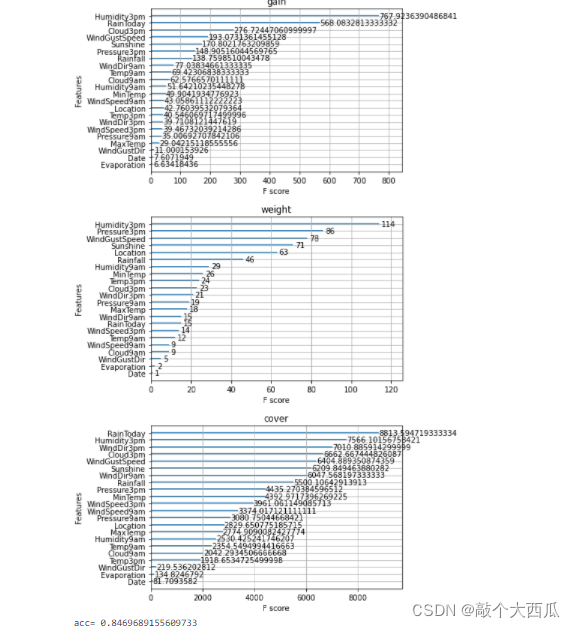
XGBoost的特征选择属于特征选择中的嵌入式方法,在XGboost中可以用属性feature_importances_去查看特征的重要度。
? sns.barplot
sns.barplot(y=data_features_part.columns, x=clf.feature_importances_)

from sklearn.metrics import accuracy_score
from xgboost import plot_importance
def estimate(model,data):
#sns.barplot(data.columns,model.feature_importances_)
ax1=plot_importance(model,importance_type="gain")
ax1.set_title('gain')
ax2=plot_importance(model, importance_type="weight")
ax2.set_title('weight')
ax3 = plot_importance(model, importance_type="cover")
ax3.set_title('cover')
plt.show()
def classes(data,label,test):
model=XGBClassifier()
model.fit(data,label)
ans=model.predict(test)
estimate(model, data)
return ans
ans=classes(x_train,y_train,x_test)
pre=accuracy_score(y_test, ans)
print(‘acc=’,accuracy_score(y_test,ans))

Step8: 通过调整参数获得更好的效果
XGBoost中包括但不限于下列对模型影响较大的参数:
learning_rate: 有时也叫作eta,系统默认值为0.3。每一步迭代的步长,很重要。太大了运行准确率不高,太小了运行速度慢。
subsample:系统默认为1。这个参数控制对于每棵树,随机采样的比例。减小这个参数的值,算法会更加保守,避免过拟合, 取值范围零到一。
colsample_bytree:系统默认值为1。我们一般设置成0.8左右。用来控制每棵随机采样的列数的占比(每一列是一个特征)。
max_depth: 系统默认值为6,我们常用3-10之间的数字。这个值为树的最大深度。这个值是用来控制过拟合的。max_depth越大,模型学习的更加具体。
调节模型参数的方法有贪心算法、网格调参、贝叶斯调参等。这里我们采用网格调参,它的基本思想是穷举搜索:在所有候选的参数选择中,通过循环遍历,尝试每一种可能性,表现最好的参数就是最终的结果
– 从sklearn库中导入网格调参函数
from sklearn.model_selection import GridSearchCV
–定义参数取值范围
learning_rate = [0.1, 0.3, 0.6]
subsample = [0.8, 0.9]
colsample_bytree = [0.6, 0.8]
max_depth = [3,5,8]
parameters = { ‘learning_rate’: learning_rate,
‘subsample’: subsample,
‘colsample_bytree’:colsample_bytree,
‘max_depth’: max_depth}
model = XGBClassifier(n_estimators = 50)
– 进行网格搜索
clf = GridSearchCV(model, parameters, cv=3, scoring=‘accuracy’,verbose=1,n_jobs=-1)
clf = clf.fit(x_train, y_train)
–网格搜索后的最好参数为
clf.best_params_
—在训练集和测试集上分布利用最好的模型参数进行预测
—定义带参数的 XGBoost模型
clf = XGBClassifier(colsample_bytree = 0.6, learning_rate = 0.3, max_depth= 8, subsample = 0.9)
—在训练集上训练XGBoost模型
clf.fit(x_train, y_train)
train_predict = clf.predict(x_train)
test_predict = clf.predict(x_test)
—利用accuracy(准确度)【预测正确的样本数目占总预测样本数目的比例】评估模型效果
print(‘The accuracy of the Logistic Regression is:’,metrics.accuracy_score(y_train,train_predict))
print(‘The accuracy of the Logistic Regression is:’,metrics.accuracy_score(y_test,test_predict))
—查看混淆矩阵 (预测值和真实值的各类情况统计矩阵)
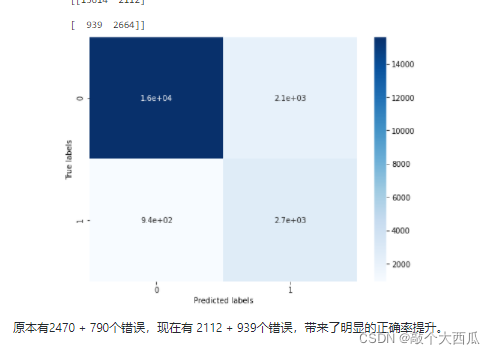
confusion_matrix_result = metrics.confusion_matrix(test_predict,y_test)
print(‘The confusion matrix result:\n’,confusion_matrix_result)
–利用热力图对于结果进行可视化
plt.figure(figsize=(8, 6))
sns.heatmap(confusion_matrix_result, annot=True, cmap=‘Blues’)
plt.xlabel(‘Predicted labels’)
plt.ylabel(‘True labels’)
plt.show()


end