Weight&Biases教程-持续更新
简介
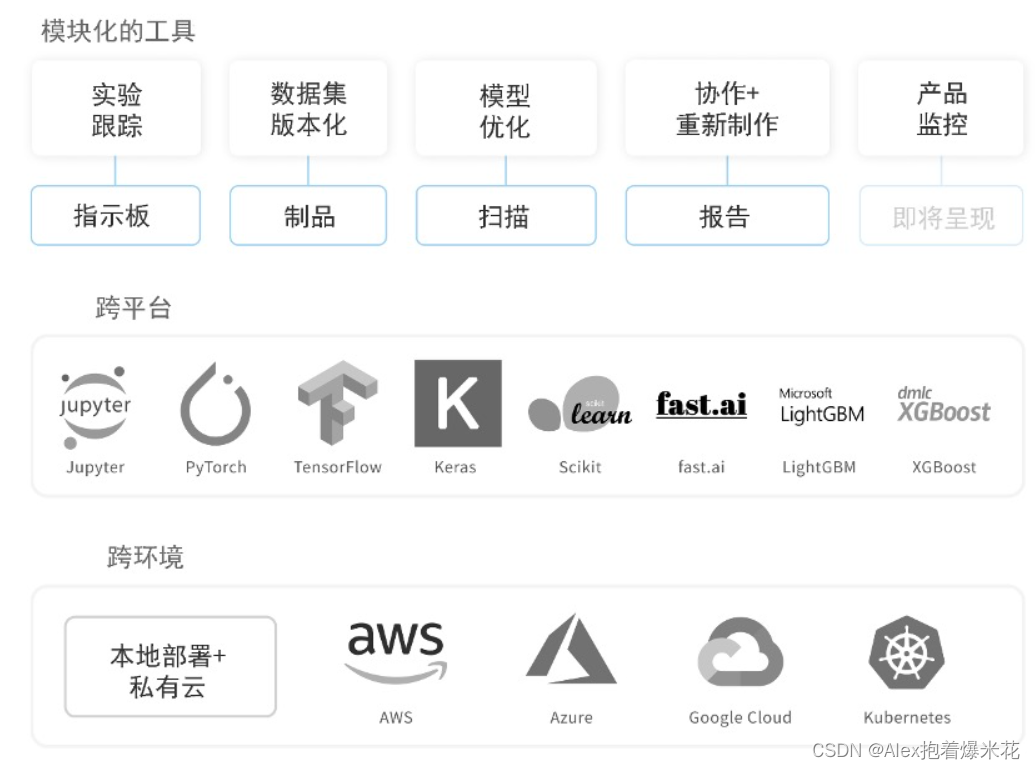
Weights & Biases 可以帮助跟踪你的机器学习项目。使用工具记录运行中的超参数和输出指标(Metric),然后对结果进行可视化和比较,并快速与同事分享你的发现。
好处
首先它和tensorboard的功能类似,但是区别在于可以通过真正的网址随时进行访问,同时他人也能看到你的效果,省去了麻烦的步骤,同时还能方便自己随时随地监工自己的网络运行情况,同时它的sweeps能自己调参优化模型

工具
仪表盘:跟踪实验、可视化结果。
报告:保存和分享可复制的成果/结论。
Sweeps:通过调节超参数来优化模型
Artifacts : 数据集和模型版本化,流水线跟踪。
网址
https://wandb.ai/site,注册一个账号,个人是免费的,然后创建一个项目,然后按照官网提示安装pip install wandb
测试demo
import torch
import torch.nn as nn
import torch.nn.functional as F
import torch.optim as optim
from torchvision import datasets, transforms
import wandb


batch_size = 200
learning_rate = 0.01
epochs = 30

wandb.init(
    # Set the project where this run will be logged
    project=" ",#写自己的
    entity=" ",#写自己的
    # Track hyperparameters and run metadata
    config={
        "learning_rate": learning_rate,
        "architecture": "MLP",
        "dataset": "MNIST",
        "epochs": epochs,
    })

train_loader = torch.utils.data.DataLoader(
    datasets.MNIST('../data', train=True, download=True,
                   transform=transforms.Compose([
                       transforms.ToTensor(),
                       # transforms.Normalize((0.1307,), (0.3081,))
                   ])),
    batch_size=batch_size, shuffle=True)
test_loader = torch.utils.data.DataLoader(
    datasets.MNIST('../data', train=False, transform=transforms.Compose([
        transforms.ToTensor(),
        # transforms.Normalize((0.1307,), (0.3081,))
    ])),
    batch_size=batch_size, shuffle=True)


class MLP(nn.Module):

    def __init__(self):
        super(MLP, self).__init__()

        self.model = nn.Sequential(
            nn.Linear(784, 200),
            nn.LeakyReLU(inplace=True),
            nn.Linear(200, 200),
            nn.LeakyReLU(inplace=True),
            nn.Linear(200, 10),
            nn.LeakyReLU(inplace=True),
        )

    def forward(self, x):
        x = self.model(x)

        return x


device = torch.device('cuda:0')
net = MLP().to(device)
optimizer = optim.SGD(net.parameters(), lr=learning_rate)
criteon = nn.CrossEntropyLoss().to(device)


global_step = 0

for epoch in range(epochs):
    net.train()
    for batch_idx, (data, target) in enumerate(train_loader):
        data = data.view(-1, 28 * 28)
        data, target = data.to(device), target.cuda()

        logits = net(data)
        loss = criteon(logits, target)

        optimizer.zero_grad()
        loss.backward()
        # print(w1.grad.norm(), w2.grad.norm())
        optimizer.step()

        global_step += 1

        if batch_idx % 100 == 0:
            print('Train Epoch: {} [{}/{} ({:.0f}%)]\tLoss: {:.6f}'.format(
                epoch, batch_idx * len(data), len(train_loader.dataset),
                       100. * batch_idx / len(train_loader), loss.item()))
            #展示数据
            wandb.log({"Train loss": loss.item()})
    net.eval()
    test_loss = 0
    correct = 0
    for data, target in test_loader:
        data = data.view(-1, 28 * 28)
        data, target = data.to(device), target.cuda()
        logits = net(data)
        test_loss += criteon(logits, target).item()

        pred = logits.argmax(dim=1)
        correct += pred.eq(target).float().sum().item()

    test_loss /= len(test_loader.dataset)
    print('\nTest set: Average loss: {:.4f}, Accuracy: {}/{} ({:.0f}%)\n'.format(
        test_loss, correct, len(test_loader.dataset),
        100. * correct / len(test_loader.dataset)))
    wandb.log({"Test avg loss":test_loss,"Test acc": 100. * correct / len(test_loader.dataset)})

wandb.finish()
下面是介绍一些基本的使用
登录
在pycharm命令行运行wandb login,输入自己的API key
wandb.init()
默认情况下,wandb.init()会启动一个进程,把指标(Metric)实时同步到云托管应用程序。
- run = wandb.init(reinit=True): 使用这个设置以允许重新初始化运行。
- run.finish(): 在你的运行结束时使用此功能来完成该运行的日志记录
import wandb

run = wandb.init(project="test",
                 entity="coffee_tea",#告诉网址你的身份
                 reinit=True)

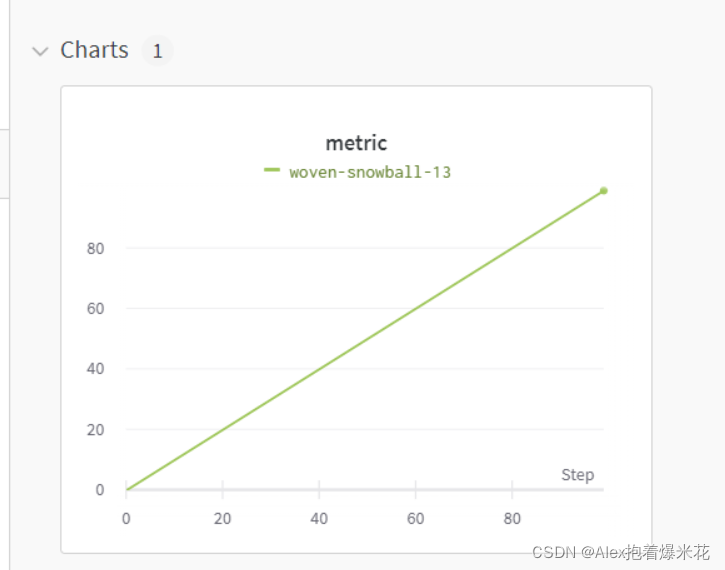
for y in range(100):
    #在网站上可以看到
    wandb.log({"metric": y})
run.finish()

指定id和name
id是本地文件中最后的后缀

name是网站中运行对应名字

通过在init中指定即可
import wandb


run = wandb.init(project="test",
                 entity="coffee_tea",#个人的名称,每个人不同
                 name="ko12",
                 id="qvlp96vk",
                 reinit=True)

for y in range(100):
    wandb.log({"metric": y})
#通过run.的方式访问init里面的属性
print("name:{},id:{}".format(run.name,run.id))
run.finish()
离线使用
如果你的机器离线,或者你无法访问互联网,下面讲述如何以离线模式运行wandb并在稍后同步。
设置两个环境变量:
- WANDB_API_KEY: Set this to your account’s API key, on your settings page
- WANDB_MODE: dryrun
import wandb
import os

os.environ["WANDB_API_KEY"]=" "
os.environ["WANDB_MODE"]="dryrun"
run = wandb.init(project="test",
                 entity="coffee_tea",
                 name="ko12",
                 id="qvlp96vk",
                 reinit=True)

for y in range(100):
    wandb.log({"metric": y})
#通过run.的方式访问init里面的属性
print("name:{},id:{}".format(run.name,run.id))
run.finish()
然后就在本地生成

一旦可以访问互联网,运行一条同步命令即可把该文件夹发送到云端。
wandb sync 文件的绝对路径
wandb sync F:\project2022\test\wandb\offline-run-20220303_193233-qvlp96vk
winda.config
在你的脚本中设置wandb.config对象,以保存你的训练配置:超参数(Hyperparameter)、输入设置(如数据集名称和模型类型),及其他用于实验的独立变量。这对于分析你的实验以及在将来重现你的工作很有用。
你可以在Web界面根据配置值进行分组、比较不同运行的设置以及查看这些配置如何影响输出。要注意,输出指标(Metric)或独立变量(如损失和准确率)应当用wandb.log保存而不是wandb.config。
区别init和config
init是给W&B的配置文件,给网站那边识别和配置信息的。
config是配置超参数,为将来的深度学习做准备!
基本使用
wandb.init(config={"epochs": 4, "batch_size": 32})
# or
wandb.config.update({"epochs": 4, "batch_size": 32})
Argparse 配置
wandb.init()
wandb.config.epochs = 4

parser = argparse.ArgumentParser()
parser.add_argument('-b', '--batch-size', type=int, default=8, metavar='N',
                     help='input batch size for training (default: 8)')
args = parser.parse_args()
wandb.config.update(args) # adds all of the arguments as config variables
使用
import argparse
import wandb
import os

run = wandb.init(project="test",
                 entity="coffee_tea",
                 name="args",
                 id="args",
                 reinit=True)

parser = argparse.ArgumentParser()
parser.add_argument('-b', '--batch-size', type=int, default=8, metavar='N',
                     help='input batch size for training (default: 8)')
args = parser.parse_args()
wandb.config.update(args)
#给config提供超参数
print(run.config)

基于yaml文件的配置
你可以创建一个名为config-defaults.yaml 的文件,它会被自动加载到wandb.config!
# sample config defaults file
epochs:
  desc: Number of epochs to train over
  value: 100
batch_size:
  desc: Size of each mini-batch
  value: 32
肯定我们不会用上面的默认名,假如你有一个test.yaml文件,可以通过wandb.init(config=file_path)方式进行配置
import argparse
import wandb
import os

run = wandb.init(project="test",
                 entity="coffee_tea",
                 name="args",
                 id="args",
                 config="test.yaml",
                 reinit=True)

print(run.config)
基于字典配置
和基于文件配置类似
hyperparameter_defaults = dict(
    dropout = 0.5,
    batch_size = 100,
    learning_rate = 0.001,
    )

wandb.init(config=hyperparameter_defaults)
wandb.log
调用wandb.log(dict)将指标字典或自定义对象记录到一个步(Step)中。每次记录时,我们都会默认递增步长,让你随时间推移查看指标(Metric)。
常用工作流程
比较最佳准确率(Accuracy): 要在不同运行中比较一个指标(Metric)的最佳值,请为该指标设置总结(Summary)值。默认情况下,总结(Summary)设置为你为每个键记录的最后一个值。这在UI中的表格中非常有用,你可以根据其总结指标(Summary Metric)对运行进行排序和过滤——因此,你可以根据其最佳准确率而不是最终准确率在表格或条形图中比较运行。例如,你可以这样设置总结(Summary):
wandb.run.summary["accuracy"] = best_accuracy
一个图上多个指标(Metric):在调用wandb.log()时记录多个指标,例如: wandb.log({‘acc’: 0.9, ‘loss’: 0.1}) ,它们都将可以根据自定义x轴进行绘制。
自定义x轴:在同一个 log 调用中添加一个自定义x轴,以便在W&B 仪表盘中以一个不同的轴来可视化你的指标。
直方图
wandb.log({"gradients": wandb.Histogram(numpy_array_or_sequence)})
wandb.run.summary.update({"gradients": wandb.Histogram(np_histogram=np.histogram(data))})
如果提供的第一个参数是序列,我们会对直方图自动分箱。你也可以将从np.histogram返回的值赋给np_histogram关键字参数来进行自己的分箱。所支持的最大分箱数为512。你可以使用可选的num_bins关键字参数来覆盖默认的64个分箱数。
如果直方图在你的总结(Summary)中,它们将在各运行页面以走势图的形式出现。如果它们在你的历史记录中,我们会绘制一个随时间变化的分箱热图。
图像
wandb.log({"examples": [wandb.Image(numpy_array_or_pil, caption="Label")]})
wandb.log({"example": wandb.Image(...)})
# Or multiple images
wandb.log({"example": [wandb.Image(...) for img in images]})
允许传入numpy数组或PIL数据
如果提交的是一个numpy数组,指定如果最后一维为1,是灰度;如果为3,是RGB;如果为4,是RGBA。如果数组含有浮点数,我们将它们转化为0-255的整数。
或者直接传入一个PIL.Image
im = PIL.fromarray(...)
rgb_im = im.convert('RGB')
rgb_im.save('myimage.jpg')
wandb.log({"example": wandb.Image("myimage.jpg")})
import matplotlib.pyplot as plt

# Generate an image
path_to_img = "examples/examples/data/cafe.jpg"
im = plt.imread(path_to_img)

# Log the image
wandb.log({"img": [wandb.Image(im, caption="Cafe")]})
Matplotlib
import matplotlib.pyplot as plt
plt.plot([1, 2, 3, 4])
plt.ylabel('some interesting numbers')
wandb.log({"chart": plt})
matplotlib
你可以把matplotlib的pyplot或 figure对象传递给wandb.log()。默认情况下,会把该图转化为Plotly图。如果你明确要将该图记录为图像,则可以把该图传给wandb.Image。也接受直接记录Plotly图表
 import matplotlib.pyplot as plt
plt.plot([1, 2, 3, 4])
plt.ylabel('some interesting numbers')
wandb.log({"chart": plt}
递增式记录
如果你想根据不同的x轴绘制你的指标(Metric),你可以将步(Step)作为一个指标(Metric)记录,例如 wandb.log({'loss': 0.1, 'epoch': 1, 'batch': 3}) 。在UI中,你可以在图表设置中切换x轴。
I 如果你想在你的代码中从很多不同的地方记录到一个单一的历史步(Step),你可以传递一个步(Step)索引到wandb.log(),如下所示:
wandb.log({'loss': 0.2}, step=step)
wandb.log({“acc”:1,”batch”:10}, step=epoch)
只要你一直传递相同的步(Step)值,W&B就会把每次调用的键和值收集到一个统一的字典中。只要你在调用wandb.log()时传递的步(step)值和上次不一样了,W&B就会把收集到的键和值写入历史记录,并重新开始收集。注意,你使用该方法时,只能赋给step连续的值:0、1、2……该功能绝不允许你随意写入任意一个历史步(Step),只能写入“当前”的和“下一个”。
你也可以在wandb.log中设置commit=False,以累积指标,只要确保在调用wandb.log时没有commit标记即可持久化指标。
 wandb.log({'loss': 0.2}, commit=False)
# Somewhere else when I'm ready to report this step:
wandb.log({'accuracy': 0.8})
总结指标
总结(summary)统计,用于跟踪每个模型的单一指标。如果总结指标被更改了,只有更新的状态会被保存。除非你手动修改,否则会将总结(summary)自动设置为最后添加的历史行。如果你修改了某个总结(summary)指标,仅保留设置的最后一个值。
wandb.init(config=args)
best_accuracy = 0
for epoch in range(1, args.epochs + 1):
  test_loss, test_accuracy = test()
  if (test_accuracy > best_accuracy):
    wandb.run.summary["best_accuracy"] = test_accuracy
    best_accuracy = test_accuracy
你可能想在训练完成后,将评价指标(Evalution Metrics)保存在运行总结(Summary)中。 summary可以处理numpy数组、pytorch tensors、tensorflow tensors。当某个值属于这些类型之一,我们会把整个tensor保存到一个二进制文件,并把高级指标保存至summary对象,例如最小值、平均值、方差、95%百分位数等等。
api = wandb.Api()
run = api.run("username/project/run_id")
run.summary["tensor"] = np.random.random(1000)
run.summary.update()
自建图表
import wandb
import random
import math

# Start a new run
run = wandb.init(project='custom-charts')
offset = random.random()

# At each time step in the model training loop
for run_step in range(20):

  # Log basic experiment metrics, which show up as standard line plots in the UI
  wandb.log({
      "acc": math.log(1 + random.random() + run_step) + offset,
      "val_acc": math.log(1 + random.random() + run_step) + offset * random.random(),
  }, commit=False)

  # Set up data to log in custom charts
  data = []
  for i in range(100):
    data.append([i, random.random() + math.log(1 + i) + offset + random.random()])

  # Create a table with the columns to plot
  table = wandb.Table(data=data, columns=["step", "height"])

  # Use the table to populate various custom charts
  line_plot = wandb.plot.line(table, x='step', y='height', title='Line Plot')
  histogram = wandb.plot.histogram(table, value='height', title='Histogram')
  scatter = wandb.plot.scatter(table, x='step', y='height', title='Scatter Plot')

  # Log custom tables, which will show up in customizable charts in the UI
  wandb.log({'line_1': line_plot,
             'histogram_1': histogram,
             'scatter_1': scatter})

# Finally, end the run. We only need this ine in Jupyter notebooks.
run.finish()


pytorch 例子
# Start pytorch training
wandb.init(config=args)

for epoch in range(1, args.epochs + 1):
  train_loss = train(epoch)
  test_loss, test_accuracy = test()

  torch.save(model.state_dict(), 'model')

  wandb.log({"loss": train_loss, "val_loss": test_loss})