各种图形代码
1.堆积面积图
import numpy as np
import matplotlib.pyplot as plt
x = np.arange(6)
y1 = np.array([1,2,3,4,5,6])
y2 = np.array([1,3,5,7,9,4])
y3 = np.array([2,4,7,8,9,5])
plt.stackplot(x, y1, y2, y3)
plt.title(‘2020080603021’)
plt.show()

2.直方图
import numpy as np
import matplotlib.pyplot as plt
scores = np.random.randint(0, 100, 50)
plt.hist(scores, bins=8, histtype=‘stepfilled’)
plt.title(‘2020080603021’)
plt.show()

3.灰度直方图
import numpy as np
import matplotlib.pyplot as plt
random_state = np.random.RandomState(19680801)
random_x = random_state.randn(10000)
plt.hist(random_x, bins=25)
plt.title(‘2020080603021’)
plt.show()

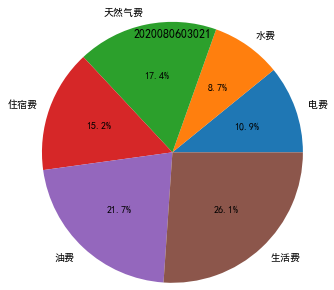
4.饼图
import numpy as np
import matplotlib.pyplot as plt
import matplotlib as mpl
mpl.rcParams[‘font.family’] = ‘SimHei’
mpl.rcParams[‘axes.unicode_minus’] = False
data = np.array([25, 20, 40, 35, 50, 60])
pie_labels = np.array([‘电费’, ‘水费’, ‘天然气费’, ‘住宿费’, ‘油费’, ‘生活费’])
plt.pie(data, radius=1.5, labels=pie_labels, autopct=’%3.1f%%’)
plt.title(‘2020080603021’)
plt.show()
5.圆环图
import numpy as np
import matplotlib.pyplot as plt
import matplotlib as mpl
mpl.rcParams[‘font.family’] = ‘SimHei’
mpl.rcParams[‘axes.unicode_minus’] = False
data = np.array([25, 20, 40, 35, 50, 60])
pie_labels = np.array([‘电费’, ‘水费’, ‘天然气费’, ‘住宿费’, ‘油费’, ‘生活费’])
plt.pie(data, radius=1.5, wedgeprops={‘width’:0.7}, labels=pie_labels, autopct=’%3.1f%%’, pctdistance=0.75)
plt.title(‘2020080603021’)
plt.show()

6.3D饼图
import numpy as np
import matplotlib.pyplot as plt
import matplotlib as mpl
mpl.rcParams[‘font.family’] = ‘SimHei’
mpl.rcParams[‘axes.unicode_minus’] = False
data = np.array([25, 20, 40, 35, 50, 60])
pie_labels = np.array([‘电费’, ‘水费’, ‘天然气费’, ‘住宿费’, ‘油费’, ‘生活费’])
dev_position = [0.1, 0.1, 0.1, 0.1, 0.1, 0.1]
plt.pie(data, labels=pie_labels, autopct=’%3.1f%%’, shadow =True, explode=dev_position, startangle=90)
plt.title(‘2020080603021’)
plt.show()

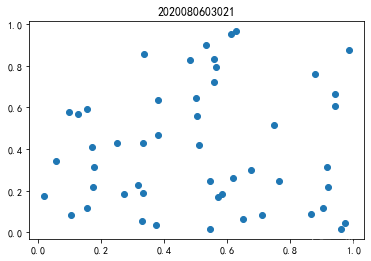
7.散点图
import numpy as np
import matplotlib.pyplot as plt
num = 50
x = np.random.rand(num)
y = np.random.rand(num)
plt.scatter(x, y)
plt.title(‘2020080603021’)
plt.show()
8.气泡图
import numpy as np
import matplotlib.pyplot as plt
num = 50
x = np.random.rand(num)
y = np.random.rand(num)
area = (30 * np.random.rand(num)) **2
plt.scatter(x, y, s=area)
plt.title(‘2020080603021’)
plt.show()

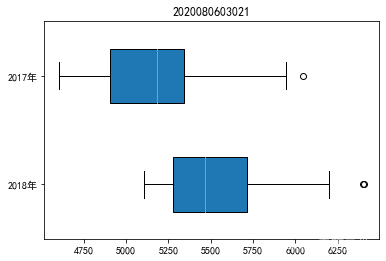
9.横向箱形图
import numpy as np
import matplotlib.pyplot as plt
plt.rcParams[‘font.family’] = ‘SimHei’
plt.rcParams[‘axes.unicode_minus’] = False
data_2018 = np.array([5200, 5254.5, 5283.4, 5107.8, 5443.3, 5550.6, 6400.2, 6404.9, 5483.1, 5330.2, 5543, 6199.9])
data_2017 = np.array([4605.2, 4710.3, 5168.9, 4767.2, 4947, 5203, 6047.4, 5945.5, 5219.6, 5038.1, 5196.3, 5698.6])
plt.boxplot([data_2018, data_2017], labels=(‘2018年’, ‘2017年’), meanline=True, widths=0.5, vert=False, patch_artist=True)
plt.title(‘2020080603021’)
plt.show()
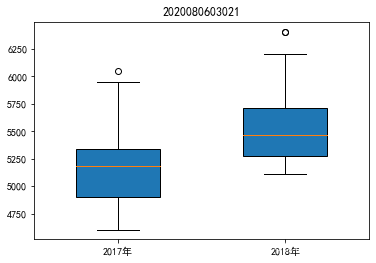
10.竖向箱形图
import numpy as np
import matplotlib.pyplot as plt
plt.rcParams[‘font.family’] = ‘SimHei’
plt.rcParams[‘axes.unicode_minus’] = False
data_2018 = np.array([5200, 5254.5, 5283.4, 5107.8, 5443.3, 5550.6, 6400.2, 6404.9, 5483.1, 5330.2, 5543, 6199.9])
data_2017 = np.array([4605.2, 4710.3, 5168.9, 4767.2, 4947, 5203, 6047.4, 5945.5, 5219.6, 5038.1, 5196.3, 5698.6])
plt.boxplot([data_2017, data_2018], labels=(‘2017年’, ‘2018年’), meanline=True, widths=0.5, vert=True, patch_artist=True)
plt.title(‘2020080603021’)
plt.show()
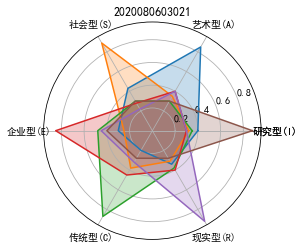
11.雷达图
import numpy as np
import matplotlib.pyplot as plt
plt.rcParams[‘font.family’] = ‘SimHei’
plt.rcParams[‘axes.unicode_minus’] = False
dim_num = 6
data = np.array([[0.40, 0.32, 0.35, 0.30, 0.30, 0.88],
[0.85, 0.35, 0.30, 0.40, 0.40, 0.30],
[0.43, 0.89, 0.30, 0.28, 0.22, 0.30],
[0.30, 0.25, 0.48, 0.85, 0.45, 0.40],
[0.20, 0.38, 0.87, 0.45, 0.32, 0.28],
[0.34, 0.31, 0.38, 0.40, 0.92, 0.28]])
angles = np.linspace(0, 2 * np.pi, dim_num, endpoint=False)
angles = np.concatenate((angles, [angles[0]]))
data = np.concatenate((data, [data[0]]))
radar_labels = [‘研究型(I)’, ‘艺术型(A)’, ‘社会型(S)’,
‘企业型(E)’, ‘传统型?’, ‘现实型?’]
radar_labels = np.concatenate((radar_labels, [radar_labels[0]]))
plt.polar(angles, data)
plt.thetagrids(angles * 180/np.pi, labels=radar_labels)
plt.fill(angles, data, alpha=0.25)
plt.title(‘2020080603021’)
plt.show()
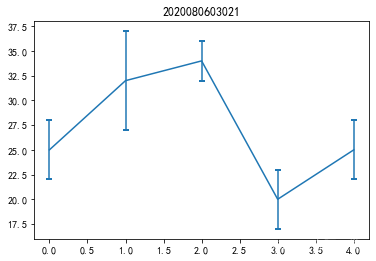
12.误差棒图
import numpy as np
import matplotlib.pyplot as plt
x = np.arange(5)
y = (25, 32, 34, 20, 25)
y_offset = (3, 5, 2, 3, 3)
plt.errorbar(x, y, yerr=y_offset, capsize=3, capthick=2)
plt.title(‘2020080603021’)
plt.show()