matplotlib.pyplot主要用于绘图,其使用方法和matlab中的相关绘图函数很像,事实上他也是仿matlab的相关绘图函数的。
使用的时候要有的意识是:先在画布中绘制好图,再用plt.show()显示图像。
本篇博文记录下其使用例子,以便将来使用时参考。
使用前先导入它,代码如下:
import matplotlib.pyplot as plt
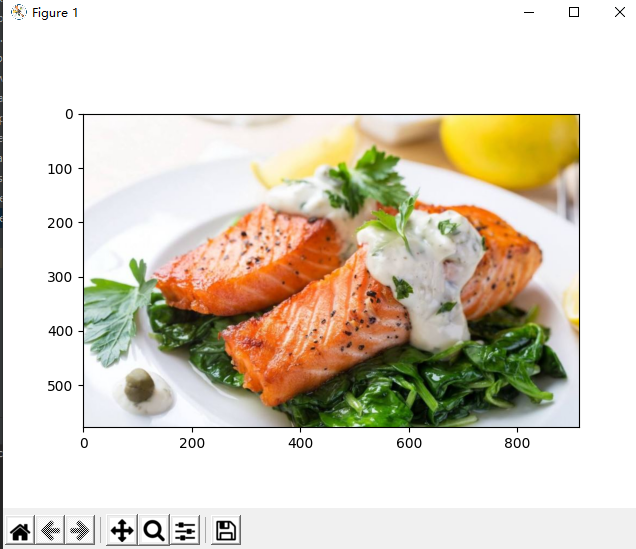
1 实现最简单的绘图,代码如下
        # 因为opencv的颜色通道顺序为[B,G,R],而matplotlib的颜色通道顺序为[R,G,B],所以作图前要先进行通道顺序的调整
        img1 = img1[:, :, (2, 1, 0)]
        plt.imshow(img1)
        plt.show()
运行结果如下:
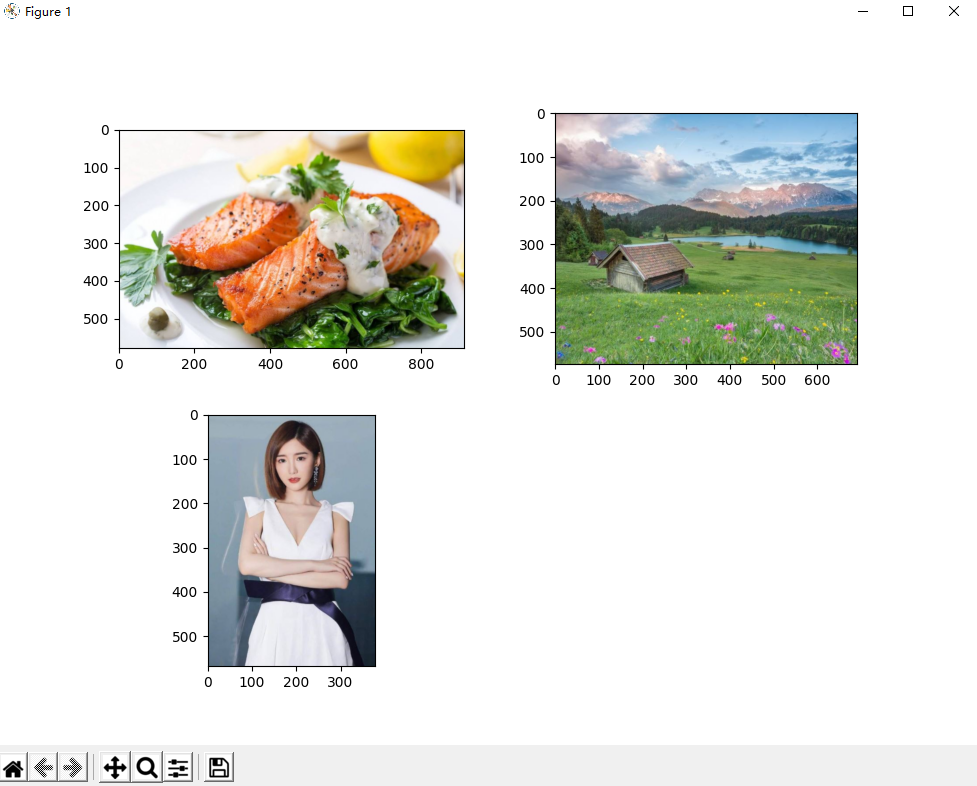
2 同一个画布中绘制多张图像,代码如下:
        # 因为opencv的颜色通道顺序为[B,G,R],而matplotlib的颜色通道顺序为[R,G,B],所以作图前要先进行通道顺序的调整
        img1 = img1[:, :, (2, 1, 0)]
        img2 = img2[:, :, (2, 1, 0)]
        img3 = img3[:, :, (2, 1, 0)]

        plt.subplot(2, 2, 1)  # 将画板分为两行两列,接下来要绘的图位于第一个位置
        plt.imshow(img1)
        plt.subplot(2, 2, 2)  # 将画板分为两行两列,接下来要绘的图位于第一个位置
        plt.imshow(img2)
        plt.subplot(2, 2, 3)  # 将画板分为两行两列,接下来要绘的图位于第一个位置
        plt.imshow(img3)
        plt.show()
代码运行结果如下图所示:
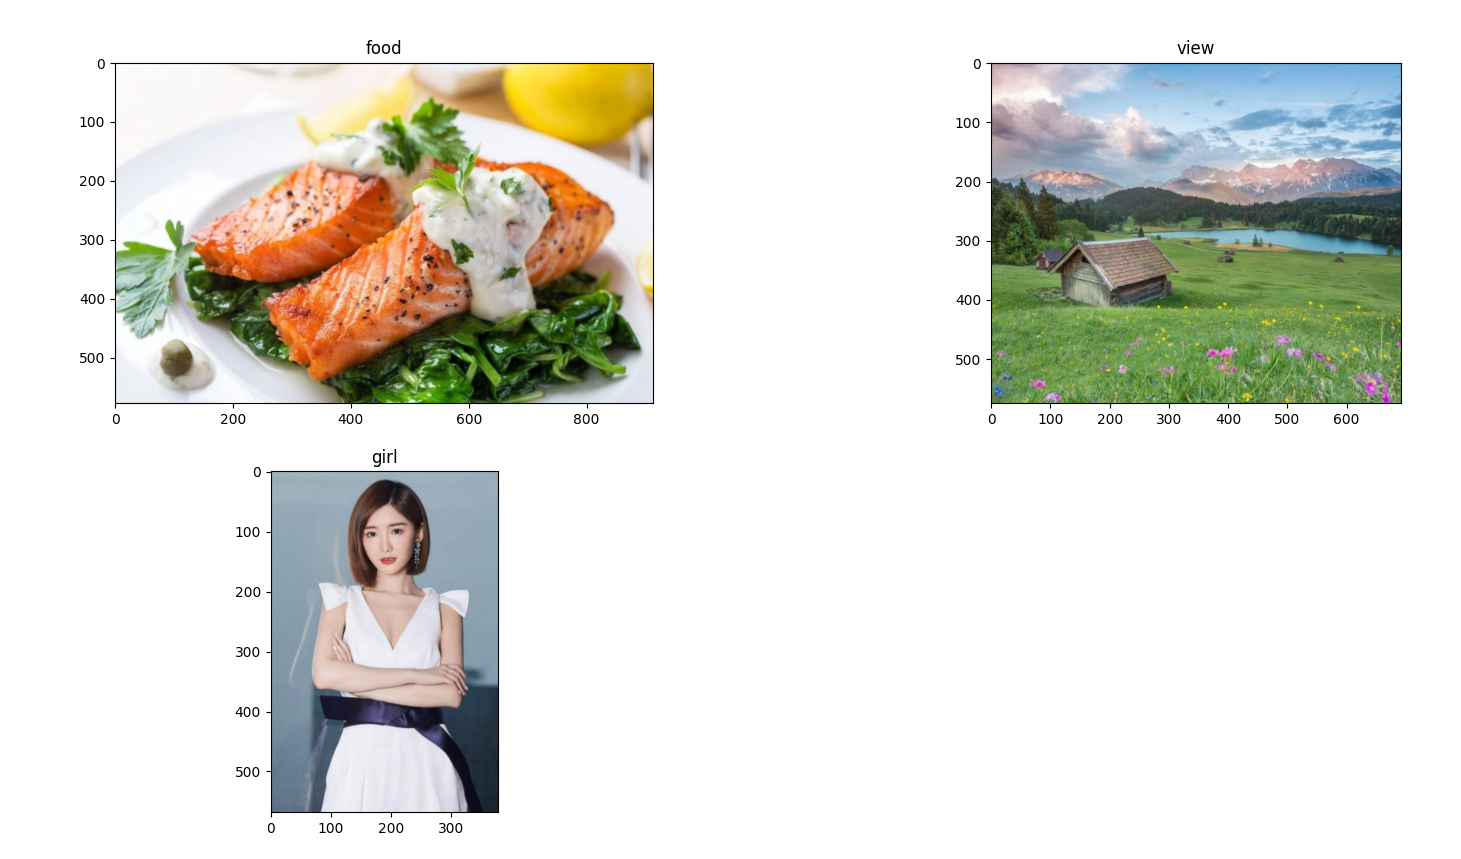
3 给图加上标题,代码如下:
        # 因为opencv的颜色通道顺序为[B,G,R],而matplotlib的颜色通道顺序为[R,G,B],所以作图前要先进行通道顺序的调整
        img1 = img1[:, :, (2, 1, 0)]
        img2 = img2[:, :, (2, 1, 0)]
        img3 = img3[:, :, (2, 1, 0)]

        plt.subplot(2, 2, 1)  # 将画板分为两行两列,接下来要绘的图位于第一个位置
        plt.title('food')
        plt.imshow(img1)
        plt.subplot(2, 2, 2)  # 将画板分为两行两列,接下来要绘的图位于第一个位置
        plt.title('view')
        plt.imshow(img2)
        plt.subplot(2, 2, 3)  # 将画板分为两行两列,接下来要绘的图位于第一个位置
        plt.title('girl')
        plt.imshow(img3)
        plt.show()
运行结果如下图所示:
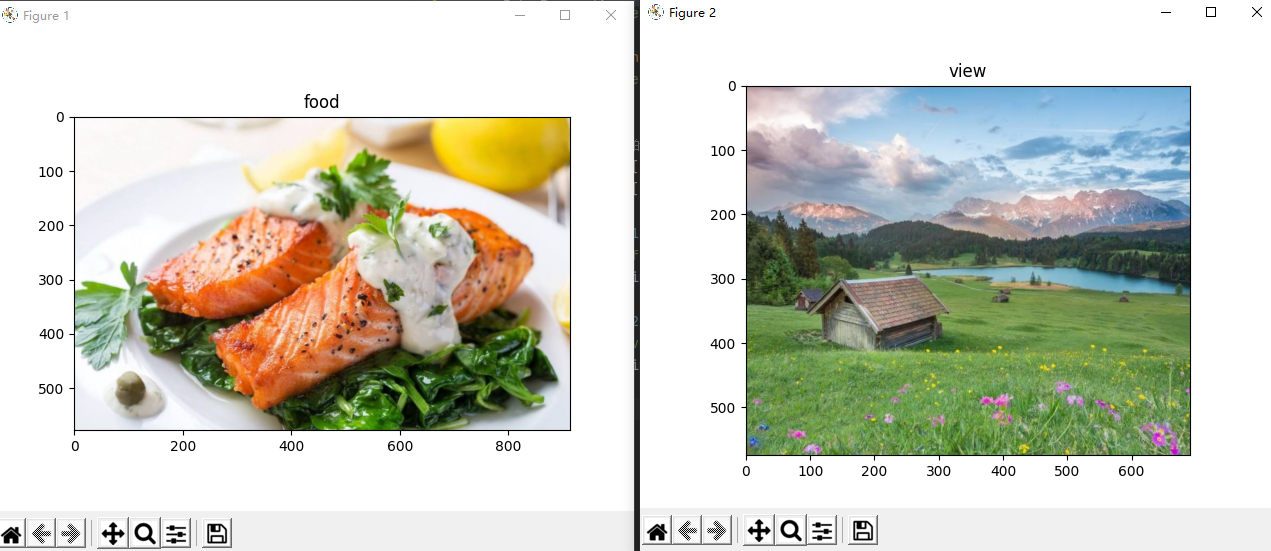
4 用两个画布分别显示两幅图
        # 因为opencv的颜色通道顺序为[B,G,R],而matplotlib的颜色通道顺序为[R,G,B],所以作图前要先进行通道顺序的调整
        img1 = img1[:, :, (2, 1, 0)]
        img2 = img2[:, :, (2, 1, 0)]

        plt.figure(1)  # 第一个画布
        plt.title('food')
        plt.imshow(img1)

        plt.figure(2)  # 第二个画布
        plt.title('view')
        plt.imshow(img2)

        plt.show()