前言
参考 pyecharts官网 了解函数使用方法
1.条件:
- 安装python 3.10
- 安装 jupyter notebook(代码可以分段执行,方便调试)
- 安装一系列数据分析和绘图的包
pip install xxx
2.代码及展示
from matplotlib import colors
from numpy.core.fromnumeric import size
import pandas as pd
import numpy as np
from wordcloud import ImageColorGenerator
import matplotlib.pyplot as plt
import matplotlib.image as img
from matplotlib.font_manager import FontProperties
from datetime import datetime
from pandas import Series, DataFrame
import pyecharts.options as opts
from pyecharts.charts import Timeline, Bar, Pie,Grid,Line,WordCloud,Page,Tab
from pyecharts.commons.utils import JsCode
from pyecharts.components import Table
from pyecharts.globals import ThemeType
data=pd.read_csv('result.csv')#读入数据
# 按列删除:该列非空元素小于5个的,即删除该列
data.dropna(axis='columns', thresh=5)
#print(data[0:2])
| link | current_slice_id | future_slice_id | label | |
|---|---|---|---|---|
| 0 | 685530 | 681 | 693 | 1 |
| 1 | 685530 | 680 | 693 | 1 |
| 2 | 685530 | 670 | 693 | 1 |
| 3 | 685530 | 588 | 590 | 1 |
| 4 | 685530 | 565 | 590 | 1 |
| ... | ... | ... | ... | ... |
| 504886 | 1050 | 329 | 342 | 1 |
| 504887 | 1050 | 313 | 342 | 1 |
| 504888 | 1050 | 291 | 294 | 1 |
| 504889 | 1050 | 289 | 294 | 1 |
| 504890 | 1050 | 285 | 294 | 1 |
504891 rows × 4 columns
720个时间片段,30个时间片段为一个小时,一个时间片段是两分钟
短时预测为10分钟以内,即future_slice_id - current_slice_id < 5
长时预测为30分钟以内,即future_slice_id - current_slice_id < 15
#排序
def sort(data):
    data = data.sort_values(by="future_slice_id",ascending = True)
    #print(data.iloc[0:1000,2])
sort(data)
#print(data.iloc[0:1000].future_slice_id)
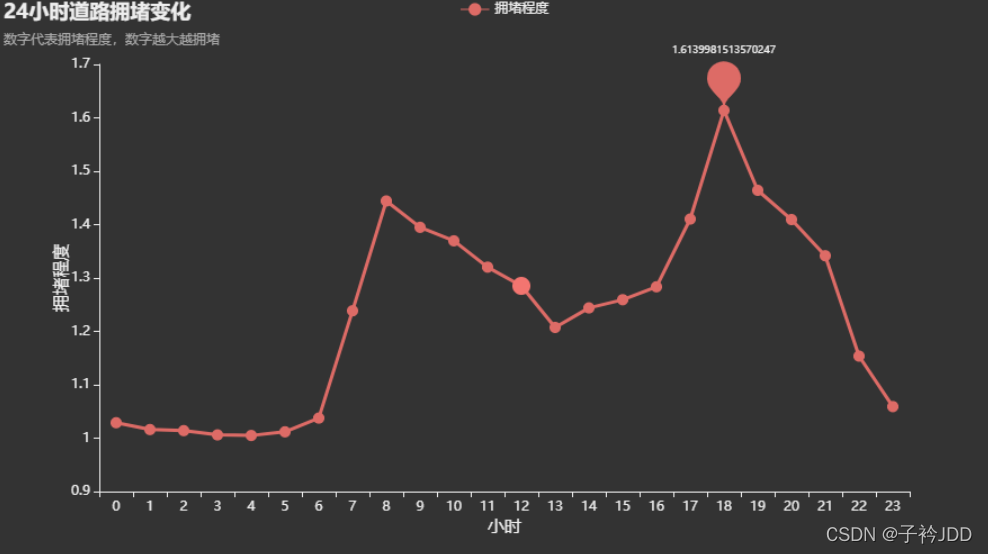
时间序列曲线图
#时间序列曲线图
def Time_series_curve(data):
   # print("正在制作 时间序列曲线图 。。。。。。")
    time = []
    Road = []
    s = []
    o = 0
    groups = data.groupby("future_slice_id")
    for name,group in groups:
        s.append(group['label'].sum()/group.shape[0]) #每时间片段拥堵情况
    for i in range(0,720): #每小时拥堵情况
        o = o + s[i]
        if (i+1)%30 == 0:
            time.append(i//30)
            Road.append(o/30)
            o = 0
    return time,Road
time,Road=Time_series_curve(data)
l=(
    Line(init_opts=opts.InitOpts(theme=#ThemeType.PURPLE_PASSION
                                 ThemeType.DARK,
                                 chart_id="line"

                                )
        )
    .set_global_opts(
        tooltip_opts=opts.TooltipOpts(trigger="axis"),
        title_opts=opts.TitleOpts(title="24小时道路拥堵变化", subtitle="数字代表拥堵程度,数字越大越拥堵"),
        xaxis_opts=opts.AxisOpts(
            name= '小时',
            name_location = 'center',
            name_gap=25,type_="category",
            name_textstyle_opts = opts.TextStyleOpts(font_size = 15)
        ),
        yaxis_opts=opts.AxisOpts(
            name = '拥堵程度',
            name_location = 'center',
            name_gap=25,
            name_rotate = 90,
            name_textstyle_opts = opts.TextStyleOpts(font_size = 15),
            type_="value",
            min_=0.9,
        ),
        datazoom_opts=opts.DataZoomOpts(type_="inside"),
    )
    .add_xaxis(xaxis_data=time)
    .add_yaxis(
        series_name="拥堵程度",
        y_axis=Road,
        symbol="circle",
        symbol_size=10,
        is_symbol_show=True,
        label_opts=opts.LabelOpts(is_show=False),
        markpoint_opts=opts.MarkPointOpts(
            data=[
                opts.MarkPointItem(type_="max", name="最大值")
            ],
            label_opts=opts.LabelOpts( font_size = 9)
        ),
        linestyle_opts = opts.LineStyleOpts(
            width = 3,
        ),

    )
)
#l.render_notebook()
l.render_notebook()

时间轮播 24小时轮播 1:2:3
bar() 条形图 可以反映每个小时拥堵程度
pie() 饼状图 可以反映每个小时拥堵程度比例
# 统计每小时的1\2\3 数量 记录为lable_1_num\lable_2_num\lable_3_num
def get_hour_overlap_chart(hour: int) -> Bar:
    hour_time = data[(data["future_slice_id"]>=30*(hour-1))&(data["future_slice_id"]<(30*hour))]
    label_1_num=hour_time[hour_time["label"]==1].shape[0]
    label_2_num=hour_time[hour_time["label"]==2].shape[0]
    label_3_num=hour_time[hour_time["label"]==3].shape[0]
    #print(label_1_num,label_2_num,label_3_num)
    bar = (
        Bar(init_opts=opts.InitOpts(theme=#ThemeType.PURPLE_PASSION
                                 ThemeType.DARK,
                                 chart_id="bar")
        )
        .add_xaxis(xaxis_data=['畅通','一般','拥堵'])
        .add_yaxis(
            series_name="道路数量",
            y_axis=[label_1_num,label_2_num,label_3_num],
            category_gap="60%",
        )
        .set_global_opts(
            title_opts=opts.TitleOpts(
                title="{}:00-{}:00点总体道路情况".format(hour,hour+1), subtitle="拥堵情况"
            ),
            tooltip_opts=opts.TooltipOpts(
                is_show=True, trigger="axis", axis_pointer_type="shadow"
            ),
            legend_opts = opts.LegendOpts(
                pos_right = "10%",pos_top = "2%"
            )
        )
    )
    pie = (
        Pie()
        .add(
            series_name="畅通,一般,拥堵占比",
            data_pair=[
                ["畅通", label_1_num],
                ["一般", label_2_num],
                ["拥堵", label_3_num],
            ],
            center=["75%", "30%"],
            radius="38%",
        )
        .set_series_opts(
            tooltip_opts=opts.TooltipOpts(is_show=True, trigger="item"),
            legend_opts = opts.LegendOpts(
                pos_right = "10%",pos_top = "2%"
            )
        )
    )
    return bar.overlap(pie)

t = Timeline(init_opts=opts.InitOpts(width="800px", height="600px",theme=#ThemeType.PURPLE_PASSION
                                     ThemeType.DARK
                                    ))

for h in range(1,25):
    t.add(get_hour_overlap_chart(hour=h),time_point=str(h))

t.add_schema(is_auto_play=True, play_interval=1000)
#t.render_notebook()
<pyecharts.charts.composite_charts.timeline.Timeline at 0x1ab3cd29b40>
t.render_notebook() 注释去掉

拥堵路段词云图
#30分钟内
def link_labelaverage(data):
    h = data[(data["future_slice_id"]-data["current_slice_id"]<=15)] #30分钟内
    n=[]
    s=[]
    #每一条路的拥堵程度
    groups = data.groupby(['link'])
    for name,group in groups:
        n.append(name)
        s.append(group['label'].sum()/group.shape[0]) #每时间片段拥堵情况
        #Link_labelAverage.loc[len(Link_labelAverage.index)] = [name,s]
    c={"link" : n,
       "L_aver" : s}#将列表a,b转换成字典
    Link_labelAverage=DataFrame(c)#将字典转换成为数据框
    return Link_labelAverage

def diczip(data):
    Link_labelAverage = link_labelaverage(data)
    Link_labelAverage = Link_labelAverage.sort_values(by="L_aver",ascending=False)  # by指定按哪列排序。ascending表示是否升序
   # print("Link_labelAverage ok")
    n = list(Link_labelAverage ['link'].iloc[0:100])
    s = list(Link_labelAverage ['L_aver'].iloc[0:100])
    for i in range(len(n)):
        n[i] = str(n[i])
      #注意因为要显示中文,所以需要转码
        n[i] = n[i].encode('utf-8').decode('utf-8')
    dic = dict(zip(n,s))
    dic = list(dic.items())
   # print("dic ok")
    return dic
def ciyun():
    #tl = Timeline()
    for i in range(-2,-1): # 数据太多的话会卡,先用少点数据展示一下
        df = data[(data["current_slice_id"] > i*15)&(data["current_slice_id"] <= (i+1)*15)] # i*15<df<(i+1)*15
        wordcloud =(
            WordCloud(init_opts=opts.InitOpts(theme=#ThemeType.PURPLE_PASSION

                                              ThemeType.DARK,
                                            chart_id="wordcloud"
                                             )
                     )
            .add(
                series_name="道路拥堵情况",
                data_pair=diczip(df),
                word_size_range=[6, 66],
                shape =  'circle'
            )
            .set_global_opts(
                title_opts=opts.TitleOpts(
                    #title="{}:{}0-{}:{}0道路拥堵情况词云图".format(((i+48)%48)//2,((i%2)*3),(((i+1)+48)%48)//2,((i+1)%2)*3),
                    title="道路拥堵情况词云图",
                    title_textstyle_opts=opts.TextStyleOpts(font_size=23)
                )
            )
        )

    #wordcloud.render_notebook()
        #tl.add(wordcloud, "{}:{}0-{}:{}0".format(i//2,((i%2)*3),(i+1)//2,((i+1)%2)*3))
        #tl.render_notebook()
    return wordcloud
ciyun()
<pyecharts.charts.basic_charts.wordcloud.WordCloud at 0x1ab3cd29ed0>
wordcloud.render_notebook()

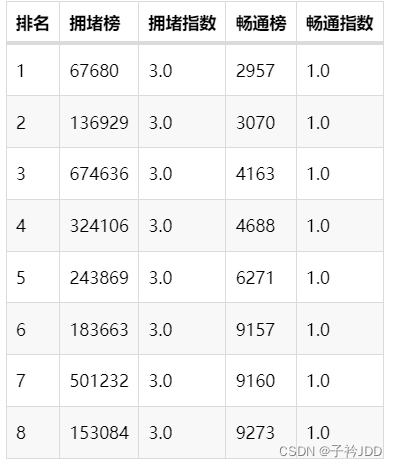
拥堵榜、通畅榜
df = data[(data["current_slice_id"] > (-2)*15)&(data["current_slice_id"] <= (-1)*15)]
tongchang = link_labelaverage(df)
yongdu = tongchang.sort_values(by="L_aver",ascending=False)

paiming = list(str(12345678))
yongdu_l = yongdu.iloc[0:8].link.tolist()
yongdu_z = yongdu.iloc[0:8].L_aver.tolist()
tongchang_l = tongchang.iloc[0:8].link.tolist()
tongchang_z = tongchang.iloc[0:8].L_aver.tolist()
A_y = [paiming,yongdu_l,yongdu_z,tongchang_l,tongchang_z]
B_y=[]
for i in range(len(A_y[0])):#len(A[0])矩阵列数
    temp = []
    for j in range(len(A_y)):#len(A)矩阵行数
        temp.append(A_y[j][i])
    B_y.append(temp)
from pyecharts.components import Table
from pyecharts.options import ComponentTitleOpts
table_y=Table(chart_id='tablename')
headers_y=["排名", "拥堵榜", "拥堵指数", "畅通榜", "畅通指数"]
table_y.add(headers_y,B_y)
#table_y.set_global_opts(
#    title_opts=ComponentTitleOpts(title="拥堵榜单",subtitle="最堵的8条路注意避开")
#)
#table_y.render_notebook()
<pyecharts.components.table.Table at 0x1ab3cd28070>
table_y.render_notebook()

df = data[(data["current_slice_id"] > (-2)*15)&(data["current_slice_id"] <= (-1)*15)]
yongdu_n = (df[df["label"]==3].shape[0])/df.shape[0]
yongdu_day = (data[data["label"]==3].shape[0])/data.shape[0]
#print(yongdu_n)
#print(yongdu_day)
水球图
from pyecharts import options as opts
from pyecharts.charts import Grid, Liquid
from pyecharts.commons.utils import JsCode
#要重视的道路比例
l1 = (
    Liquid()
    .add("30分钟内道路拥堵量",
         [yongdu_n],center=["25%", "50%"] ,
         label_opts=opts.LabelOpts(
         font_size=50,
         formatter=JsCode(
            """function (param) {
                    return (Math.floor(param.value * 10000) / 100) + '%';
                }"""
        ),
        position="inside",
    ),
        )
    .set_global_opts(title_opts=opts.TitleOpts(title="30分钟内道路拥堵量",pos_right='65%',pos_bottom= '15%'))
)

l2 =(
    Liquid()
    .add("今日道路拥堵量",[yongdu_day],
         center=["75%", "50%"] ,
         label_opts=opts.LabelOpts(
         font_size=50,
         formatter=JsCode(
            """function (param) {
                    return (Math.floor(param.value * 10000) / 100) + '%';
                }"""
        ),
        position="inside",
    ),
)
    .set_global_opts(title_opts=opts.TitleOpts(title="今日道路拥堵量",pos_right='17%',pos_bottom= '15%'))
)
g1= Grid(
    init_opts=opts.InitOpts(
        theme=#ThemeType.PURPLE_PASSION
        ThemeType.DARK,
        chart_id  = "grid"
    )
)
g1.add(l1, grid_opts=opts.GridOpts())
g1.add(l2, grid_opts=opts.GridOpts())
#g1.render_notebook()
<pyecharts.charts.composite_charts.grid.Grid at 0x1ab3cd2ae30>
g1.render_notebook()

标题《交通流量预测可视化大屏》
from pyecharts.components import Image
from pyecharts.options import ComponentTitleOpts


image = Image(chart_id='imagename')

img_src = (
   # "https://wx1.sinaimg.cn/mw2000/006WjKlbgy1gzt266p0ycj30d601fjs5.jpg"
    "https://gitee.com/zijin-jdd/jiaotong.io/raw/master/%E5%8F%AF%E8%A7%86%E5%8C%96383434%E3%80%90%E5%89%AA%E8%A3%81%E5%90%8E%E3%80%91.png"
)
image.add(
    src=img_src,
   # style_opts={"width": "1000px", "height": "75px", "style": "margin-top: 20px"},
)

#image.render_notebook()
<pyecharts.components.image.Image at 0x1ab3cd28ca0>
image.render_notebook()

合并
page = Page(layout=Page.DraggablePageLayout)
# 需要自行调整每个 chart 的 height/width,显示效果在不同的显示器上可能不同
page.add(table_y,t,ciyun(),g1,image,l)
page.render("page_simple_layout2.html")
'F:\\Python3.10\\jupyterCode\\page_simple_layout2.html'


调整
调整图片位置,达到像要的效果。save config按了之后,生成位置文件

再执行以下操作
page.save_resize_html( 'page_simple_layout2.html', cfg_file= 'chart_config.json', dest= '大屏展示.html')
最终效果:

我把html文件挂在gitee上了,可查看(修改了一部分的html文件)
https://zijin-jdd.gitee.io/jiaotong.io/
以上代码仅供学习参考。
3.总结
第一次阅读文档(虽然是中文),用了挺长时间,一步一步查函数,改参数,甚至修改了源码来实现想要的效果。不过pyecharts真的好用,生成的图片比matplotlib的图片生动,交互性强。