此篇为机器学习基础,如无Python基础,请移步Python入门系列学习:Python3基础系列博文索引.
1.基础
# 1.数据分析中的数据类型:
# a.数值(Numerical)
#   1.离散数据(Discrete Data):限制为整数的数字;
#   2.连续数据(Continuous Data):具有无限值的数字;
# b.分类(Categorical):无法相互度量的值;
# c.序数(Ordinal):和分类类似,但可以相互度量;

# 2.均值、中值、众数:
#    a.均值(Mean):平均值;
#    b.中值(Median):中位数;
#    c.众数(Mode):最常见的值;

# 均值
import numpy as np

scores = np.array([90, 100, 99, 98, 97, 98, 89, 100, 95, 96, 90])

scores_mean = np.mean(scores)
print("scores的平均值为:", scores_mean)
print("---------------------------------------------------------")

# 中值
student_height = np.array([170, 172, 169, 168, 171, 180, 185])
student_height_median = np.median(student_height)

print("学生身高中值:", student_height_median)
print("---------------------------------------------------------")

# 众数
from scipy import stats

scores1 = np.array([90, 100, 99, 98, 95, 95, 89, 100, 95, 96, 90])
scores1_mode = stats.mode(scores1)
print("分数众数为:", scores1_mode)
# 结果输出:
scores的平均值为: 95.63636363636364
---------------------------------------------------------
学生身高中值: 171.0
---------------------------------------------------------
分数众数为: ModeResult(mode=array([95]), count=array([3]))
# 3.标准差:描述离散程度;
import numpy as np
from scipy import stats

student_scores = np.array([99, 98, 97, 96, 99, 100, 97, 96, 90, 92, 91])

scores_mean = np.mean(student_scores)
scores_median = np.median(student_scores)
scores_mode = stats.mode(student_scores)
scores_std = np.std(student_scores)

print("分数均值:", scores_mean)
print("分数中位数:", scores_median)
print("分数众数:", scores_mode)
print("分数标准差:", scores_std)
print("---------------------------------------------------------")

# 4.方差
scores_var = np.var(student_scores)
print("分数方差:", scores_var)
# 结果输出:
分数均值: 95.9090909090909
分数中位数: 97.0
分数众数: ModeResult(mode=array([96]), count=array([2]))
分数标准差: 3.2600765594620196
---------------------------------------------------------
分数方差: 10.62809917355372
2.直方图
# 5.百分位数:描述给定百分比值小于的值
import numpy as np
import matplotlib.pyplot as plt

student_scores = np.array([99, 98, 97, 96, 99, 100, 97, 96, 90, 92, 91])
scores_percentile100 = np.percentile(student_scores, 100)
scores_percentile95 = np.percentile(student_scores, 95)
scores_percentile85 = np.percentile(student_scores, 85)
scores_percentile80 = np.percentile(student_scores,80)
scores_percentile75 = np.percentile(student_scores, 75)

print("100%的学生分数是:", scores_percentile100)
print("95%的学生分数是:", scores_percentile95)
print("85%的学生分数是:", scores_percentile85)
print("80%的学生分数是:", scores_percentile80)
print("75%的学生分数是:", scores_percentile75)
print("------------------------------------------------------------------")

# 6.数据分布
# 创建包含100个介于0-5的随机浮点数的数组
float_array1 = np.random.uniform(0.0, 5.0, 100)

print("100个介于0-5的随机浮点数的数组:\n", float_array1)

# 绘制直方图
plt.hist(float_array1, 15)  # 绘制15条柱状图;
plt.show()
print("------------------------------------------------------------------")

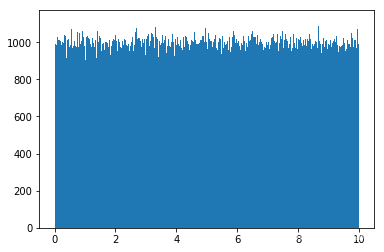
float_array2 = np.random.uniform(0.0, 10.0, 10000000)

plt.hist(float_array2, 10000)
plt.show()
# 结果输出:
100%的学生分数是: 100.0
95%的学生分数是: 99.5
85%的学生分数是: 99.0
80%的学生分数是: 99.0
75%的学生分数是: 98.5
------------------------------------------------------------------
100个介于0-5的随机浮点数的数组:
 [3.55779127 1.0898295  2.88230074 2.91016949 2.70223263 0.5073136
 1.91294576 4.02741398 1.77624827 2.62066579 1.88800846 1.82242203
 0.47935634 1.02495598 0.64864446 0.80027518 0.65393513 1.32705114
 2.95345842 0.45476184 1.77865828 0.3705677  0.20129932 3.97919018
 4.80611527 2.75086995 2.29628742 2.86638662 2.98029015 1.11190308
 3.82370503 4.33425818 2.66986368 2.15876732 3.77721441 3.62689171
 4.07859732 0.82228595 0.39015825 0.34793828 2.58501242 0.29148589
 2.86000172 2.62013179 1.79370237 0.16398119 2.94452524 3.72505094
 1.84285272 1.3931879  2.81048161 0.48507558 0.88914312 3.47251292
 2.72593175 4.45096033 1.78735771 2.56998716 4.16554642 1.73999731
 1.66290151 0.10536236 3.81931982 1.26553089 2.263162   1.89819717
 4.14928293 2.1153283  4.69587509 3.46279032 3.73848111 4.33138596
 0.19568642 3.32156084 4.04812723 1.97195288 1.49315545 3.94315293
 0.01906249 0.5646791  0.51415783 2.42077592 3.49763022 3.05110296
 3.83902844 2.04113564 4.85806299 3.13167761 3.62689246 1.74706561
 1.41927227 2.43478907 3.58531807 0.92286333 2.12511765 2.36192296
 2.91134094 2.83906127 2.19326338 3.29235014]


3.正态分布图
# 7.正态数据分布
import numpy as np
import matplotlib.pyplot as plt

random_array1 = np.random.normal(5.0, 1.0, 10000000)  # 正态分布均值5.0,标准差1.0;

plt.hist(random_array1, 1000)
plt.show()
print("--------------------------------------------------------")

# 8.散点图
car_years = [5,7,8,7,2,17,2,9,4,11,12,9,6,7,8,10,15,16]
car_speed = [99,86,87,88,111,86,103,87,94,78,77,85,86,100,99,90,95,85]

plt.scatter(car_years, car_speed)
plt.show()
print("--------------------------------------------------------")

# 1000000个点散点图
x_array = np.random.normal(5.0, 1.0, 1000000)
y_array = np.random.normal(10.0, 2.0, 1000000)

plt.scatter(x_array, y_array)
plt.show()


4.线性回归
# 9.线性回归
import numpy as np
import matplotlib.pyplot as plt
from scipy import stats

car_years = [5,7,8,7,2,17,2,9,4,11,12,9,6]
car_speed = [99,86,87,88,111,86,103,87,94,78,77,85,86]

slope, intercept, r, p, std_err = stats.linregress(car_years, car_speed)

print("数据在线性回归中的拟合度:", r)

def linregress_func(x):
    return slope * x + intercept

car_10_speed = linregress_func(10)
print("预测一辆拥有10年车龄的汽车速度:", car_10_speed)

linear_model = list(map(linregress_func, car_years))

plt.scatter(car_years, car_speed)
plt.plot(car_years, linear_model)
plt.show()

# 结果输出:
# 数据在线性回归中的拟合度: -0.758591524376155
# 预测一辆拥有10年车龄的汽车速度: 85.59308314937454

5.多项式回归
# 10.多项式回归(Polynomial Regression)
import matplotlib.pyplot as plt
import numpy as np
from sklearn.metrics import r2_score

through_time = [1,2,3,5,6,7,8,9,10,12,13,14,15,16,18,19,21,22]
car_speed = [100,90,80,60,60,55,60,65,70,70,75,76,78,79,90,99,99,100]

mymodel1 = np.poly1d(np.polyfit(through_time, car_speed, 3))
mymodel2 = np.poly1d(np.polyfit(through_time, car_speed, 4))
mymodel3 = np.poly1d(np.polyfit(through_time, car_speed, 5))

myline = np.linspace(1, 22, 100)

plt.scatter(through_time, car_speed)
plt.plot(myline, mymodel1(myline))
plt.title("mymodel1")
plt.xlabel("through_time")
plt.ylabel("car_speed")
plt.show()

plt.scatter(through_time, car_speed)
plt.plot(myline, mymodel2(myline))
plt.title("mymodel1")
plt.xlabel("through_time")
plt.title("mymodel2")
plt.show()

plt.scatter(through_time, car_speed)
plt.plot(myline, mymodel3(myline))
plt.title("mymodel1")
plt.xlabel("through_time")
plt.title("mymodel3")
plt.show()

print("model1拟合度:", r2_score(car_speed, mymodel1(through_time)))
print("model2拟合度:", r2_score(car_speed, mymodel2(through_time)))
print("model3拟合度:", r2_score(car_speed, mymodel3(through_time)))

# 三个模型预测17时过车速度
car_speed1 = mymodel1(17)
car_speed2 = mymodel2(17)
car_speed3 = mymodel3(17)

print("model1预测17时的速度:", car_speed1)
print("model2预测17时的速度:", car_speed2)
print("model3预测17时的速度:", car_speed3)


# 结果输出:
model1拟合度: 0.9432150416451026
model2拟合度: 0.9542030834699506
model3拟合度: 0.9568460139893514
model1预测17时的速度: 88.87331269697985
model2预测17时的速度: 87.21097471965412
model3预测17时的速度: 87.13740700265295
6.多元回归、缩放
# 11.多元回归
import pandas as pd
import numpy as np
import matplotlib.pyplot as plt
from sklearn import linear_model

cars_data = pd.read_csv("cars.csv")

X = cars_data[["Weight", "Volume"]]
y = cars_data["CO2"]

# 创建一个线性回归对象;
regre = linear_model.LinearRegression()
regre.fit(X, y)

# 预测CO2
predictCO2 = regre.predict([[2300, 1300]])
print("重量2300kg,排量1300ccm汽车的CO2排放量:", predictCO2)

# 结果输出:
# 重量2300kg,排量1300ccm汽车的CO2排放量: [107.2087328]
# 12.缩放
# 标准化(standardization):z = (x - u) / s
# z:新值;x:原始值;u:平均值;s:标准差;
# 缩放cars.csv数据集中的Weight和Volume列中的所有值;
import pandas as pd
from sklearn import linear_model
from sklearn.preprocessing import StandardScaler
scale = StandardScaler()

cars_data = pd.read_csv("cars.csv")
X = cars_data[["Weight", "Volume"]]

scaledX = scale.fit_transform(X)
print("原始前10行数据:\n", X[:10])
print("----------------------------")

print("缩放后前10行数据:\n", scaledX[:10])
# 结果输出:
原始前10行数据:
    Weight  Volume
0     790    1000
1    1160    1200
2     929    1000
3     865     900
4    1140    1500
5     929    1000
6    1109    1400
7    1365    1500
8    1112    1500
9    1150    1600
----------------------------
缩放后前10行数据:
 [[-2.10389253 -1.59336644]
 [-0.55407235 -1.07190106]
 [-1.52166278 -1.59336644]
 [-1.78973979 -1.85409913]
 [-0.63784641 -0.28970299]
 [-1.52166278 -1.59336644]
 [-0.76769621 -0.55043568]
 [ 0.3046118  -0.28970299]
 [-0.7551301  -0.28970299]
 [-0.59595938 -0.0289703 ]]
7.训练/测试
# 13.训练/测试
# 将数据集分为:训练集和测试集;
# 80%用于训练,20%用于测试;
import numpy as np
import matplotlib.pyplot as plt
from sklearn.metrics import r2_score
np.random.seed(2)

time_before_shopping = np.random.normal(3, 1, 1000)
money_speed = np.random.normal(150, 40, 1000) / time_before_shopping

plt.scatter(time_before_shopping, money_speed)
plt.title("Initial data")
plt.xlabel("time_before_shopping")
plt.ylabel("money_speed")
plt.show()

# 训练/测试
train_x = time_before_shopping[:800]
train_y = money_speed[:800]

test_x = time_before_shopping[800:]
test_y = money_speed[800:]

# 可视化训练集
plt.scatter(train_x, train_y)
plt.title("Train data")
plt.xlabel("time_before_shopping")
plt.ylabel("money_speed")
plt.show()

# 可视化测试集
plt.scatter(test_x, test_y)
plt.title("Test data")
plt.xlabel("time_before_shopping")
plt.ylabel("money_speed")
plt.show()

print("==============================================================")

model1 = np.poly1d(np.polyfit(train_x, train_y, 3))
model2 = np.poly1d(np.polyfit(train_x, train_y, 4))
model3 = np.poly1d(np.polyfit(train_x, train_y, 5))

myline = np.linspace(0, 7, 1000)

plt.scatter(train_x, train_y)
plt.plot(myline, model1(myline))
plt.title("Model1")
plt.xlabel("time_before_shopping")
plt.ylabel("money_speed")
plt.show()

plt.scatter(train_x, train_y)
plt.plot(myline, model2(myline))
plt.title("Model2")
plt.xlabel("time_before_shopping")
plt.ylabel("money_speed")
plt.show()

plt.scatter(train_x, train_y)
plt.plot(myline, model3(myline))
plt.title("Model3")
plt.xlabel("time_before_shopping")
plt.ylabel("money_speed")
plt.show()

print("==============================================================")

# 训练数据拟合度
model_match1 = r2_score(train_y, model1(train_x))
model_match2 = r2_score(train_y, model2(train_x))
model_match3 = r2_score(train_y, model3(train_x))

print("model1中数据拟合度:", model_match1)
print("model2中数据拟合度:", model_match2)
print("model3中数据拟合度:", model_match3)

print("---------------------------------------------------------------")

# 测试集确定拟合度
test_match1 = r2_score(test_y, model1(test_x))
test_match2 = r2_score(test_y, model2(test_x))
test_match3 = r2_score(test_y, model3(test_x))

print("test_model1中数据拟合度:", test_match1)
print("test_model2中数据拟合度:", test_match2)
print("test_model3中数据拟合度:", test_match3)

print("---------------------------------------------------------------")

# 预测值
print("model1预测停留5分钟,花费:", model1(5))
print("model2预测停留5分钟,花费:", model2(5))
print("model3预测停留5分钟,花费:", model3(5))


# 结果输出:(拟合度均不太好)
model1中数据拟合度: 0.7217325821712026
model2中数据拟合度: 0.7741924031491744
model3中数据拟合度: 0.8054110624472733
---------------------------------------------------------------
test_model1中数据拟合度: 0.6226812568805811
test_model2中数据拟合度: 0.5962872580670096
test_model3中数据拟合度: 0.5892020248634098
---------------------------------------------------------------
model1预测停留5分钟,花费: 40.538606323156614
model2预测停留5分钟,花费: 21.835783087172274
model3预测停留5分钟,花费: 27.73065855759296