1. 什么是多维尺度分析MDS
本质上是一种降维方法,让高维数据在低维尺度上直观展示,便于观察其中的差异(距离)。
2. MDS实现步骤
step1:获取数据,行是每一个数据,列是每个特征
step2:以两列(特征)作为差异(距离)的计算标准,计算每个数据两两之间的距离
step3:应用MDS对每个数据进行可视化,直观表现数据差异(距离)
step4:找到最佳维度数量,重新对数据进行可视化
step5:模型效果评价
3. 代码
引入包和数据,本数据共76行,24列,每行是一个数据,最后两列是经纬度特征。
install.packages(c("Rling", "fields", "rgl", "MASS"))
library(Rling); library(fields); library(rgl); library(MASS)
data(eWAVE)
计算数据两两之间的距离,应用MDS,返回每个数据的低维坐标及特征值,可视化前20维的解释力:
geo.dist <- rdist.earth(eWAVE[, 23:24], miles = FALSE)
geo.dist <- as.dist(geo.dist)
geo.mds <- cmdscale(geo.dist, eig = TRUE) #equivalent to cmdscale(geo.dist, k = 2, eig = TRUE)
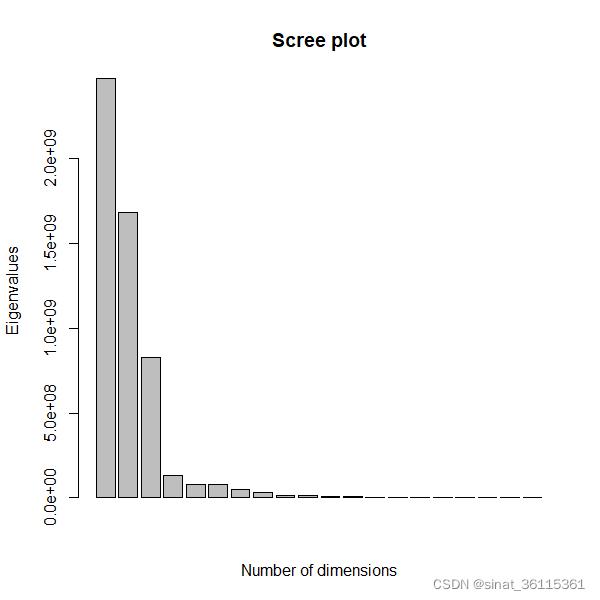
barplot(geo.mds$eig[1:20], xlab = "Number of dimensions", ylab = "Eigenvalues", main = "Scree plot")

图中可以看出三个维度后解释力大幅下降,所以三维解是最优解。在这先继续以二维展示,后续再做三维的。下面展示MDS后各个数据的距离可视化结果。
plot(geo.mds$points, type = "n", main = "MDS of geographic distances between varieties of English")
text(geo.mds$points, labels = rownames(eWAVE), cex = 0.6)

可以发现各个数据的远近,越近差异越小,越远差异越大。
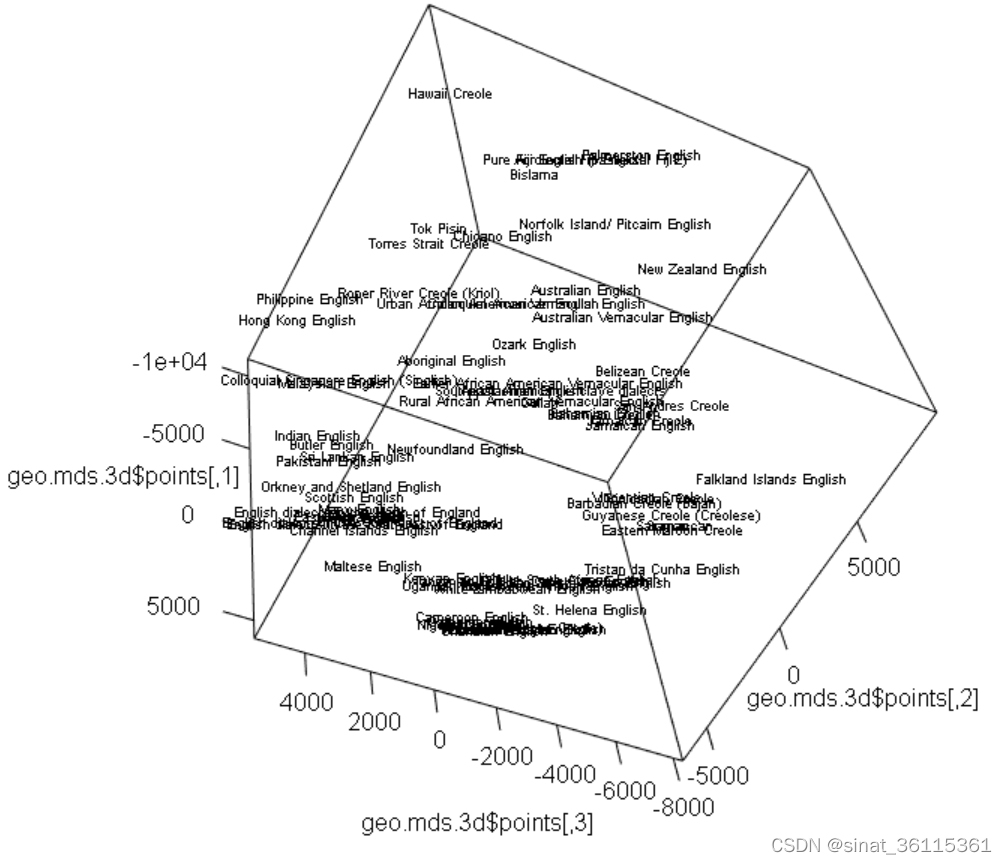
下面以最佳维度n=3来进行MDS展示。
geo.mds.3d <- cmdscale(geo.dist, k = 3, eig = TRUE)
plot3d(geo.mds.3d$points, type = "n")
text3d(geo.mds.3d$points, texts = rownames(eWAVE), cex = 0.6)

查看MDS模型的有效性,得分越大越好(类似于R2):
geo.mds.3d$GOF
另一种计算有效性方法,得分越小越好(<0.05):
sqrt(sum((geo.dist-dist(geo.mds.3d$points))^2)/sum(geo.dist^2))
除此之外,还可以将每个点的MDS距离与真实距离画图展示,x轴对应于每个pair之间的地理距离,而y轴则表示MDS解决方案所表示的pairs之间的距离。模型效果越好点离对角线越近。
geo.sh <- Shepard(geo.dist, geo.mds.3d$points)
plot(geo.sh, main = "Shepard plot", pch = ".")
lines(geo.sh$x, geo.sh$yf, type = "S")

4.参考资料
Levshina, Natalia. “How to do linguistics with R.” Data Exploration and Statistical Analysis, Amsterdam-Philadelphia (2015).[附百度云盘链接:https://pan.baidu.com/s/1YnWLPiH7oom_dPABWXFKig 提取码:f3nk)