0 写在前面
- 之前在base环境下画图,结果画不出,返回异常值如下:
- 使用matplotlib.pyplot报错exit code -1073741819 (0xC0000005)
使用matplotlib.pyplot报错exit code -1073741819 (0xC0000005)
- 换了一个虚拟环境env就跑起来了,所以原因竟然是
anaconda环境混乱,包和包之间互相影响!
1 plt.plot() 函数
- 函数声明
plt.plot(x, y, format_string, **kwargs)
- 参数介绍
x:X轴数据,列表或者数组(可选)
y:Y轴数据,列表或者数组
format_string:控制曲线的格式字符串(可选)
**kwargs:第二组或者更多(x,y,format_string), 可画多条曲线
- format_string介绍
>>>颜色:
'b' 蓝色
'c' 青绿
'g' 绿色
'k' 黑色
'm' 洋红
'w' 白色
'y' 黄色
'r' 红色
>>>风格字符
'-' 实线
'--' 虚线
':'  点线
'-.' 点横线(我也不知怎么描述这个)
'o' 实心圆
- 代码1如下:
import matplotlib.pyplot as plt
import numpy as np
X = np.arange(0, 12.1, 0.1)
Y = np.sin(X)
x = [1,2,3]
y = [1,4,9]
plt.plot(X, Y, "r--")
plt.show()
- 输出1如下:

- 代码2如下:
import matplotlib.pyplot as plt
import numpy as np

X = np.arange(0, 12.1, 0.1)
Y = np.sin(X)

x = [1,2,3]
y = [1,4,9]
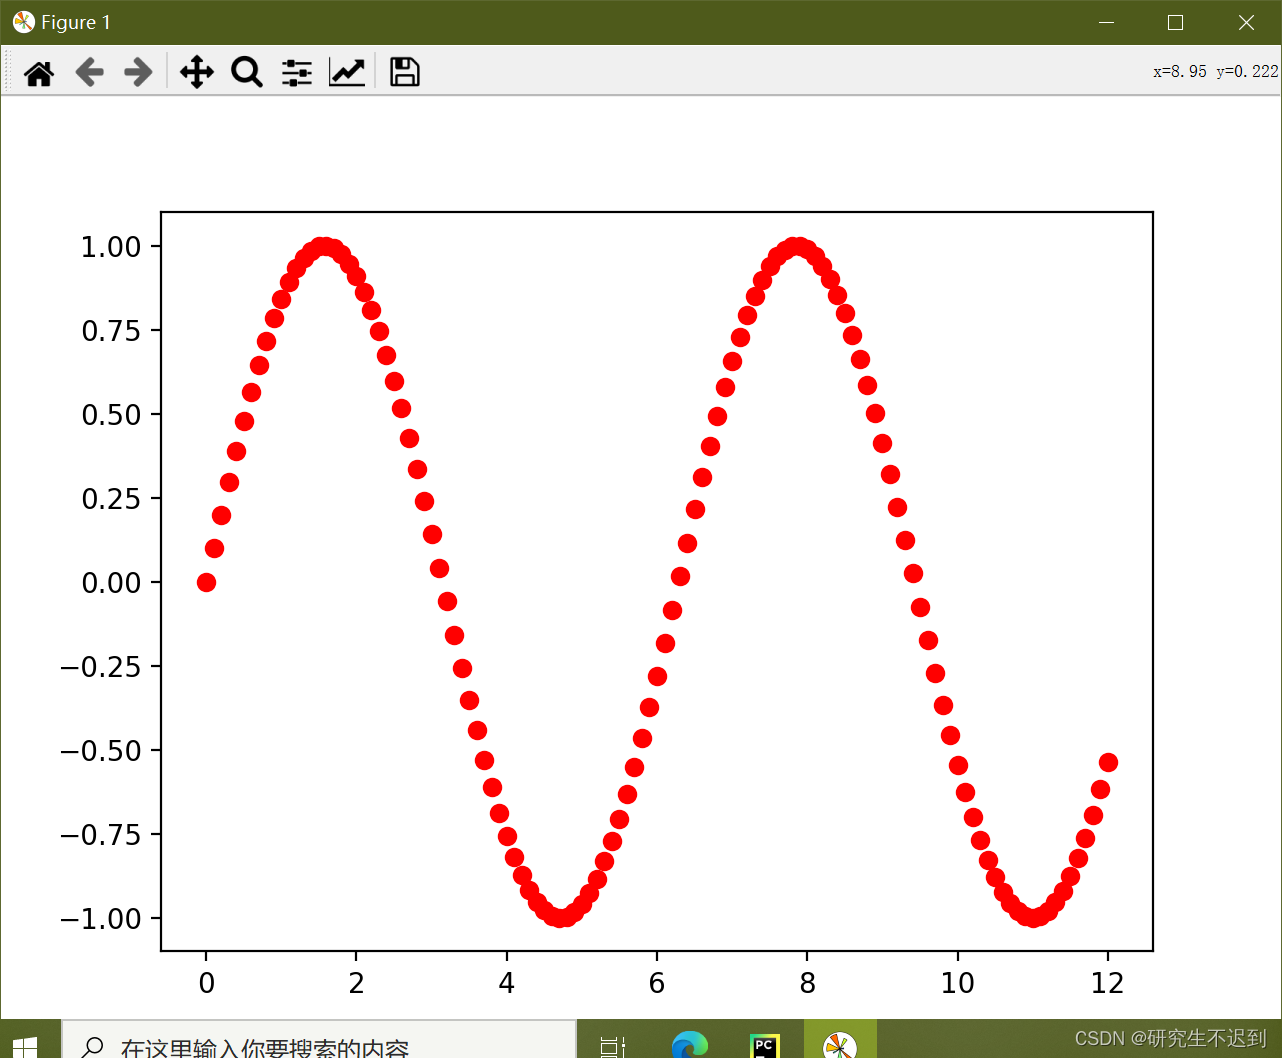
plt.plot(X, Y, "ro")
plt.show()
- 输出2 如下:

1.1 分开写参数
import matplotlib.pyplot as plt
import numpy as np

X = np.arange(0, 12.1, 0.1)
Y = np.sin(X)

x = [1,2,3]
y = [1,4,9]
plt.plot(X, Y, color='lime', linestyle='-', linewidth=2)
plt.show()

1.2 marker的参数设置
marker='v'
marker='o'
marker='^'

中心的颜色:
markerfacecolor='black'

边缘的颜色:
markeredgecolor='red'
1.3 设置标题、x和y轴的字体等
ax1 = plt.gca()
ax1.set_title('Big Title', fontname='Arial', fontsize=20, weight='bold')
ax1.set_xlabel('time(UTC)')
ax1.set_ylabel('T (C)')
1.4 设置刻度
import matplotlib.pyplot as plt
import numpy as np
X = np.arange(0, 12.1, 0.1)
Y = np.sin(X)
x = [1,2,3]
y = [1,4,9]
plt.plot(X, Y, color='lime', linestyle='-', linewidth=2, \
marker='^', markerfacecolor='black', markeredgecolor='red',\
markersize=4, markeredgewidth=1)
ax1 = plt.gca()
ax1.set_title('Big Title', fontname='Arial', fontsize=20, weight='bold')
ax1.set_xlabel('time(UTC)')
ax1.set_ylabel('T (C)')
ax1.set_xticks([0, 2.5, 7, 11])
ax1.set_xticklabels(['J', 'A', 'W', 'E'])
plt.show()

1.5 设置刻度朝向
import matplotlib.pyplot as plt
import numpy as np
X = np.arange(0, 12.1, 0.1)
Y = np.sin(X)
x = [1,2,3]
y = [1,4,9]
plt.plot(X, Y, color='lime', linestyle='-', linewidth=2, \
marker='^', markerfacecolor='black', markeredgecolor='red',\
markersize=4, markeredgewidth=1)
ax1 = plt.gca()
ax1.set_title('Big Title', fontname='Arial', fontsize=20, weight='bold')
ax1.set_xlabel('time(UTC)')
ax1.set_ylabel('T (C)')
ax1.set_xticks([0, 2.5, 7, 11])
ax1.set_xticklabels(['J', 'A', 'W', 'E'])
ax1.tick_params(axis='both', direction='in', color='blue')
plt.show()

1.6 刻度的长度、宽度
ax1.tick_params(axis='both', direction='in', color='blue',\
                length=10, width=2)
1.7 画多个plt的时候,添加图例
- 在每一个plot括号内增加
label - 然后添加
plt.legend(loc='best')
import matplotlib.pyplot as plt
import numpy as np
X = np.arange(0, 12.1, 0.1)
Y = np.sin(X)
x = [1,2,3]
y = [1,4,9]
plt.plot(X, Y, color='lime', linestyle='-', linewidth=2, \
marker='^', markerfacecolor='black', markeredgecolor='red',\
markersize=4, markeredgewidth=1, label="zhang")
ax1 = plt.gca()
ax1.set_title('Big Title', fontname='Arial', fontsize=20, weight='bold')
ax1.set_xlabel('time(UTC)')
ax1.set_ylabel('T (C)')
ax1.set_xticks([0, 2.5, 7, 11])
ax1.set_xticklabels(['J', 'A', 'W', 'E'])
ax1.tick_params(axis='both', direction='in', color='blue',\
length=10, width=2)
plt.plot(X+2, Y, label="chen")
plt.legend(loc='best')
plt.show()

1.8 设置多图层的图层顺序
zorder设置【从1开始】

1.9 指数坐标轴
X2 = np.arange(1, 100, 1)
Y2 = np.exp(X2)
plt.plot(X2, Y2)
ax = plt.gca()
ax.set_yscale('log')

2 plt.subplots()画多个子图
import matplotlib.pyplot as plt
import numpy as np
X = np.arange(0, 12.1, 0.1)
Y = np.sin(X)
fig, ax = plt.subplots(2, 1)
ax[0].plot(X,Y)
ax[1].plot(X+2, Y,'r')
ax[0].set_xlim([0, 10])
ax[1].set_xlim([0, 10])
plt.show()

3 保存到png图片
plt.savefig('./Big.png')
plt.show()
import matplotlib.pyplot as plt
import numpy as np
X = np.arange(0, 12.1, 0.1)
Y = np.sin(X)
plt.plot(X, Y, color='lime', linestyle='-', linewidth=2, \
marker='^', markerfacecolor='black', markeredgecolor='red',\
markersize=4, markeredgewidth=1, label="zhang", zorder=2)
ax1 = plt.gca()
ax1.set_title('Big Title', fontname='Arial', fontsize=20, weight='bold')
ax1.set_xlabel('time(UTC)')
ax1.set_ylabel('T (C)')
ax1.set_xticks([0, 2.5, 7, 11])
ax1.set_xticklabels(['J', 'A', 'W', 'E'])
ax1.tick_params(axis='both', direction='in', color='blue',\
length=10, width=2)
plt.plot(X+2, Y, label="chen", zorder=1)
plt.legend(loc='best')
plt.savefig('./Big.png')
plt.show()
3.1 保存的图片不完整
fig = plt.figure(figsize=(8, 4))
3.2 紧致布局
plt.tight_layout()
3.3 设置分辨率
plt.savefig('./Big.png', dpi=300)
|


