[T]hey were silly[?s?li]傻瓜,笨蛋 enough to think you can look at the past to predict the future. —The Economist
? ? ?This chapter is about the vectorized backtesting of algorithmic trading strategies. The term algorithmic trading strategy is used to describe any type of financial trading strategy that is based on an algorithm designed to take long, short, or neutral positions in financial instruments on its own without human interference. A simple algorithm, such as “altering every five minutes between a long and a neutral position in the stock of Apple, Inc.,” satisfies this definition. For the purposes of this chapter and a bit more technically, an algorithmic trading strategy is represented by some Python code that, given the availability of new data, decides whether to buy or sell a financial instrument in order to take long, short, or neutral positions in it.?
? ? ?The chapter does not provide an overview of algorithmic trading strategies (see “Further Resources” for references that cover algorithmic trading strategies in more detail). It rather focuses on the technical aspects of the vectorized backtesting approach for a select few such strategies. With this approach the financial data on which the strategy is tested is manipulated in
general as a whole, applying vectorized operations on NumPy ndarray and pandas DataFrame objects that store the financial data.
? ? ?Another focus of the chapter is the application of machine and deep learning algorithms to formulate algorithmic trading strategies. To this end, classification algorithms are trained on historical data in order to predict future directional market movements. This in general requires the transformation of the financial data from real values to a relatively small number of categorical values. This allows us to harness[?hɑ?rn?s]控制并利用 the pattern recognition power of such algorithms.
The chapter is broken down into the following sections:
- “Simple Moving Averages”
? ? ?This section focuses on an algorithmic trading strategy based on simple moving averages and how to backtest such a strategy.
? ? ?简单移动平均线沿用最简单的统计学方式,将?过去 某特定时间内的价格取其平均值。简单移动平均线计算方法如同其名——简单。它只是将每日得到的平均值连成一线并随时间移动,每一支烛因而得到相同的数值。 - “Random Walk Hypothesis”
? ???This section introduces the random walk hypothesis. - “Linear OLS Regression”
? ? ?This section looks at using OLS(ordinary least squares) regression to derive an algorithmic trading strategy. - “Clustering”
? ? ?In this section, we explore using unsupervised learning algorithms to derive algorithmic trading strategies - “Frequency Approach”
? ? ?This section introduces a simple frequentist approach for algorithmic trading. - “Classification”
? ? ?Here we look at classification algorithms from machine learning for algorithmic trading. - “Deep Neural Networks”
? ? ?This section focuses on deep neural networks and how to use them for algorithmic trading.
Simple Moving Averages
? ? ?Trading based on simple moving averages (SMAs) is a decades-old trading approach (see, for example, the paper by Brock et al. (1992)). Although many traders use SMAs for their discretionary trading自由贸易,自主交易, they can also be used to formulate simple algorithmic trading strategies. This section uses SMAs to introduce vectorized backtesting of algorithmic trading strategies. It builds on?the technical analysis example in Chapter 8(Financial Time Series).
Data Import
import numpy as np
import pandas as pd
import datetime as dt
from pylab import mpl, plt

plt.style.use('seaborn')
mpl.rcParams['font.family'] = 'serif'
%matplotlib inline
? ? ?Second, the reading of the raw data and the selection of the financial time series for a single symbol, the stock of Apple, Inc. (AAPL.O). The analysis in this section is based on end-of-day data; intraday[??ntr??de?]当天的 data is used in subsequent sections:
raw = pd.read_csv('../source/tr_eikon_eod_data.csv')
raw.head()
raw = pd.read_csv('../source/tr_eikon_eod_data.csv', index_col=0)
raw.head()
raw.info()?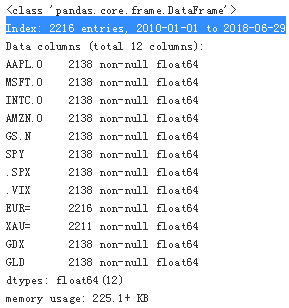
type(raw.index)?![]()
raw = pd.read_csv('../source/tr_eikon_eod_data.csv', index_col=0, parse_dates=True)
raw.head()
raw.info()?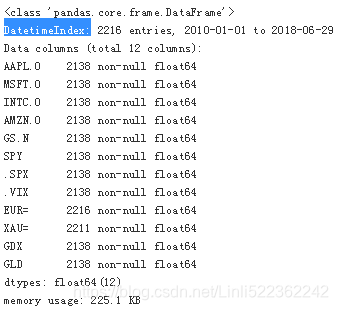
type(raw.index)?
the selection of the financial time series for a single symbol, the stock of Apple, Inc. (AAPL.O)
symbol='AAPL.O'

data = (
    pd.DataFrame(raw[symbol]).dropna()
)
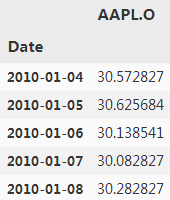
data.head()
?
Trading Strategy
Third, the calculation of the SMA values for two different rolling window sizes. Figure 15-1 shows the three time series visually:
##################### rolling window ########################
##################### rolling window ########################
? ? ?There are exactly 252 trading days in 2021. January and February have the fewest (19), and March the most (23), with an average of 21 per month, or 63 per quarter.
? ? ?Out of a possible 365 days, 104 days(365/7=52*2=104) are weekend days (Saturday and Sunday) when the stock exchanges are closed. Seven of the nine holidays which close the exchanges fall on weekdays, with Independence Day being observed on Monday, July 5, and Christmas on Friday, December 24. There is one shortened trading session on Friday, November 26 (the day after Thanksgiving Day). ==> 365-104-7-2=252
? ? ?The trend strategy(AAPL.O) we want to implement is based on both a two-month (i.e., 42 trading days) and a one-year (i.e., 252 trading days) trend
SMA1 = 42
SMA2 = 252

data['SMA1'] = data[symbol].rolling(SMA1).mean() #Calculates the values for the shorter SMA.
data['SMA2'] = data[symbol].rolling(SMA2).mean() #Calculates the values for the longer SMA.

data.plot(figsize=(10,6), title='Apple stock price and two simple moving averages')
Fourth, the derivation of the positions(仓位). The trading rules are:
- Buy signal: Go long (= +1)做多 when the shorter SMA is above the longer SMA.
- Sell signal: Go short (= -1)做空 when the shorter SMA is below the longer SMA.
- Wait (park in cash): the 42d trend is within a range of +/– SD points around the 252d trend.
Technical Analysis?https://blog.csdn.net/Linli522362242/article/details/90110433
data.dropna(inplace=True)
#np.where(cond, a, b) evaluates the condition cond element-wise and places a when True and b otherwise.
data['Position'] = np.where(data['SMA1'] > data['SMA2'], 1, -1)
data.tail()
orders = data['Position'].diff()

                #right side y-axis
ax = data.plot( secondary_y='Position', figsize=(10,6),
                title='Apple stock price, two SMAs, and resulting positions'
              )

ax.get_legend().set_bbox_to_anchor( (0.25, 0.85) )

ax.plot( data.loc[ orders==2.0].index, data['AAPL.O'][orders==2.0],
          '^', markersize=10, color='k',
          # label='Buy',
        )
ax.plot( data.loc[ orders==-2.0].index, data['AAPL.O'][orders==-2.0],
          'v', markersize=10, color='k',
          # label='Sell'
        )
?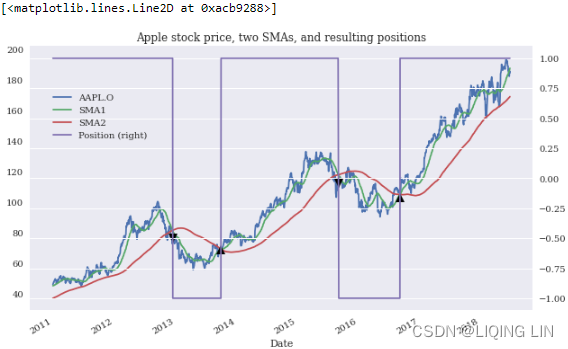
? ? ?This replicates the results derived in Chapter 8. What is not addressed there is if following the trading rules — i.e., implementing the algorithmic trading strategy — is superior compared to the benchmark case of simply going long on the Apple stock over the whole period. Given that the strategy leads to two periods only during which the Apple stock should be shorted![]() , differences in the performance can only result from these two periods.
, differences in the performance can only result from these two periods.
Vectorized Backtesting
? ? ?The vectorized backtesting can now be implemented as follows.
? ? ?First, the log returns are calculated.
############
Log returns:![]() between two times 0 < s < t?are normally distributed.
between two times 0 < s < t?are normally distributed.
Log-normal?values:? At any time t > 0, the values![]() are log-normally distributed.
are log-normally distributed.
############
? ? ?Then the positionings, represented as +1 or -1, are multiplied by the relevant log return.(if SMA1 > SMA2 or SMA1<SMA2, then go long or go short?to get the relevant log return) This simple calculation is possible since a long position 多头头寸earns the return of the Apple stock and a short position 空头头寸earns the negative return of the Apple stock.
? ? ?Finally, the log returns for the Apple stock and the algorithmic trading strategy based on SMAs need to be added up and the exponential function applied to arrive at the performance values:
data[symbol].head()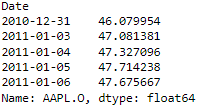
data[symbol].shift(1).head()?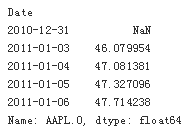
return : the difference in today's stock log value relative to yesterday's stock log value ==>?![]()
? ? ?(why using log daily return not the daily return)The multiplicative model is appropriate if the seasonal fluctuations increase or decrease proportionally with increases and decreases in the level of the serieshttp://web.vu.lt/mif/a.buteikis/wp-content/uploads/2019/02/Lecture_03.pdf?and?https://blog.csdn.net/Linli522362242/article/details/123606731 and?https://blog.csdn.net/Linli522362242/article/details/121406833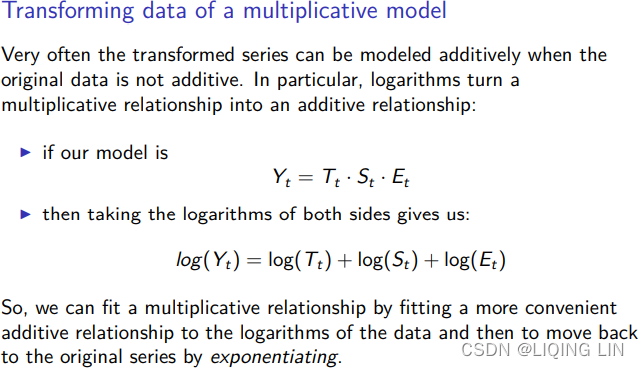
#Calculates the log returns of the Apple stock (i.e., the benchmark investment).
#symbol='AAPL.O'
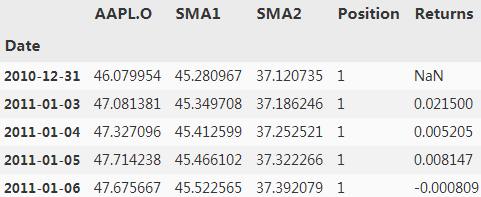
data['Returns'] = np.log(data[symbol]/data[symbol].shift(1))  #ln == log_e
data.head()
?
(if SMA1 > SMA2 OR SMA1<SMA2, then go long OR go short?to get the relevant log return)
? ? ?The basic idea is that the algorithm can only set up a position in the Apple stock given today’s market data (e.g., just before the close). The position then earns tomorrow’s return.
#Multiplies the position values, shifted by one day, by the log returns of the Apple stock; the shift
#is required to avoid a foresight bias
data['Strategy'] = data['Position'].shift(1) * data['Returns']
data.round(4).head()
?
data.dropna(inplace=True)# drop first row

#Sums up the log returns for the strategy
#and the benchmark investment
#and calculates the exponential value to arrive at the absolute performance.
np.exp(data[['Returns','Strategy']].sum())
? return == np.exp( log return?) <==
![]()
? ? ?To present this volatility in annualized terms, we simply need to?multiply our daily standard deviation by the square root of 252.
#Calculates the annualized volatility for the strategy and the benchmark investment.
data[['Returns', 'Strategy']].std() * 252**0.5
?
? ? ?The numbers show?that the algorithmic trading?strategy?indeed?outperforms?the?benchmark investment of passively (被动地) holding?the Apple stock(Strategy:5.811299 > Returns:4.017148). Due to the type and characteristics of the strategy, the?annualized volatility is the same(0.250), such that it also outperforms the benchmark investment?on a riskadjusted basis在风险调整的基础上.
? ? ?To gain a better picture of the overall performance, Figure 15-3 shows the performance of the Apple stock and the algorithmic trading strategy over time:
ax = data[['Returns', 'Strategy']].cumsum().apply(np.exp).plot(figsize=(10,6),
                                                               title='Performance of Apple stock and SMA-based trading strategy over time')
#data['Position'] = np.where(data['SMA1'] > data['SMA2'], 1, -1)
data['Position'].plot(ax=ax, secondary_y='Position', style='--')
ax.get_legend().set_bbox_to_anchor((0.25, 0.85))
SIMPLIFICATIONS
? ? ?The vectorized backtesting approach as introduced in this subsection is based on a number of simplifying assumptions. Among others, transactions costs (fixed fees, bid-ask spreads, lending costs, etc.) are not included. This might be justifiable for a trading strategy that leads to a few trades only over multiple years. It is also assumed that all trades take place at the end-of-day closing prices for the Apple stock. A more realistic backtesting approach would take these and other (market microstructure) elements into account.
Optimization
? ? ?A natural question that arises is if the chosen parameters SMA1=42 and SMA2=252 are the “right” ones. In general, investors prefer higher returns to lower returns ceteris paribus[?ked(?)r?s ?p?r?b?s]?其他条件不变. Therefore, one might be inclined to search for those parameters that maximize the return over the relevant period. To this end, a brute force approach蛮力方法 can be used that simply repeats the whole vectorized backtesting procedure for different parameter combinations, records the results, and does a ranking afterward. This is what the following code does:
raw[symbol] ?# exp( log(returns) ) = returns?
from itertools import product#笛卡尔积

sma1 = range(20, 61, 4) #short term: Specifies the parameter values for SMA1.
sma2 = range(180, 281, 10) #long term: Specifies the parameter values for SMA2.

results = pd.DataFrame()
for SMA1, SMA2 in product(sma1, sma2): #Combines all values for SMA1 with those for SMA2.
    data = pd.DataFrame(raw[symbol])
    data.dropna(inplace=True)

    #data['Returns'] = np.log(data[symbol] / data[symbol].shift(1))

    data['SMA1'] = data[symbol].rolling(SMA1).mean()
    data['SMA2'] = data[symbol].rolling(SMA2).mean()
    data.dropna(inplace=True)

    data['Position'] = np.where(data['SMA1'] > data['SMA2'], 1, -1)

    data['Returns'] = np.log(data[symbol] / data[symbol].shift(1))
    data['Strategy'] = data['Position'].shift(1) * data['Returns']
    data.dropna(inplace=True)

    perf = np.exp( data[['Returns', 'Strategy']].sum() )#dataframe

    results = results.append(pd.DataFrame(
                                            {'SMA1':SMA1,
                                             'SMA2':SMA2,
                                             'MARKET': perf['Returns'],
                                             'STRATEGY': perf['Strategy'],
                                             'OUT': perf['Strategy'] - perf['Returns']
                                            },
                                            index = [0]###
                                         ),
                             ignore_index = True
                            )#Records the vectorized backtesting results in a DataFrame object.
results=results[['SMA1', 'SMA2', 'MARKET','STRATEGY','OUT']]
results.head()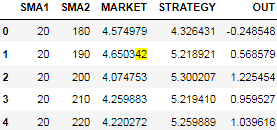
results.tail()?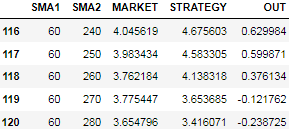
results.info()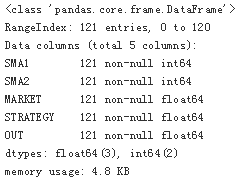
? ? ?The following code gives an overview of the results and shows the seven best-performing parameter combinations of all those backtested. The ranking is implemented according to the outperformance of the algorithmic trading strategy compared to the benchmark investment. The performance of the benchmark investment varies since the choice of the SMA2 parameter influences the length of the time interval and data set on which the vectorized backtest is implemented:
results.sort_values('OUT', ascending=False).head(7)?
? ? ?According to the brute force–based optimization, SMA1=40 and SMA2=190 are the optimal parameters, leading to an outperformance of some 230(40+190) percentage points. However, this result is heavily dependent on the data set used and is prone to overfitting. A more rigorous更严格的 approach would be to implement the optimization on one data set, the in-sample or training data set, and test it on another one, the out-of-sample or testing data set.
OVERFITTING
? ? ?In general, any type of optimization, fitting, or training in the context of algorithmic trading strategies is prone to what is called overfitting. This means that parameters might be chosen that perform (exceptionally) well for the used data set but might perform (exceptionally) badly on other data sets or in practice.
Random Walk Hypothesis
? ? ?The previous section introduces vectorized backtesting as an efficient tool to backtest algorithmic trading strategies. The single strategy backtested based on a single financial time series, namely historical end-of-day prices for the Apple stock, outperforms the benchmark investment of simply going long on the Apple stock over the same period.
? ? ? Although rather specific in nature, these results are in contrast to what the Random Walk Hypothesis (RWH) predicts, namely that such predictive approaches should not yield any outperformance at all. The RWH postulates假设 that prices in financial markets follow a random walk, or, in continuous time, an arithmetic Brownian motion without drift. The expected value of an arithmetic Brownian motion without drift at any point in the future equals its value today.在未来任何时候没有漂移的算术布朗运动的期望值等于它今天的值. As a consequence, the best predictor for tomorrow’s price, in a least-squares sense, is today’s price if the RWH applies.
The consequences are summarized in the following quote:
? ? ?For many years, economists, statisticians, and teachers of finance have been interested in developing and testing models of stock price behavior. One important model that has evolved from this research is the theory of random walks. This theory casts serious doubt on many other methods for describing and predicting stock price behavior — methods that have considerable popularity outside the academic world. For example, we shall see later that, if the random-walk theory is an accurate description of reality, then the various “technical” or “chartist”“图表” procedures for predicting stock prices are completely without value.—Eugene F. Fama (1965)
? ? ?The RWH is consistent with the efficient markets hypothesis (EMH), which, non-technically speaking, states that market prices reflect “all available information.” Different degrees of efficiency are generally distinguished, such as weak, semi-strong, and strong, defining more specifically what “all available information” entails. Formally, such a definition can be based on the concept of an information set in theory and on a data set for programming purposes, as the following quote illustrates:
? ? ?A market is efficient with respect to an information set S if it is impossible to make economic profits by trading on the basis of information set S.—Michael Jensen (1978)
与金融市场
? ? ?随机游走(random walk)也称随机漫步,随机行走等是指基于过去的表现,无法预测将来的发展步骤和方向。核心概念是指任何无规则行走者所带的守恒量都各自对应着一个扩散运输定律,接近于布朗运动,是布朗运动理想的数学状态,现阶段主要应用于互联网链接分析及金融股票市场中
? ? ?股票市场由无数的亚单元即投资者构成。每个投资者为个人经验、感情和不完全信息所左右,其决策立足于其他投资的的决策以及汇总的信息中的随机事件,在经济学上研究这样的决策叫做博弈论(game theory)。当然单个投资者的行为不可预测,但长期来看,股票价格作某种带漂移的无规则行走。驱动这个行走的包括投资者的突发奇想、自然灾难、公司倒闭、以及其他不可预知的新闻事件。
? ? ?为什么行走会是随机?假如一个分析员发现12月末股价会上扬,到1月初在下跌,一旦这种规律被市场参与者得知自然人们会选择这段时间内抛出股票,这一行为导致了股票下跌,消除了这种效应的可能。股票的公平原则即要求公开信息资源,使得一个投资者没有更多战胜其他投资者的有用信息。在信息完全公开的情况下长时间的股票曲线应该近似于一维无规则行走
理想状态
无规则行走只是布朗运动的理想状态。
? ? ?在很多系统都存在不同类型的无规则行走,他们都具有相似结构。单个的随机事件我们不可预测,但随机大量的群体行为,却是精确可知的,这就是概率世界的魅力,在偶然中隐含着必然。随机性造成了低尺度下的差异性,但在高尺度下又表现为共同的特征的相似性。按照概率的观点“宇宙即是所有随机事件概率的总和”。
? ? ?Using Python, the RWH can be tested for a specific case as follows. A financial time series of historical market prices is used for which a number of lagged滞后 versions are created — say, five. OLS最小二乘 regression is then used to predict the market prices based on the lagged market prices created before. The basic idea is that the market prices from yesterday and four more days back can be used to predict today’s market price.
? ? ?The following Python code implements this idea and creates five lagged versions of the historical end-of-day closing levels of the S&P 500 stock index标准普尔 500 股票指数历史收盘价:
raw.head()
symbol = '.SPX'
data = pd.DataFrame(raw[symbol])

lags = 5
cols = []
for lag in range(1, lags+1):
    #Defines a column name for the current lag value.
    col = 'lag_{}'.format(lag)
    #Creates the lagged version of the market prices for the current lag value.
    data[col] = data[symbol].shift(lag)
    #Collects the column names for later reference.
    cols.append(col)
data.head(7)
?
data.dropna(inplace=True)
data.head()
?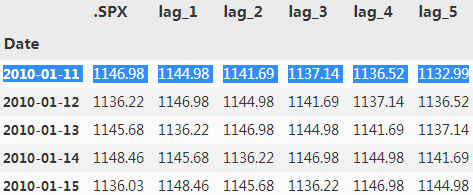
? ? ?Using NumPy, the OLS regression is straightforward to implement. As the optimal regression parameters show, lag_1 indeed is the most important one in predicting the market price based on OLS regression. Its value is close to 1. The other four values are rather close to 0. Figure 15-4 visualizes the optimal regression parameter values.
? ? ? When using the optimal results to visualize the prediction values as compared to the original index values for the S&P 500, it becomes obvious from Figure 15-5 that indeed lag_1 is basically what is used to come up with the prediction value. Graphically speaking, the prediction line in Figure 15-5 is the original time series shifted by one day to the right (with some minor adjustments稍作调整).
? ? ?All in all, the brief analysis in this section reveals some support for both the RWH and the EMH. For sure, the analysis is done for a single stock index only and uses a rather specific parameterization — but this can easily be widened to incorporate multiple financial instruments across multiple asset classes, different values for the number of lags, etc. In general, one will find out that the results are qualitatively more or less the same. After all, the RWH and EMH are among the financial theories that have broad empirical经验 support. In that sense, any algorithmic trading strategy must prove its worth by proving that the RWH does not apply in general并不普遍适用. This for sure is a tough hurdle.
Linear OLS Regression
? ? ?This section applies linear OLS regression to predict the direction of market movements based on historical log returns. To keep things simple, only two features are used. The first feature (lag_1) represents the log returns of the financial time series lagged by 1 day. The second feature (lag_2) lags the log returns by 2 days. Log returns — in contrast to prices — are stationary in general, which often is a necessary condition for the application of statistical and ML algorithms.
? ? ?The basic idea behind the usage of lagged log returns as features is that they might be informative in predicting future returns. For example, one might hypothesize that after two downward movements an upward movement is more likely (“mean reversion” : The underlying precept[?pri?sept]规则;格言;训诫 is that?prices revert回归 toward the mean.), or, to the contrary, that another downward movement is more likely (“momentum” or “trend”,??expecting price moves to?continue in that direction).https://blog.csdn.net/Linli522362242/article/details/121896073 The application of regression techniques allows the formalization of such informal reasonings.
The Data
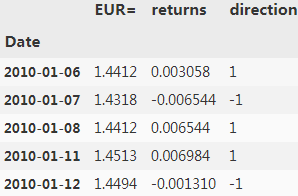
? ? ?First, the importing and preparation of the data set. Figure 15-6 shows the frequency distribution of the daily historical log returns for the EUR/USD exchange rate. They are the basis for the features as well as the labels to be used in what follows:
raw = pd.read_csv('../source/tr_eikon_eod_data.csv')
raw.head()
raw = pd.read_csv('../source/tr_eikon_eod_data.csv', index_col=0, parse_dates=True).dropna()
raw.head()
?
raw.columns?
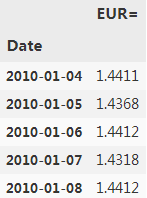
symbol = 'EUR='
data = pd.DataFrame(raw[symbol])  #raw[symbol] is a series
data.head()
?
#why log?
#Try to multiply many small numbers in Python. Eventually it rounds off to 0.
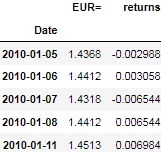
data['returns'] = np.log(data/data.shift(1))
data.dropna(inplace=True)  #since data.shift(1)
data.head()
?
np.sign(data['returns']).head()?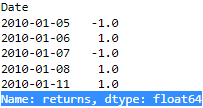
np.sign(data['returns']).astype(int).head()?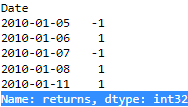
data['direction'] = np.sign(data['returns']).astype(int)
data.head()
? Why?histogram?https://blog.csdn.net/Linli522362242/article/details/123116143For example, standardized test auditors looking for evidence of grade tampering[?t?mp?r??]干预,贿赂 might construct a histogram of student test scores
data['returns'].hist(bins=35, figsize=(10,6))
# OR plt.hist( data['returns'], bins=35, label='frequency', color='b')
plt.title('Histogram of log returns for EUR/USD exchange rate')
#a check whether the data['returns'] values are indeed log-normally distributed.
#如果峰度大于三,峰的形状比较尖,比正态分布峰要陡峭。反之亦然
#在相同的标准差下,峰度系数越大,分布就有更多的极端值,那么其余值必然要更加集中在众数周围,其分布必然就更加陡峭
#https://blog.csdn.net/Linli522362242/article/details/99728616 Figure 15-6. Histogram of log returns for EUR/USD exchange rate.
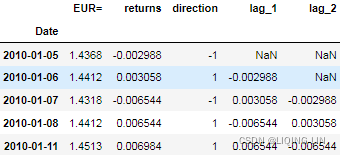
? ? ?Second, the code that creates the features data by lagging the log returns and visualizes it in combination with the returns data (see Figure 15-7):
lags =2
def create_lags(data):
    global cols
    cols = []
    for lag in range(1, lags+1):
        col = 'lag_{}'.format(lag)
        data[col] = data['returns'].shift(lag)
        cols.append(col)

create_lags(data)
data.head()
?
data.dropna(inplace=True) #since shift()
data.head()
?
data.plot.scatter(x='lag_1', y='lag_2', c='returns', cmap='coolwarm',
                  figsize=(10,6), colorbar=True)
plt.axvline(0,c='r', ls='--')
plt.axhline(0,c='r', ls='--')
plt.title('Scatter plot based on features and labels data')
? Figure 15-7. Scatter plot based on features and labels data (we can see the?correlation)
Regression?
? ? ?With the data set completed, linear OLS regression can be applied
- to learn about any potential (linear) relationships,
- to predict market movement based on the features,
- and to backtest a trading strategy based on the predictions.
Two basic approaches are available:
- using the log returns
- or only the direction data
as the dependent variable during the regression. In any case, predictions are realvalued and therefore transformed to either +1 or -1 to only work with the direction of the prediction:
#The linear OLS regression implementation from scikit-learn is used.
from sklearn.linear_model import LinearRegression

#model
model=LinearRegression()

cols
?and?
?and?
use the 2 features (the log returns) to predict log returns or log return direction
#fit and then predict

#The regression is implemented on the log returns directly …
#                             features    actual value     prediction
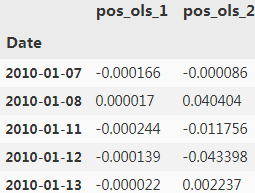
data['pos_ols_1'] = model.fit(data[cols], data['returns']).predict(data[cols])

#… and on the direction data which is of primary interest.
#data['direction'] = np.sign(data['returns']).astype(int)
data['pos_ols_2'] = model.fit(data[cols], data['direction']).predict(data[cols])

data[['pos_ols_1', 'pos_ols_2']].head()
?
data[['pos_ols_1', 'pos_ols_2']] = np.where( data[['pos_ols_1', 'pos_ols_2']]>0, 1,-1 )
data[['pos_ols_1', 'pos_ols_2']].head()
?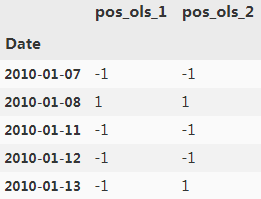 the direction of the prediction
#The real-valued predictions are transformed to directional values (+1, -1).
data['pos_ols_1'].value_counts()
?
#The real-valued predictions are transformed to directional values (+1, -1).
data['pos_ols_2'].value_counts()
?
data['pos_ols_1'].diff().head()?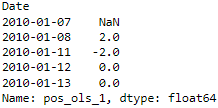 <==diff() <==
the number of trades over time(trade: go long or go short, or hold/wait)
#However, both lead to a relatively large number of trades over time.
(data['pos_ols_1'].diff() != 0).sum()
?
#However, both lead to a relatively large number of trades over time.
(data['pos_ols_2'].diff() !=0).sum()
?
? ? ?Equipped with the directional prediction, vectorized backtesting can be applied to judge the performance of the resulting trading strategies. At this stage, the analysis is based on a number of simplifying assumptions, such as “zero transaction costs” and the usage of the same data set for both training and testing. Under these assumptions, however, both regression-based strategies outperform the benchmark passive investment, while only the strategy trained on the direction of the market shows a positive overall performance.
data['strat_ols_1'] = data['pos_ols_1'] * data['returns']
data['strat_ols_2'] = data['pos_ols_2'] * data['returns']

data.head()
data[ ['returns', 'strat_ols_1', 'strat_ols_2'] ].sum()? ==>
==>
data[ ['returns', 'strat_ols_1', 'strat_ols_2'] ].sum().apply(np.exp) ?the strategy trained on the direction of the market shows a better performance(1.339286 > 0.942422(the market return)>0.810644 (the benchmark passive investment)?)
#Shows the number of correct and false predictions by the strategies
#data['pos_ols_1'] = model.fit(data[cols], data['returns']).predict(data[cols])
(data['direction'] == data['pos_ols_1']).value_counts()?![]()
#Shows the number of correct and false predictions by the strategies
#data['pos_ols_2'] = model.fit(data[cols], data['direction']).predict(data[cols])
(data['direction'] == data['pos_ols_2']).value_counts()?![]()
data[['returns',
      'strat_ols_1',
      'strat_ols_2'
     ]
    ].cumsum().apply(np.exp).plot(figsize=(10,6),
                                  title='Performance of EUR/USD and regression-based strategies over time')
? Figure 15-8. Performance of EUR/USD and regression-based strategies over time
? ? ?only the strategy trained on the direction of the market shows a positive overall performance
Clustering
? ? ?This section applies k-means clustering, as introduced in “Machine Learning”, to financial time series data to automatically come up with clusters that are used to formulate a trading strategy. The idea is that the algorithm identifies two clusters of feature values that predict either an upward movement or a downward movement.
data['direction'].value_counts()? ?0:wait(hold)?for a position, here we simply consider it as a outlier and just predict either an upward movement or a downward movement.
? ? ?The following code applies the k-means algorithm(https://blog.csdn.net/Linli522362242/article/details/120559394) to the two features as used before. Figure 15-9 visualizes the two clusters:
from sklearn.cluster import KMeans

#Two clusters are chosen for the algorithm.
model = KMeans(n_clusters=2, random_state=0) # n_clusters=2 since the direction is UP/Down

model.fit( data[cols] )
data.head()
cols?![]() features
features
data['pos_clus'] = model.predict(data[cols])
data.head()
Why??
#Given the cluster values, the position is chosen.
data['pos_clus'] = np.where(data['pos_clus'] == 1, -1, 1)
data['strat_clus'] = data['pos_clus'] * data['returns']
data[['returns', 'strat_clus']].sum().apply(np.exp)?![]()
######################## bad
data['pos_clus'] = model.predict(data[cols])
#Given the cluster values, the position is chosen.
data['pos_clus'] = np.where(data['pos_clus'] == 1, 1, -1)data['strat_clus'] = data['pos_clus'] * data['returns']
data[['returns', 'strat_clus']].sum().apply(np.exp)![]()
########################
plt.figure(figsize=(10,6))
plt.scatter(data[cols].iloc[:,0], #lag_1
data[cols].iloc[:,1], #lag_2
c=data['pos_clus'],
cmap='coolwarm'
)
plt.title('Two clusters as identified by the k-means algorithm')?
? ? ?Admittedly, this approach is quite arbitrary in this context — after all, how should the algorithm know what one is looking for? However, the resulting trading strategy shows a slight outperformance at the end compared to the benchmark passive investment (see Figure 15-10). It is noteworthy that no guidance (supervision, no using label(direction) to train the model)?is given and that the hit ratio — i.e., the number of correct predictions in relationship to all predictions made — is less than 50%:
data['strat_clus'] = data['pos_clus'] * data['returns']
data[['returns', 'strat_clus']].sum().apply(np.exp)![]() ==>previous : data['pos_clus'] = np.where(data['pos_clus'] == 1, -1, 1)
==>previous : data['pos_clus'] = np.where(data['pos_clus'] == 1, -1, 1)
(data['direction'] == data['pos_clus']).value_counts()?![]() the hit ratio = 50%
the hit ratio = 50%
data[['returns',
      'strat_clus'
     ]
    ].cumsum().apply(np.exp).plot(figsize=(10,6),
                                  title='Performance of EUR/USD and k-means-based strategy over time'
                                 )
Figure 15-10. Performance of EUR/USD and k-means-based strategy over time
Frequency Approach
? ? ?Beyond more sophisticated algorithms and techniques, one might come up with the idea of just implementing a frequency approach to predict directional movements in financial markets. To this end, one might transform the two real-valued features to binary ones and assess the probability of an upward and a downward movement, respectively, from the historical observations of such movements, given the four possible combinations for the two binary features ((0, 0), (0, 1), (1, 0), (1, 1)).?
? ? ?Making use of the data analysis capabilities of pandas, such an approach is relatively easy to implement:
data[cols[0]].head()?
np.digitize(data[cols[0]], bins=[0])[:5]? 正数为1向上,负数为0向下
def create_bins(data, bins=[0]):
    global cols_bin
    cols_bin =[]
    for col in cols:
        col_bin = col + '_bin'
        #Digitizes the feature values given the bins parameter.
        data[col_bin] = np.digitize(data[col], bins=bins)
        cols_bin.append(col_bin)  #list

create_bins(data)
data.head()
# data['direction'] = np.sign(data['returns']).astype(int)
data[cols_bin+['direction']].head()
? <==
<==![]()
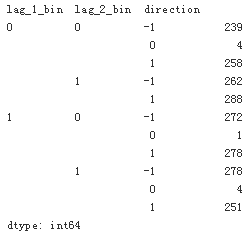
grouped = data.groupby(cols_bin + ['direction'])
#Shows the frequency of the possible movements conditional on the feature value combinations.
#direction: current return  # lag_1 : yesterday's return  # lag_2: The day before yesterday's return
grouped.size()
?
grouped['direction'].size()?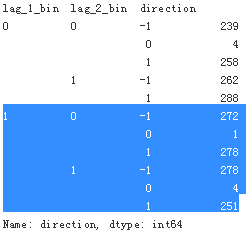
Frequency Summary
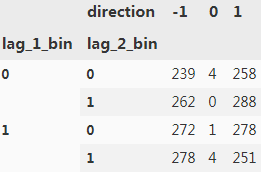
#Transforms the DataFrame object to have the frequencies in columns.
res = grouped['direction'].size().unstack(fill_value=0)

res
?

def highlight_max(s):
    is_max=( s==s.max() )
    print(s)
    print(is_max)
    print('#'*10)
    return ['background-color:yellow' if v else '' for v in is_max]


#Highlights the highest-frequency value per feature value combination.
#res = grouped['direction'].size().unstack(fill_value=0)
res.style.apply(highlight_max, axis=1)
? ==>
==>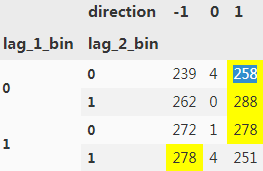
? ? ?Given the frequency data, three feature value combinations[(0,0),(0,1),(1,0)]?hint at a upward?movement while one[(1,1)] lets an downward movement seem more likely. This translates into a trading strategy the performance of which is shown in
########################
#data[col] = data['returns'].shift(lag)
#data[col_bin] = np.digitize(data[col], bins=bins)   #0: positive ; 1: negative
data[cols_bin].head()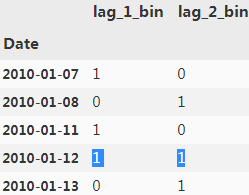
data[cols_bin].sum(axis=1).head() 
########################
#Translates the findings given the frequencies to a trading strategy.
data['pos_freq'] = np.where(data[cols_bin].sum(axis=1) == 2, -1, 1)
#since  data['direction']== 1 or -1
(data['direction'] == data['pos_freq']).value_counts()
?
data['strat_freq'] = data['pos_freq']*data['returns']

data[['returns', 'strat_freq']].sum().apply(np.exp)
?
##green curve? # not alway perform better than the?passive investment(return curve)
data[['returns',
      'strat_freq'
     ]
    ].cumsum().apply(np.exp).plot(figsize=(10,6),
                                  title='Performance of EUR/USD and frequency-based trading strategy over time'
                                 )
? Figure 15-11. Performance of EUR/USD and frequency-based trading strategy over time
Classification
? ? ?This section applies the classification algorithms from ML (as introduced in “Machine Learning”) to the problem of predicting the direction of price movements in financial markets. With that background and the examples from previous sections, the application of the logistic regression, Gaussian Naive Bayes, and support vector machine approaches is as straightforward as applying them to smaller sample data sets.
Two Binary Features
? ? ?First, a fitting of the models based on the binary feature values and the?derivation of the resulting position values:
from sklearn import linear_model
from sklearn.naive_bayes import GaussianNB
from sklearn.svm import SVC

C=1 #Penalty parameter C of the error term.Log-odds +?sigmoid(logistic) function +?parameter C
- 1.?the logarithm of?the odds ratio几率比 (log-odds):?
 ,where p stands for the probability of the positive event. The term positive event does not necessarily mean good, but refers to the event that we want to predict.?for example, the probability that a patient has a certain disease; we can think of the positive event as class label y =1.
 - 2. a linear relationship between feature values and the log-odds:?

Here, ?is the conditional probability that a particular sample belongs to class 1 given its features x.
 - 3. Now what we are actually interested in is predicting the probability that a certain sample belongs to a particular class, which is the inverse form of the logit function###The inverse function of logarithm is the exponent###. It is also called the logistic function, sometimes simply abbreviated as sigmoid function due to its characteristic S-shape.
 ==>
==> ==>
==> ==>predicted class label
- 4.?minimize the cost function

- 5.?The cost function for logistic regression can be regularized by adding a simple regularization term, which will shrink the weights during model training:


? ? ? ?The parameter C that is implemented for the LogisticRegression class in scikitlearn comes from a convention in support vector machines, which will be the topic of the next section. The term C is directly related to the regularization parameter? which is its inverse
 .??
.??
So we can rewrite the regularized cost function of logistic regression as follows: (Note:?
 is for convenient computation,?we should?remove it for?Practical application)
 -
6. Equation 4-8. Ridge Regression cost function
 OR
OR ? ? ?Note:?
 is for convenient computation,?, we should?remove it for?Practical application
 - 7. Now, we can think of regularization as adding a penalty term to the cost function to encourage smaller weights; or, in other words, we penalize large weights.

 Thus, by increasing the regularization strength via the regularization parameter
  , we shrink the weights towards zero and decrease the dependence of our model on the training data. this concept was illustrated in the previous figure for the L2 penalty term
 .
.
Lagrangian function + SVM (Support Vector Machines)
cost function?![]()

- linear models:?
 ?OR?
?OR?
 Figure 7.1 The?margin?is defined as?the perpendicular distance?(https://blog.csdn.net/Linli522362242/article/details/104151351
 ) between the decision boundary and the closest of the data points, as shown on the left figure. (we wish to optimize the parameters w and b in order to) Maximizing the margin leads to a particular choice of decision boundary, as shown on the right. The location of this boundary is determined by a subset of the data points, known as support vectors, which are indicated by the circles.
? ? ?-->At first, ?(to find the closest of data?points to?decision boundary)?,
? ? ?-->Next, maximize ?for maximizing the margin( to choose the decision boundary or to find the support vectors that determine the location boundary) ==> maximize?
 ==> is equivalent to minimizing?
 ==>?
==>? ?s.t.?
 ?and
?and  is class label
- In order to solve this constrained optimization (maximize margin) problem, we introduce Lagrange multipliers拉格朗日乘数
 0, with one multiplier
  ?for each of the constraints, giving the Lagrangian function
 ###we put the constraints together
where a = . Note the minus sign in front of the Lagrange multiplier term, because we are minimizing with respect to w and b, and maximizing with respect to
  .
.
?Setting the derivatives of L(w, b, a) with respect to w and b equal to zero, we obtain the following two conditions
the partial derivatives of L?(w, b, a)=0? ?==> ==>
==>
the partial derivatives of L?(w,?b, a)=0? ?==> ==>?
==>?
Eliminating w and b from L(w, b, a)?using these conditions

replaced?with? ?
? ==
==
 * w?==>


 *
*
and,
 ==
==

 +?
+?
 -?
-?
==>? +0--
+0--
Then, ?
? --
-- ==>minimize cost function?
 but
but  ==>?
==>?
then gives the?dual representation?of the maximum margin problem in which we maximize? ??
??
with respect to a subject to the?constraints? ?
?? ? ?Here the kernel function is defined by
 ?or
?or  Again, this takes the form of a quadratic programming problem in which we optimize(maximize) a quadratic function of a subject to a set of inequality constraints.
-
Equation 5-6.?Dual form of the linear SVM objective

Once you find the vector that minimizes this equation (using a QP/Quadratic Programming problem solverhttps://blog.csdn.net/Linli522362242/article/details/104403372), you can compute
  ?and
?and ?that minimize the primal problem by using Equation 5-7.
Equation 5-7. From the dual solution to the primal solution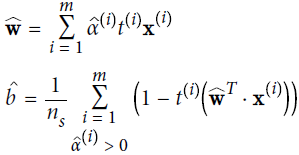
-
Equation 5-11. Making predictions with a kernelized SVM

Equation 5-12. Computing the bias term using the kernel trick
 If you are starting to get a headache, it’s perfectly normal: it’s an unfortunate side effects of the?kernel trick
 Gaussian RBF
 https://blog.csdn.net/Linli522362242/article/details/104280075
#############minimizing with respect to w and b, and maximizing with respect to  .????
.????
minimize?![]() s.t.
s.t.![]() ==>
==> ==>maximize:??
![]() ?
?
Let's do?![]() s.t.?
s.t.?![]() ==>
==> ![]()
#0.??![]() =1, OR?
=1, OR?![]() =0,?
=0,?
? ? ? ?no matter how?![]() ?changes, the?
?changes, the?![]() ?must be?0
?must be?0
?? ? ??the left equation?![]() is always equivalent to the right equation?
is always equivalent to the right equation?
![]() , inside the feasible solution area. but we require
, inside the feasible solution area. but we require ![]() >0, since Any data point for which
>0, since Any data point for which = 0 will not appear in the sum (7.13
 ![]() ) and hence plays no role in making predictions for new data points.
) and hence plays no role in making predictions for new data points.
#1.?![]() >1,?
>1,?![]() >0
>0
? ? ???if?![]() =0 then?the left equation?
=0 then?the left equation?![]() ?is equivalent to?
?is equivalent to? ???, but we need to drop it, the reason see above(#0.).?
?? ? ??if?![]() >0 then the left equation?
>0 then the left equation?![]() ?is not equivalent to?
?is not equivalent to?
? ? ? ??then?![]() ? -->?
? -->?![]() ,?
,? --> -
--> -![]() , so we need to?maximize?
, so we need to?maximize?![]() (close to 0)?to?let the right equation??
(close to 0)?to?let the right equation??
![]() ?is equivalent/close?to the left equation?
?is equivalent/close?to the left equation?![]() ?
?
![]() ?==>
?==>![]() ?+?maximize
?+?maximize
#2. minimize?![]() s.t.?
s.t.?![]() ?==>?minimize{?
?==>?minimize{?![]() ?+?maximize
?+?maximize ?}==>
?}==> ==>When the Slater theorem is satisfied and the process meets the KKT condition, the original problem is transformed into a dual problem==>
 (dual problem)
?#############
soft margin classificationhttps://blog.csdn.net/Linli522362242/article/details/104151351
Gaussian naive Bayes(高斯朴素贝叶斯)
适用于连续变量,其假定各个特征 𝑥_𝑖 在各个类别𝑦下是服从正态分布的,算法内部使用正态分布的概率密度函数来计算概率。?
? ? ? ?假设训练集中包含连续值 x,我们按照类别将数据分类,并计算每个分类的均值和偏差。
??μ_k是对应类别 ![]() 下 x 值的均值,
下 x 值的均值,![]() 是方差。
是方差。
??假设我们已经收集到一些新观测值 v。在给定分类 ![]() 下 v 的概率分布 p(x = v | Ck) 可以通过将 v 带入到由 μ_k 和
下 v 的概率分布 p(x = v | Ck) 可以通过将 v 带入到由 μ_k 和 ![]() 决定的高斯分布公式中得到。
决定的高斯分布公式中得到。
Training?
models = {
    'log_reg': linear_model.LogisticRegression(C=C),
    'gauss_nb': GaussianNB(),
    'svm': SVC(C=C, gamma='auto') # if ‘auto’, uses 1 / n_features.
    # if gamma='scale' (default) is passed then it uses 1 / (n_features * X.var()) as value of gamma, # Changed in version 0.22: The default value of gamma changed from ‘auto’ to ‘scale’.
    # Kernel coefficient for ‘rbf’, ‘poly’ and ‘sigmoid’.
}

def fit_models(data): #A function that fits all models.
    mfit = {model: models[model].fit(data[cols_bin], # lag_1,lag_2
                                     data['direction'] #data['direction'] = np.sign(data['returns']).astype(int)
                                    )
            for model in models.keys()
           }
data.head()
Prediction:?
fit_models(data)

def derive_positions(data):# A function that derives all position values from the fitted models.
    for model in models.keys():
        data['pos_' + model] = models[model].predict(data[cols_bin])

derive_positions(data)
? ? ?Second, the vectorized backtesting of the resulting trading strategies(log_return).?
def evaluate_strats(data):
    global sel
    sel=[]
    for model in models.keys():
        col = 'strat_' + model
        data[col] = data['pos_'+model] * data['returns']
        sel.append(col)
    sel.insert(0, 'returns')

evaluate_strats(data)
sel.insert(1, 'strat_freq')

data.head()
?Returns:
sel?![]()
#Some strategies might show the exact same performance.
#data[['returns', 'strat_freq','strat_log_reg','trat_gauss_nb','strat_svm']]
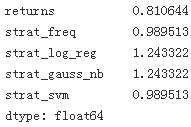
data[sel].sum().apply(np.exp)
?
data[sel].columns?
colormap={
    'returns':'m',  #puple-red
    'strat_freq':'y', #yellow
    'strat_log_reg':'b', #blue
    'strat_gauss_nb':'k', #black
    'strat_svm':'r'  #red
}

data[sel].cumsum().apply(np.exp).plot(figsize=(10,6),
                                      title='Performance of EUR/USD and classification-based trading strategies (two binary lags) over time',
                                      style=colormap
                                     )
#Some strategies might show the exact same performance.?
 Figure 15-12. Performance of EUR/USD and classification-based trading strategies (two binary lags) over time
data[['strat_freq', 'strat_log_reg']].cumsum().apply(np.exp).plot(figsize=(10,6),
                                      title='Performance of EUR/USD and classification-based trading strategies (two binary lags) over time',
                                      style=colormap
                                     )
Five Binary Features
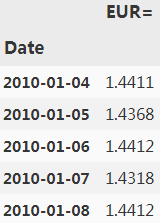
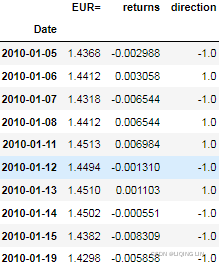
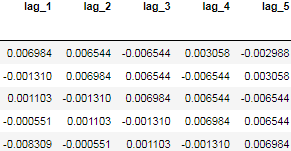
? ? ?In an attempt to improve the strategies’ performance, the following code works with five binary lags instead of two. In particular, the performance of the SVM-based strategy is significantly improved (see Figure 15-13). On the other hand, the performance of the LR- and GNB-based strategies is worse:
data = pd.DataFrame(raw[symbol])
data.head()
?
data['returns'] = np.log(data/data.shift(1))
# d:\Anaconda3\lib\site-packages\ipykernel_launcher.py:1: RuntimeWarning: invalid value encountered in sign
#  """Entry point for launching an IPython kernel.
data.dropna(inplace=True)
#or data['direction'] = np.sign(data['returns']).astype(int)
data['direction'] = np.sign(data['returns'])

data.head(n=10)
?
lags =5 #Five lags of the log returns series are now used.
def create_lags(data):
    global cols
    cols = []
    for lag in range(1, lags+1):
        col = 'lag_{}'.format(lag)
        data[col] = data['returns'].shift(lag)
        cols.append(col)

create_lags(data)
data.dropna(inplace=True)
data.head()
?
def create_bins(data, bins=[0]):
    global cols_bin
    cols_bin =[]
    for col in cols:
        col_bin = col + '_bin'
        #Digitizes the feature values given the bins parameter.
        data[col_bin] = np.digitize(data[col], bins=bins)
        cols_bin.append(col_bin)  #list

create_bins(data)#The real-valued features data is transformed to binary data
cols_bin
?
data[cols_bin].head()? <==
<==
fit_models(data) # fit with Xs=data[cols_bin] and Y=data['direction']
derive_positions(data) #prediction

def evaluate_strats(data):
    global sel
    sel=[]
    for model in models.keys():
        col = 'strat_' + model         # data['returns'] = np.log(data/data.shift(1))
        data[col] = data['pos_'+model] * data['returns']
        sel.append(col)
    sel.insert(0, 'returns') # sel:['returns','strat_log_reg','strat_gauss_nb','strat_svm']
evaluate_strats(data) #result

data.head()
data[sel].sum().apply(np.exp)?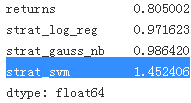 svm uses?kernel='rbf',
![]() ?gamma ‘auto’, uses 1 / n_features.
?gamma ‘auto’, uses 1 / n_features.
Note: if you use ?gamma='scale'?(default) is passed then it uses 1 / (n_features * X.var()) as value of gamma, here you will get better result on strat_svm.
data[sel].cumsum().apply(np.exp).plot(figsize=(10,6),
                                      title='Performance of EUR/USD and classification-based trading strategies (five binary lags) over time'
                                     )
Figure 15-13. Performance of EUR/USD and classification-based trading strategies (five binary lags) over time
? ? ?In an attempt to improve the strategies’ performance, the following code works with five binary lags instead of two. In particular, the performance of the SVM-based strategy is significantly improved(see Figure). On the other hand, the performance of the LR- and GNB-based strategies is worse.
Five Digitized Features
? ? ?Finally, the following code uses the first and second moment of the historical log returns to digitize the features data, allowing for more possible feature value combinations. This improves the performance of all classification algorithms used, but for SVM the improvement is again most pronounced (see Figure 15-14):
# A histogram is a representation of the distribution of data. This function calls
# default 10 bins
data['returns'].hist(bins=35, figsize=(10,6))
# or plt.hist( data['returns'], bins=35, label='frequency', color='b')
plt.title('Histogram of log returns for EUR/USD exchange rate')
# data[cols]<==data['returns'].shift(1,2,3,4,5)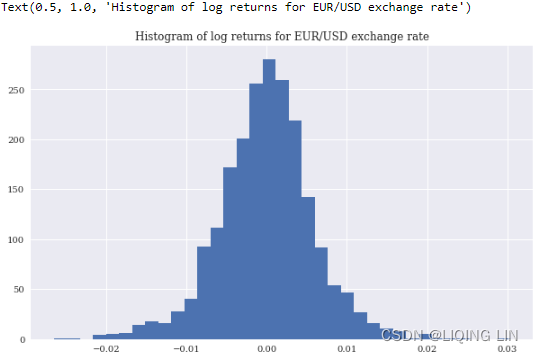 ?
?
# to digitize the features data.
mu = data['returns'].mean() #The mean log return and
std = data['returns'].std() #the standard deviation are used

#to digitize the features data.
bins = [mu-std, mu, mu+std]
bins
cols?![]()
def create_bins(data, bins=[0]):
    global cols_bin
    cols_bin =[]
    for col in cols:
        col_bin = col + '_bin'
        #Digitizes the feature values given the bins parameter.
        data[col_bin] = np.digitize(data[col], bins=bins) #return the index
        cols_bin.append(col_bin)  #list

create_bins(data, bins)
data[cols_bin].head()
? <==
<==
data['lag_1_bin'].hist()?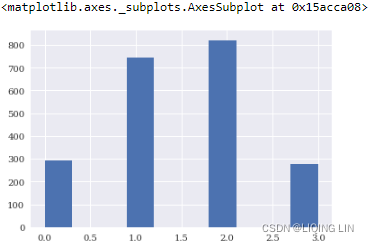
data.head()
def fit_models(data): #A function that fits all models.
    mfit = {model: models[model].fit(data[cols_bin], # lag_1_bin,lag_2_bin,...,lag_5_bin
                                     data['direction'] #data['direction'] = np.sign(data['returns']).astype(int)
                                    )
            for model in models.keys()
           }

fit_models(data)

def derive_positions(data):#A function that derives all position values from the fitted models.
    for model in models.keys():
        data['pos_' + model] = models[model].predict(data[cols_bin])

derive_positions(data) # prediction

def evaluate_strats(data):
    global sel
    sel=[]
    for model in models.keys():
        col = 'strat_' + model
        data[col] = data['pos_'+model] * data['returns']
        sel.append(col)
    sel.insert(0, 'returns')

evaluate_strats(data)

data[sel].sum().apply(np.exp)
?
colormap={
    'returns':'m',  #puple-red
    'strat_freq':'y', #yellow
    'strat_log_reg':'g', #green
    'strat_gauss_nb':'r', #red
    'strat_svm':'b'  #blue
}
data[sel].cumsum().apply(np.exp).plot(figsize=(10,6),
                                      title='Performance of EUR/USD and classification-based trading strategies (five digitized lags) over time'
                                      ,style=colormap
                                     )
#####################################################
TYPES OF FEATURES
? ? ?This chapter exclusively works with lagged return data as features data, mostly in binarized or digitized form. This is mainly done for convenience, since such features data can be derived from the financial time series itself. However, in practical applications the features data can be gained from a wealth of different data sources and might include other financial time series and statistics derived thereof 衍生的统计数据, macroeconomic data, company financial indicators, or news articles. Refer to López de Prado (2018) for an in-depth discussion of this topic. There are also Python packages for automated time series feature extraction available, such as tsfresh.
#####################################################
Sequential Train-Test Split
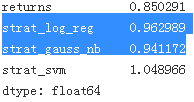
? ? ?To better judge the performance of the classification algorithms, the code that follows implements a sequential train-test split. The idea here is to simulate the situation where only data up to a certain point in time is available on which to train an ML algorithm模拟只有到某个时间点的数据才能用于训练 ML 算法的情况. During live trading, the algorithm is then faced with data it has never seen before. This is where the algorithm must prove its worth. In this particular case, all classification algorithms outperform — under the simplified assumptions from before — the passive benchmark investment, but only the GNB and LR algorithms achieve a positive absolute performance.
len(data)![]()
split = int(len(data) * 0.5)
split?![]()
#copy reference: https://blog.csdn.net/u010712012/article/details/79754132
train = data.iloc[:split].copy()
test = data.iloc[split:].copy()

#Trains all classification algorithms on the training data
# cols_bin : lag_1_bin	lag_2_bin	lag_3_bin	lag_4_bin	lag_5_bin
# Xs=data[cols_bin]
# Y=data['direction'] #data['direction'] = np.sign(data['returns']).astype(int)
fit_models(train)

derive_positions(test) #prediction

def evaluate_strats(data):
    global sel
    sel=[]
    for model in models.keys():
        col = 'strat_' + model
        data[col] = data['pos_'+model] * data['returns']
        sel.append(col)
    sel.insert(0, 'returns')

evaluate_strats(test) #result

test[sel].sum().apply(np.exp)
?
colormap={
    'returns':'m',  #puple-red
    'strat_freq':'y', #yellow
    'strat_log_reg':'b', #blue
    'strat_gauss_nb':'k', #black
    'strat_svm':'r'  #red
}
test[sel].cumsum().apply(np.exp).plot(figsize=(10,6),
                                      title='Performance of EUR/USD and classification-based trading strategies (sequential train-test split)'
                                      ,style=colormap
                                     )
Figure 15-15. Performance of EUR/USD and classification-based trading strategies (sequential train-test split)? ? ? ? ? ? ? ? ? all classification algorithms outperform — under the simplified assumptions from before — the passive benchmark investment, but only the GNB and LR algorithms achieve a positive absolute performance(always)( their returns > the return of?the passive benchmark investment)
?#########################
colormap={
    'returns':'y',  #puple-red
    'strat_freq':'y', #yellow
    'strat_log_reg':'b', #blue
    'strat_gauss_nb':'k', #black
    'strat_svm':'r'  #red
}

test[['returns','strat_log_reg','strat_gauss_nb']].cumsum().apply(np.exp).plot(figsize=(10,6),
                                      title='Performance of EUR/USD and classification-based trading strategies (sequential train-test split)'
                                      ,style=colormap
                                     )
colormap={
    'returns':'y',  #puple-red
    'strat_freq':'y', #yellow
    'strat_log_reg':'b', #blue
    'strat_gauss_nb':'k', #black
    'strat_svm':'r'  #red
}

test[['returns','strat_svm',]].cumsum().apply(np.exp).plot(figsize=(10,6),
                                      title='Performance of EUR/USD and classification-based trading strategies (sequential train-test split)'
                                      ,style=colormap
                                     )
?
only the GNB and LR algorithms achieve a?positive?absolute?performance(always)
?#########################
Randomized Train-Test Split
? ? ?The classification algorithms are trained and tested on binary or digitized features data. The idea is that the feature value patterns allow a prediction of future market movements with a better hit ratio than 50%. Implicitly, it is assumed that the patterns’ predictive power persists[p?r?s?st][p?r?s?st] over time. In that sense, it shouldn’t make (too much of) a difference on which part of the data an algorithm is trained and on which part of the data it is tested — implying that one can break up the temporal sequence时间顺序 of the data for training and testing.
? ? ?A typical way to do this is a randomized train-test split to test the performance of the classification algorithms out-of-sample — again trying to emulate reality, where an algorithm during trading is faced with new data on a continuous basis. The approach used is the same as that applied to the sample data in “Train-test splits: Support vector machines”. Based on this approach, the SVM algorithm shows again the best performance out-of-sample
from sklearn.model_selection import train_test_split

# shuffle bool, default=True: Whether or not to shuffle the data before splitting
train, test = train_test_split(data, test_size=0.5, shuffle=True, random_state=100)

train.head()
#Train and test data sets are copied and brought back in temporal order.
train = train.copy().sort_index()
train.head()

train[cols_bin].head()?
test = test.copy().sort_index()def fit_models(data): #A function that fits all models.
mfit = {model: models[model].fit(data[cols_bin], # lag_1,lag_2
data['direction'] #data['direction'] = np.sign(data['returns']).astype(int)
)
for model in models.keys()
}
fit_models(train) #training
def derive_positions(data):#A function that derives all position values from the fitted models.
for model in models.keys():
data['pos_' + model] = models[model].predict(data[cols_bin])
derive_positions(test) #prediction
def evaluate_strats(data):
global sel
sel=[]
for model in models.keys():
col = 'strat_' + model
data[col] = data['pos_'+model] * data['returns']
sel.append(col)
sel.insert(0, 'returns')
evaluate_strats(test) #result
test[sel].sum().apply(np.exp)?
colormap={
    'returns':'m',  #puple-red
    'strat_freq':'w', #white
    'strat_log_reg':'y', #yellow
    'strat_gauss_nb':'r', #red
    'strat_svm':'b'  #blue
}
test[sel].cumsum().apply(np.exp).plot(figsize=(10,6),
                                      title='Performance of EUR/USD and classification-based trading strategies (randomized train-test split)'
                                      ,style=colormap
                                     )
? (Randomized Train-Test Split) results are not ideal because there are seasonal factors and trends in this time serieshttps://blog.csdn.net/Linli522362242/article/details/123606731
Based on this approach, the SVM algorithm shows again the best performance out-of-sample???
I don't think so!!! (the performance of the SVM is the worst.
Deep Neural Networks
? ? ?Deep neural networks (DNNs) try to emulate the functioning of the human brain. They are in general composed of an input layer (the features), an output layer (the labels), and a number of hidden layers. The presence of hidden layers is what makes a neural network deep. It allows it to learn more complex relationships and to perform better on a number of problem types. When applying DNNs one generally speaks of deep learning instead of machine learning. For an introduction to this field, refer to Géron (2017) or Gibson and Patterson (2017). https://blog.csdn.net/Linli522362242/article/details/106433059
Figure 10-9. A modern MLP (including ReLU and softmax) for classification ? ?
? ?
Equation 4-19. Softmax score for class k ?![]()
Note that each class has its own dedicated parameter vector ![]() . All these vectors are typically stored as rows in a parameter matrix
. All these vectors are typically stored as rows in a parameter matrix ![]() . Note
. Note  ==b
==b
[ ? #class0, class1, ...., classN
? ? [b0==1, ?b0==1, ... repeat...],
? ? [b1, ? ? ? ?b1, ..., ? ? ?repeat...],
? ? ... ...
? ? [bk, ? ? ? ?bk, ... ? ? ? repeat...]
]
Theta: (number_of_theta=features plus the bias term?,?number of label names/class?)
![]() :? (number of label names/class?,?number_of_theta
:? (number of label names/class?,?number_of_theta![]() =features plus the bias term?)?
=features plus the bias term?)?
X_train( number of features plus the bias term, number of instances): one column is a instance,?
? ? ? ? ? ?[ [x_b0==1, ?x_b0==1, ... repeat...], [x_b1, ?x_b1, ... repeat...], ..., [x_bk, ?x_bk, ... repeat...]]
logits = ?![]() :
:![]() or?
or? ?; p is corresponding to features including bias/intercept
 ==>
==> ==>
==>
 https://blog.csdn.net/Linli522362242/article/details/106935910
- 'relu', the rectified linear unit function,
returns f(z) = max(0, z)
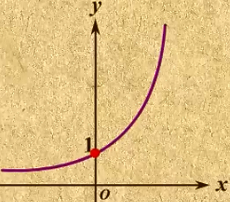
? ? ?Once you have computed the score of every class for the instance x, you can estimate the probability![]() ?that the instance belongs to class k by running the scores through the softmax function (Equation 4-20): it computes the exponential of every score, then normalizes them (dividing by the sum of all the exponentials)
?that the instance belongs to class k by running the scores through the softmax function (Equation 4-20): it computes the exponential of every score, then normalizes them (dividing by the sum of all the exponentials)
Equation 4-20. Softmax function?
- ? K is the number of classes.
- ? s(x) is a vector containing the scores of each class for the instance x.
- ?
 is the estimated probability that the instance x belongs to class k given the scores of each class for that instance.
Equation 4-21. Softmax Regression classifier prediction?![]()
? ? ?The argmax operator returns the value of a variable that maximizes a function. In this equation, it returns the value of k that maximizes the estimated probability![]() .
.
?##########################################
TIP
? ? ?The Softmax Regression classifier predicts only one class at a time (i.e., it is multiclass, not multioutput) so it should be used only with mutually exclusive classes such as different types of plants. You cannot use it to recognize multiple people in one picture.
##########################################
Equation 4-22. Cross entropy cost function?
![]() is equal to 1 if the target class for the ith instance is k; otherwise, it is equal to 0.
is equal to 1 if the target class for the ith instance is k; otherwise, it is equal to 0.
? ? ?Notice that when there are just two classes (K = 2), this cost function is equivalent to the Logistic Regression's cost function (log loss; see Equation 4-17? https://blog.csdn.net/Linli522362242/article/details/96480059
 is a weight vector: Theta = Theta - eta*gradients
? ? ?Regarding the loss function, since we are predicting probability distributions, the cross-entropy loss (also called the log loss, see https://blog.csdn.net/Linli522362242/article/details/104124771) is generally a good choice.
Table 10-2 summarizes the typical architecture of a classification MLP

DNNs with scikit-learn
? ? ?This section applies the MLPClassifier(Multi-Layer Perceptron) algorithm from scikit-learn, as introduced in “Deep neural networks”. First, it is trained and tested on the whole data set, using the digitized features. The algorithm achieves exceptional performance in-sample (see Figure 15-17), which illustrates the power of DNNs for this type of problem. It also hints at strong overfitting, since the performance indeed seems unrealistically good:
from sklearn.neural_network import MLPClassifier
# alpha: default=0.0001 L2 penalty (regularization term) parameter  # [250, 250]
#Increases the number of hidden layers and hidden units.
model = MLPClassifier(activation='relu', batch_size='auto', max_iter=1500,
                      solver='lbfgs', alpha=1e-3, hidden_layer_sizes= (250, 50), random_state=1)
2 layers?
data.head()
%time model.fit(data[cols_bin], data['direction'])
For small datasets, however, ‘lbfgs’ can converge faster and perform better.?
hidden_layer_sizes? ?tuple, length = n_layers - 2, default=(100,)
The ith element represents the number of neurons in the ith hidden layer.
###################
from sklearn.model_selection import GridSearchCV

param_grid = [
        {
            'activation' : ['relu'],
            'alpha':[1e-5, 1e-4,1e-3],
            'solver' : ['lbfgs'],
            'max_iter': [1500],
            'tol':[1e-5,1e-4, 1e-3],
            'hidden_layer_sizes': [
                (500,500),(600,200),(250,50),(250,250)
             ]
        }
       ]

clf = GridSearchCV(MLPClassifier(), param_grid, cv=3, scoring='accuracy')
clf.fit(data[cols_bin], data['direction'])

print("Best parameters set found on development set:")
print(clf.best_params_)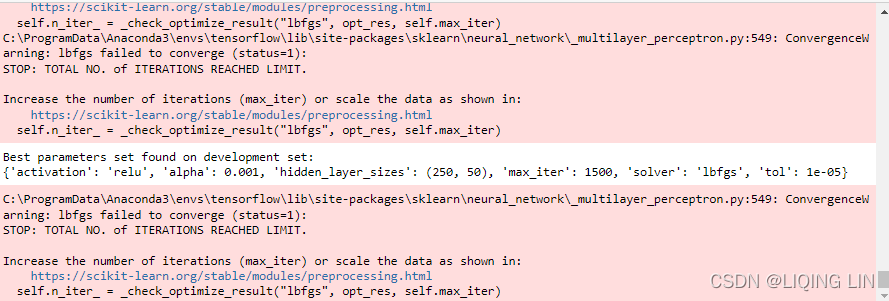
Besides, if you meet:
?Solution:
pip install scikit-learn -U
model.score(data[cols_bin], data['direction'])?![]()
| Return the mean accuracy on the given test data and labels. |
data['pos_dnn_sk'] = model.predict(data[cols_bin])
data['strat_dnn_sk'] = data['pos_dnn_sk'] * data['returns']

data[['returns', 'strat_dnn_sk']].sum().apply(np.exp)
? vs
vs![]()
data[['returns', 'strat_dnn_sk']].cumsum().apply(np.exp).plot(figsize=(10,6),
                                                               title='Performance of EUR/USD and DNN-based trading strategy (scikit-learn, in-sample)'
                                                              )
? ? ?To avoid overfitting of the DNN model, a randomized train-test split is applied next. The algorithm again outperforms the passive benchmark investment and achieves a positive absolute performance (Figure 15-18). However, the results seem more realistic now:
train, test = train_test_split(data, test_size=0.5, random_state=100)

train = train.copy().sort_index()
test = test.copy().sort_index()

#Increases the number of hidden layers and hidden units.
model = MLPClassifier(activation='relu', batch_size='auto', max_iter=1500,
                      solver='lbfgs', alpha=1e-3, hidden_layer_sizes= (500, 500), random_state=1)

%time model.fit(train[cols_bin], train['direction'])
?
model.score(train[cols_bin], train['direction'])?![]()
test['pos_dnn_sk'] = model.predict(test[cols_bin])
test['strat_dnn_sk'] = test['pos_dnn_sk'] * test['returns']

test[['returns', 'strat_dnn_sk']].sum().apply(np.exp)![]()
model.score(test[cols_bin], test['direction'])?![]()
test[['returns', 'strat_dnn_sk']].cumsum().apply(np.exp).plot(figsize=(10,6),
                                                              title='Performance of EUR/USD and DNN-based trading strategy (scikit-learn, randomized train-test split)'
                                                             )
DNNs with TensorFlow?
? ? ?TensorFlow has become a popular package for deep learning. It is developed and supported by Google Inc. and applied there to a great variety of machine learning problems. Zedah and Ramsundar (2018) cover TensorFlow for deep learning in depth
? ? ?As with scikit-learn, the application of the DNNClassifier algorithm from TensorFlow to derive an algorithmic trading strategy is straightforward given the background from “Deep neural networks”. The training and test data is the same as before. First, the training of the model. In-sample, the algorithm outperforms the passive benchmark investment and shows a considerable absolute return (see Figure 15-19), again hinting at overfitting
data['returns'].hist(bins=35, figsize=(10,6))
# OR plt.hist( data['returns'], bins=35, label='frequency', color='b')
plt.title('Histogram of log returns for EUR/USD exchange rate')
import tensorflow as tf
fc = []

for lag in cols_bin:
    fc.append( tf.feature_column.numeric_column( lag ) )
fc
data
since dataset is time series, I not using shuffle()
def input_fn():
    dataset = tf.data.Dataset.from_tensor_slices( ( dict( data[cols_bin] ),
                                                    data['direction'].apply(lambda x: 0 if x<0 else 1).values,
                                                  ) )
    dataset = dataset.repeat().batch(41) # 2132//41==52 batches, if data is not enough, then repeat reading data

    return dataset

def input_fn_predict():
    dataset = tf.data.Dataset.from_tensor_slices(  (dict( data[cols_bin] ),
                                                    None,
                                                   ) )
    dataset = dataset.batch(41)

    return dataset
model = tf.estimator.DNNClassifier( hidden_units=3*[500],
n_classes=2,
feature_columns=fc
)
%time model.train(input_fn=lambda: input_fn(), steps=250)#500?why 500 since I want a better performance
model.evaluate(input_fn=lambda: input_fn(), steps=1)?{'accuracy': 0.5121951,
'accuracy_baseline': 0.5609756,
'auc': 0.57125604,
'auc_precision_recall': 0.57080746,
'average_loss': 0.69247025,
'label/mean': 0.4390244,
'loss': 0.69247025,
'precision': 0.46153846,
'prediction/mean': 0.5037541,
'recall': 0.6666667,
'global_step': 500}
list( model.predict( input_fn = input_fn_predict,

                   )
    )
predict_dict=list( model.predict( input_fn = input_fn_predict,
                                  predict_keys='class_ids'
                                )
                 )
pred=[]
for p in predict_dict:
     pred.append( p['class_ids'][0] )# 'class_ids': array([1], dtype=int64) ==> extract first element 1
pred[:20]?![]()
data['pos_dnn_tf'] = np.where(np.asarray(pred)>0,1,-1)
data['pos_dnn_tf']
?
data['strat_dnn_tf'] = data['pos_dnn_tf'] * data['returns']
data[['returns', 'strat_dnn_tf']].sum().apply(np.exp)
? run previous code multiple times until here to get higher return
data[['returns', 'strat_dnn_tf']].cumsum().apply(np.exp).plot(figsize=(10,6),
                                                             title='Performance of EUR/USD and DNN-based trading strategy (TensorFlow, in-sample)'
                                                             )
? ? ?The following code again implements a randomized train-test split to get a more realistic view of the performance of the DNN-based algorithmic trading strategy. The performance is, as expected, worse out-of-sample (see Figure 15-20). In addition, given the specific parameterization the TensorFlow DNNClassifier underperforms the scikit-learn MLPClassifier algorithm by quite few percentage points:
import os

os.environ['PYTHONHASHSEED'] = '0'
tf.random.set_seed(0)
np.random.seed(0)
import keras.backend as K
K.clear_session()

model = tf.estimator.DNNClassifier(hidden_units=(500,500,500,250,50),
                                   n_classes=2,
                                   feature_columns=fc
                                  )
def input_fn_train():
    dataset = tf.data.Dataset.from_tensor_slices( ( dict( train[cols_bin] ),
                                                    train['direction'].apply(lambda x: 0 if x<0 else 1).values,
                                                  ) )
    dataset = dataset.shuffle(1000).repeat().batch(41) # 2132//41==52 batches, if data is not enough, then repeat reading data

    return dataset

def input_fn_eval():
    dataset = tf.data.Dataset.from_tensor_slices( ( dict( train[cols_bin] ),
                                                    train['direction'].apply(lambda x: 0 if x<0 else 1).values,
                                                  ) )
    dataset = dataset.repeat().batch(41) # 2132//41==52 batches, if data is not enough, then repeat reading data

    return dataset

def input_fn_predict():
    dataset = tf.data.Dataset.from_tensor_slices(  (dict( test[cols_bin] ),
                                                    None,
                                                   ) )
    dataset = dataset.batch(41)

    return dataset

train = train.copy().sort_index()
test = test.copy().sort_index()

%time model.train(input_fn=input_fn_train, steps=5000)
model.evaluate(input_fn=input_fn_eval, steps=1)
predict_dict=list( model.predict( input_fn = input_fn_predict,
                                  predict_keys='class_ids'
                                )
                 )
pred=[]
for p in predict_dict:
     pred.append( p['class_ids'][0] )# 'class_ids': array([1], dtype=int64) ==> extract first element 1
pred[:20]?![]()
test['pos_dnn_tf'] = np.where(np.asarray(pred)>0,1,-1)
test['strat_dnn_tf'] = test['pos_dnn_tf']*test['returns']

test[['returns','strat_dnn_sk', 'strat_dnn_tf']].sum().apply(np.exp)
?
colormap={
    'returns':'m',  #red
    'strat_dnn_sk':'y', #yellow
    'strat_dnn_tf':'r', #blue
}

test[['returns','strat_dnn_sk','strat_dnn_tf']].cumsum().apply(np.exp).plot(figsize=(10,6), style=colormap,
                                                                           title='Performance of EUR/USD and DNN-based trading strategy (TensorFlow, randomized train-test split)')

