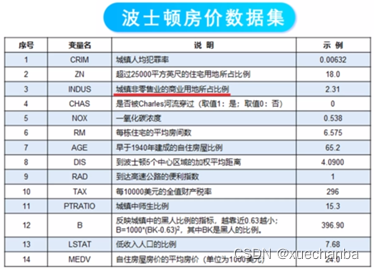
波士顿房价数据集
波士顿房价数据集中一共有506条数据,涵盖506个不同郊区的房屋数据。在机器学习中,通常要把数据集划分为训练数据集和测试数据集,在波士顿数据库中,默认其中404条是训练数据集,102条作为测试数据集。其中,每条数据有14个字段,包含13个属性和1个房价的平均值。

在使用数据集之前,首先要加载数据集,可以直接使用datasets模块访问数据集。这个数据集完整的前缀是tensorflow.keras,是Keras API在tensorflow中的实现。
下面使用代码来演示下如何加载波士顿房价数据集:
import tensorflow as tf

# 将这个数据集对象重命名为 boston_housing
boston_housing = tf.keras.datasets.boston_housing

# 使用这个数据集对象的load_data()方法加载数据集
(train_x, train_y), (test_x, test_y) = boston_housing.load_data()
波士顿房价数据集可视化
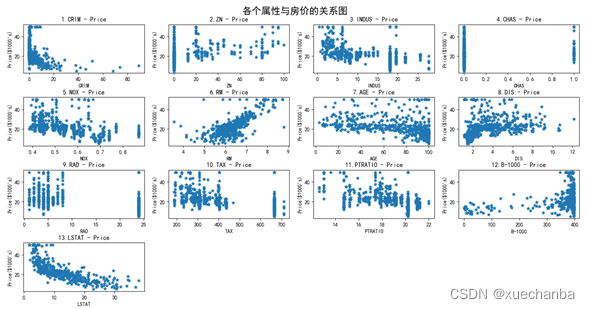
在“波士顿房价数据集”中,每条房屋信息有13个属性,有些明显对房价有直接的影响。为了找出对房价有直接影响的属性可以借助与数据可视化的方法。最直接的方法就是利用散点图把每一个属性与房价的关系表示出来。
最终把每一个属性与房价的关系表示如下:

从上图中可以看到,子图6、子图13与房价有比较接近于线性分布的关系。
这里以图13为例,也就是依图 “低收入人口的比例” 这个特征通过一元线性回归模型来预测房价(视频中以子图6为例,即依图 “每栋住宅的平均房间数” 这个特征来预测房价)。
import numpy as np
import matplotlib.pyplot as plt
import tensorflow as tf

# 第一步:加载数据集
# 将这个数据集对象重命名为 boston_housing
boston_housing = tf.keras.datasets.boston_housing
# 使用这个数据集对象的load_data()方法加载数据集
# 在第一次运行上述代码时,由于本地磁盘中没有这个数据集,会自动通过网络下载
(train_x, train_y), (test_x, test_y) = boston_housing.load_data()

print(train_x.shape)  # (404, 13)
print(train_y.shape)  # (404, )

print(test_x.shape)  # (102, 13)
print(test_y.shape)  # (102,)

# 第二步:数据处理
# 2.1 训练集
# 取出所有训练样本中的低收入人口的比例这个特征中的数据
x_train = train_x[:, 12]
# 取出所有训练样本中的房价
y_train = train_y

print(x_train.shape)  # (404, )
print(y_train.shape)  # (404, )
# 2.2 测试集
# 取出所有测试样本中的低收入人口的比例这个特征中的数据
x_test = test_x[:, 12]
# 取出所有测试样本中的房价
y_test = test_y
print(x_test.shape)  # (102, )
print(y_test.shape)  # (102, )

# 第三步:设置超参数
learn_rate = 0.004
itar = 10000
display_step = 1000

# 第四步:设置模型参数初始值
np.random.seed(612)
w = tf.Variable(np.random.randn())
b = tf.Variable(np.random.randn())

print(w.numpy().dtype)  # float32
print(b.numpy().dtype)  # float32

# 第五步:训练模型
mse_train = []
mse_test = []

for i in range(0, itar+1):

    with tf.GradientTape() as tape:

        pred_train = w * x_train + b
        # 训练集的损失函数
        Loss_train = 0.5 * tf.reduce_mean(tf.square(y_train - pred_train))

        # 我们只使用训练集中的数据来更新模型参数, 测试集并没有参与训练模型
        # 但是在每一次迭代中, 都使用当前的模型参数 w 和 b 计算测试集上的误差,
        # 并把它记录下来, 这样, 就可以实时观察模型在新样本上的表现, 这是训练的结果
        pred_test = w * x_test + b
        # 训练集的损失函数
        Loss_test = 0.5 * tf.reduce_mean(tf.square(y_test - pred_test))

    mse_train.append(Loss_train)  # 把训练集得到的均方误差加入列表 mse_train
    mse_test.append(Loss_test)  # 把训练集得到的均方误差加入列表 mse_test

    dL_dw, dL_db = tape.gradient(Loss_train, [w, b])

    # 然后使用迭代公式更新 w 和 b
    w.assign_sub(learn_rate * dL_dw)
    b.assign_sub(learn_rate * dL_db)

    if i % display_step == 0:
        print("i:%i, Loss_train:%f, Loss_test:%f, w:%f, b:%f" % (i, Loss_train, Loss_test, w.numpy(), b.numpy()))
在上面代码中,我们只使用训练集中的数据来更新模型参数,测试集并没有参与训练模型,但是在每一次迭代中,都使用当前的模型参数 w 和 b 计算测试集上的误差,并把它记录下来,这样,就可以实时观察模型在新样本上的表现,这是训练的结果。
运行代码来看下:需要注意超参数的设置。
比如,当我把超参数设置为:
# 第三步:设置超参数
learn_rate = 0.04
itar = 2000
display_step = 200
运行结果如下:
i:200, Loss_train:nan, Loss_test:nan, w:nan, b:nan
i:400, Loss_train:nan, Loss_test:nan, w:nan, b:nan
i:600, Loss_train:nan, Loss_test:nan, w:nan, b:nan
i:800, Loss_train:nan, Loss_test:nan, w:nan, b:nan
i:1000, Loss_train:nan, Loss_test:nan, w:nan, b:nan
i:1200, Loss_train:nan, Loss_test:nan, w:nan, b:nan
i:1400, Loss_train:nan, Loss_test:nan, w:nan, b:nan
i:1600, Loss_train:nan, Loss_test:nan, w:nan, b:nan
i:1800, Loss_train:nan, Loss_test:nan, w:nan, b:nan
i:2000, Loss_train:nan, Loss_test:nan, w:nan, b:nan
其中,nan(not a number)是 python 中的正无穷或负无穷,在数学表示上表示一个无法表示的数,这里一般还会有另一个表述inf,inf和nan的不同在于,inf是一个超过浮点表示范围的浮点数(其本质仍然是一个数,只是他无穷大,因此无法用浮点数表示,比如1/0),而nan则一般表示一个非浮点数(比如无理数)。
需要多次进行尝试:这里尝试将学习率的步长改小,并增加迭代次数,如下:
# 第三步:设置超参数
learn_rate = 0.004
itar = 20000
display_step = 2000
i:0, Loss_train:323.182312, Loss_test:338.826202, w:1.003872, b:-1.067985
i:2000, Loss_train:22.803719, Loss_test:22.358418, w:-0.629567, b:29.193001
i:4000, Loss_train:19.777174, Loss_test:17.785172, w:-0.885349, b:33.500927
i:6000, Loss_train:19.715799, Loss_test:17.480358, w:-0.921772, b:34.114372
i:8000, Loss_train:19.714552, Loss_test:17.443987, w:-0.926958, b:34.201710
i:10000, Loss_train:19.714529, Loss_test:17.438883, w:-0.927706, b:34.214306
i:12000, Loss_train:19.714529, Loss_test:17.438883, w:-0.927706, b:34.214306
i:14000, Loss_train:19.714529, Loss_test:17.438883, w:-0.927706, b:34.214306
i:16000, Loss_train:19.714529, Loss_test:17.438883, w:-0.927706, b:34.214306
i:18000, Loss_train:19.714529, Loss_test:17.438883, w:-0.927706, b:34.214306
i:20000, Loss_train:19.714529, Loss_test:17.438883, w:-0.927706, b:34.214306
从上面,可以看到,训练集和测试集在第 8000 — 12000 的时候就不再下降了,也就是说在 8000 — 12000 之间有一个迭代值是最佳迭代点。
如果我继续增加迭代次数会怎么样呢?
我试着增加到 50000 次,依旧没有下降。
我不准备继续往下尝试了,我决定将迭代次数调整为 10000 — 12000 之间的10001,发现依旧没有下降,所以说明这个临界值在 8000 — 10000之间,又取了9000,发现没到循环的值,所以最终确定这个值在 9000—10000之间,这里干脆直接取10000,也就是说确定的超参数值如下:
# 第三步:设置超参数
learn_rate = 0.004
itar = 9000
display_step = 1000
运行结果如下:
i:0, Loss_train:323.182312, Loss_test:338.826202, w:1.003872, b:-1.067985
i:1000, Loss_train:41.407585, Loss_test:43.136162, w:-0.137461, b:20.904873
i:2000, Loss_train:22.803719, Loss_test:22.358418, w:-0.629567, b:29.193001
i:3000, Loss_train:20.154444, Loss_test:18.614555, w:-0.815271, b:32.320656
i:4000, Loss_train:19.777174, Loss_test:17.785172, w:-0.885349, b:33.500927
i:5000, Loss_train:19.723450, Loss_test:17.555279, w:-0.911794, b:33.946308
i:6000, Loss_train:19.715799, Loss_test:17.480358, w:-0.921772, b:34.114372
i:7000, Loss_train:19.714710, Loss_test:17.453777, w:-0.925537, b:34.177784
i:8000, Loss_train:19.714552, Loss_test:17.443987, w:-0.926958, b:34.201710
i:9000, Loss_train:19.714533, Loss_test:17.440332, w:-0.927493, b:34.210724
i:10000, Loss_train:19.714529, Loss_test:17.438883, w:-0.927706, b:34.214306
可以看到,训练误差和测试误差都是一直单调递减的,在测试集上,损失的下降更快。
如果,再将步长进一步调小,同时再增加迭代次数,
// An highlighted block
var foo = 'bar';
看下结果:
i:0, Loss_train:323.182312, Loss_test:338.826202, w:0.088348, b:-1.153407
i:10000, Loss_train:41.426144, Loss_test:43.155861, w:-0.136430, b:20.887491
i:20000, Loss_train:22.809038, Loss_test:22.365143, w:-0.629048, b:29.184265
i:30000, Loss_train:20.155579, Loss_test:18.616602, w:-0.815026, b:32.316547
i:40000, Loss_train:19.777411, Loss_test:17.785940, w:-0.885232, b:33.498936
i:50000, Loss_train:19.723520, Loss_test:17.555780, w:-0.911715, b:33.944992
i:60000, Loss_train:19.715805, Loss_test:17.480490, w:-0.921748, b:34.113983
i:70000, Loss_train:19.714739, Loss_test:17.455072, w:-0.925349, b:34.174603
i:80000, Loss_train:19.714573, Loss_test:17.446005, w:-0.926663, b:34.196728
i:90000, Loss_train:19.714573, Loss_test:17.446005, w:-0.926663, b:34.196728
i:100000, Loss_train:19.714573, Loss_test:17.446005, w:-0.926663, b:34.196728
也是到一个值就出现循环现象了。
可视化输出
代码如下:
// An highlighted block
var foo = 'bar';
运行结果如下:

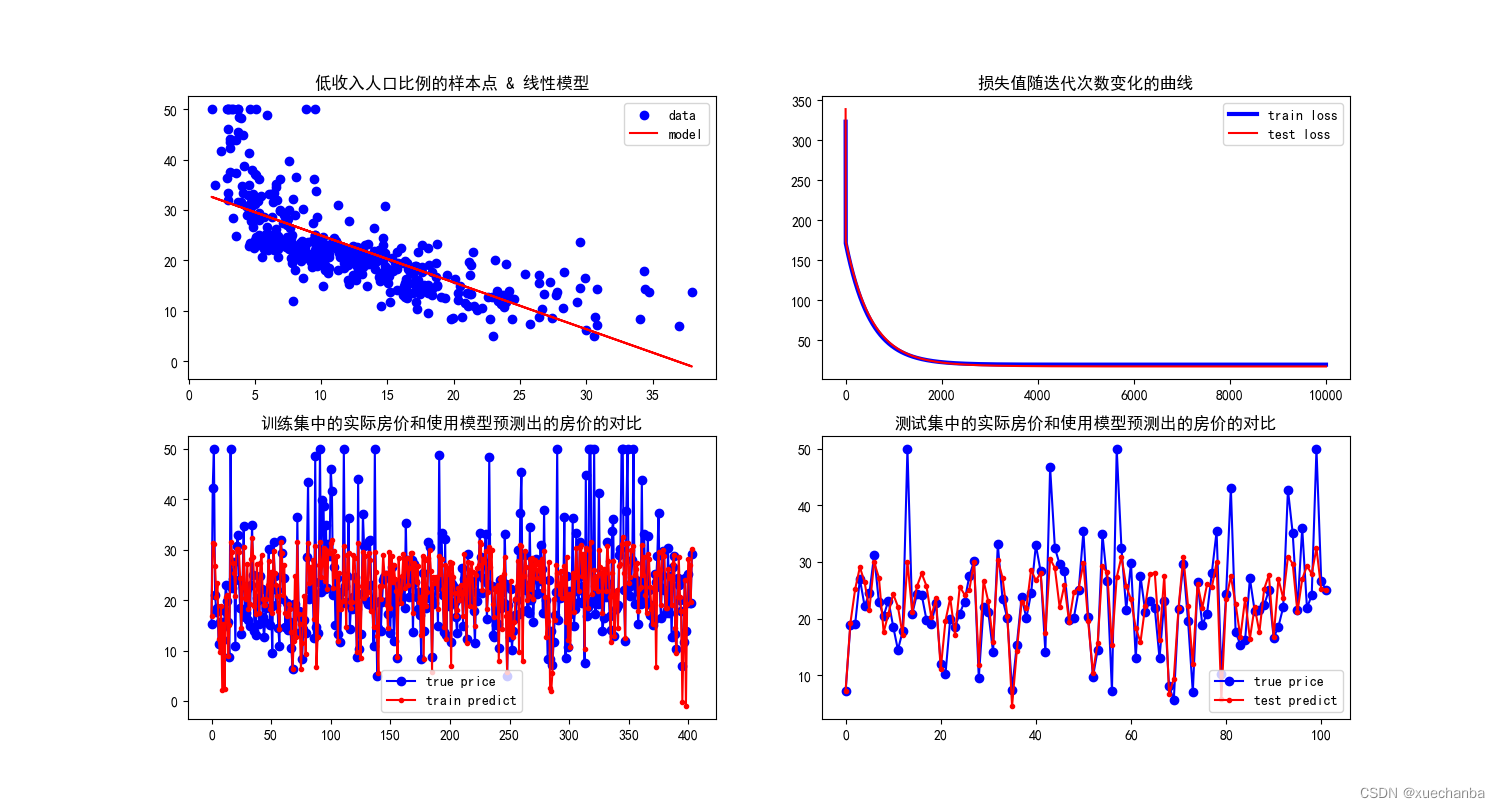
图1中,蓝色的点是特征为低收入人口比例的样本点的散点图,红色的直线是训练得到的线性模型,可以看到它能够比较好的反映出这些数据点的总体的变换规律。
图2中,这是损失值随迭代次数变化的曲线。在这个图中,蓝色的线是训练误差,红色的线是测试误差。可以看到,这两条线基本上是一致的。红色的线更低一些,这与刚才看到的运行输出结果也是一致的。
需要说明的是,一元线性回归的损失函数是一个凸函数,采用梯度下降法,只要步长足够小,迭代次数足够多,就一定可以通过不断地迭代到达极值点。但是,这样可能造成过度训练,产生过拟合。因此,需要同时观察训练误差和测试误差,如果两者同时下降,说明还可以继续训练,如果到达某个点后,训练误差继续下降,而测试误差不再下降,甚至开始上升了,那么就说明出现了过拟合。应该在这个点停下来。
图3中,是训练集中的实际房价和使用模型预测出的房价的对比。训练集中一共有404条数据,每个横坐标对应一个样本点,纵坐标是房价,蓝色的点是训练集中实际的房价,可以看出实际房价的波动范围更大。预测的房价和实际的房价总体的变化规律是一致的。
图4中,是测试集中的实际房价和使用模型预测出的房价的对比。测试集中一共有102条数据,每个横坐标对应一个样本点,纵坐标是房价。蓝色的点是测试集中实际的房价。
