文章目录
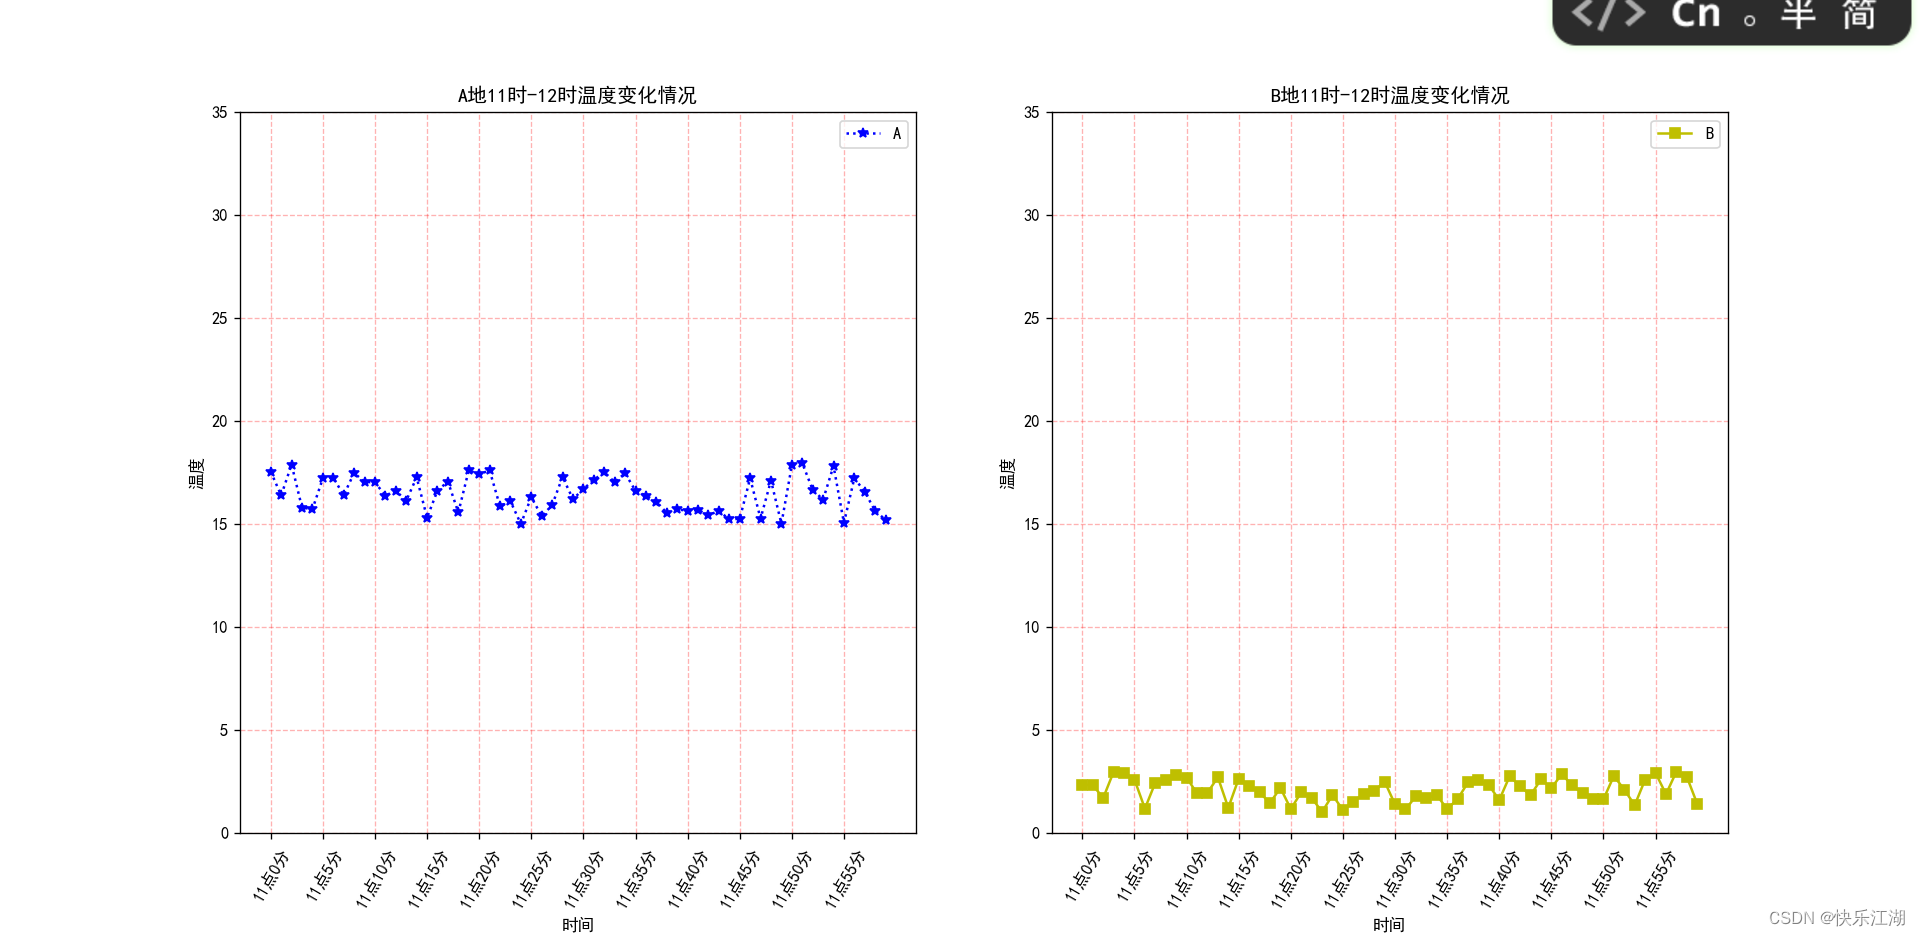
本节以绘制如下折线图为例,讲解在Matplotlib中如何绘图,其他类型的图与折线图差别不大。Matplotlib内容相当多,不要奢望能全部学完,下面所讲的内容可以说基本够用了,有其他需求时可以自行查阅Matplotlib官网
一:折线图绘制及保存图片(容器层)
(1)matplotlib.pyplot模块
matplotlib.pyplot包含了一系列类似于MATLAB的画图函数,作用于当前图形(Figure)的当前坐标系(Axes)
import matplotlib.pyplot as plt
(2)折线图的绘制及显示
Matplotlib绘制任何图像都遵从以下三步
- 创建画布
- 绘制图像
- 显示图像
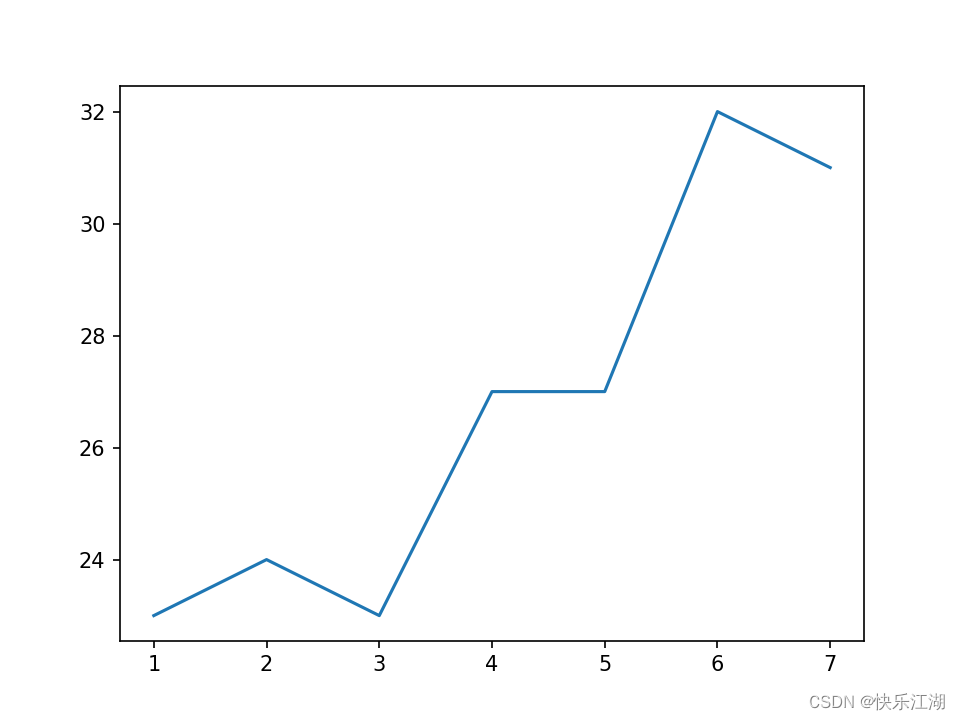
举例如下,下图显示的是某地一周内的天气变化情况
import matplotlib.pyplot as plt  # 导入


plt.figure()  # 创建新画布
plt.plot([1, 2, 3, 4, 5, 6, 7], [23, 24, 23, 27, 27, 32, 31])  # 绘图
plt.show()  # 显示
(3)设置画布属性
可以通过plt.figure(设置画布属性,用法如下
figure(num=None, figsize=None, dpi=None, facecolor=None, edgecolor=None, frameon=True)
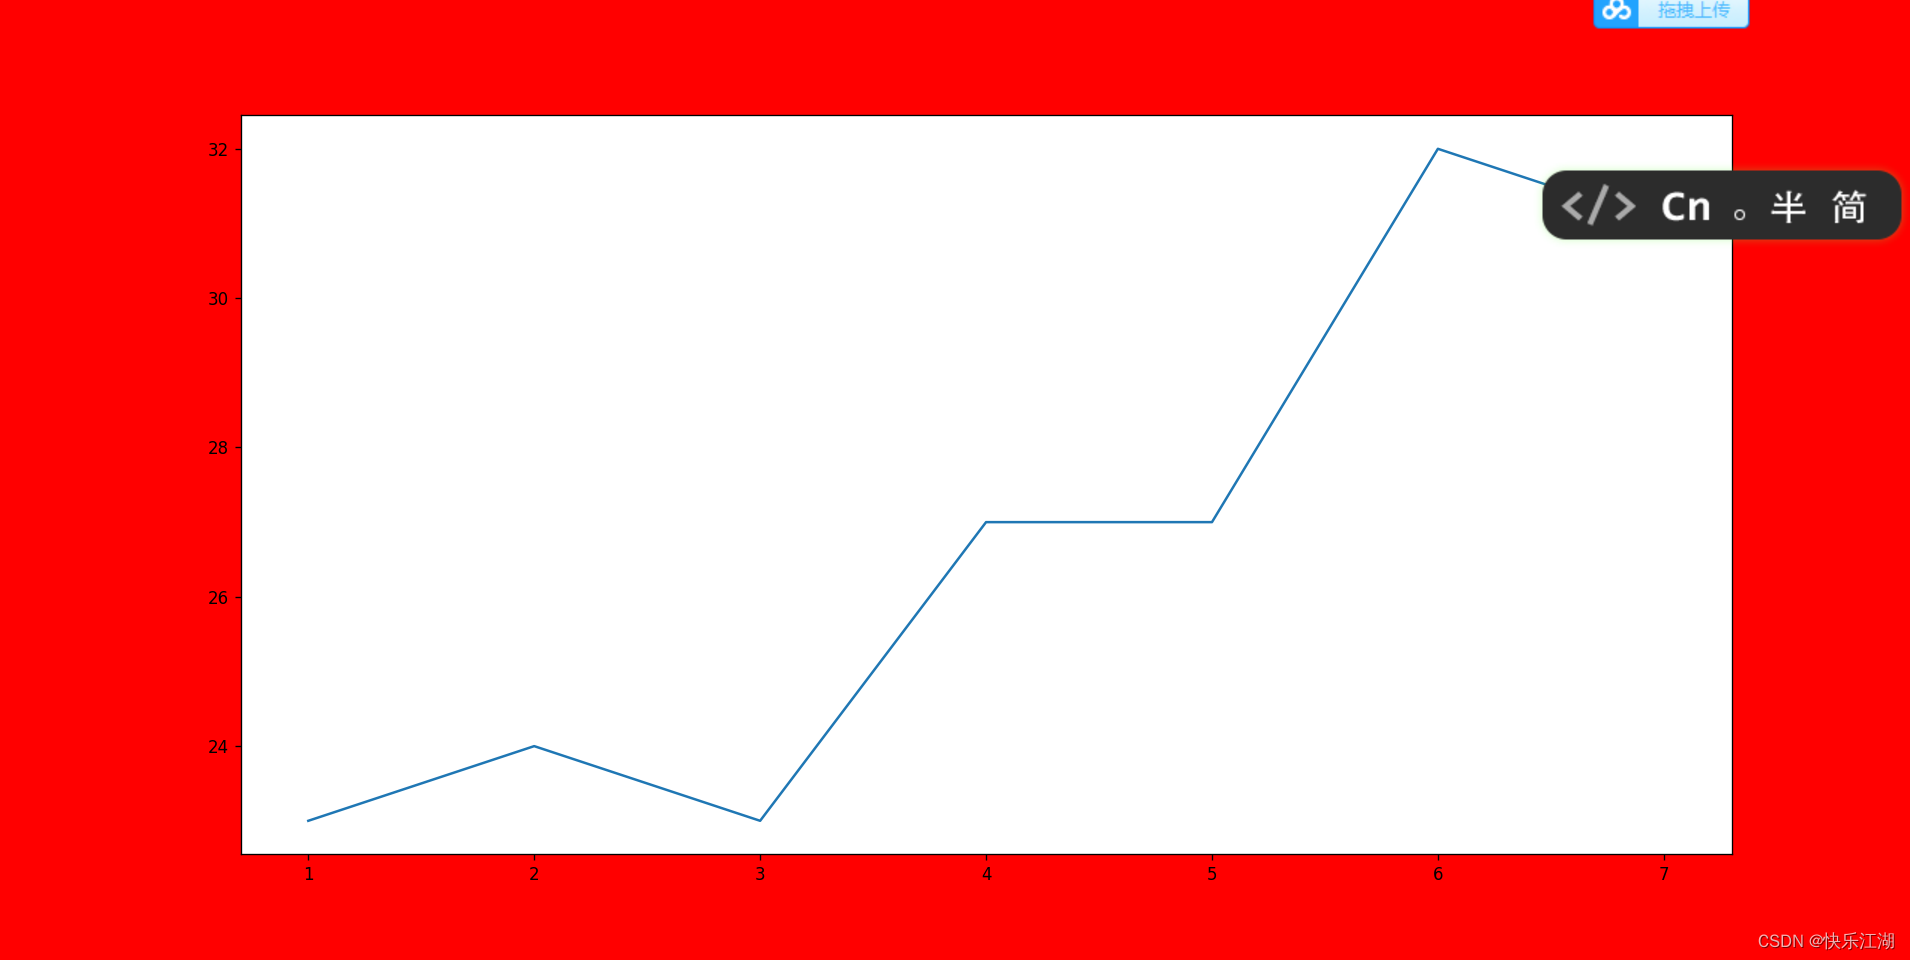
num:表示图像编号或名称;其中数字为编号 ,字符串为名称figsize:指定figure的宽和高,单位为英寸dpi:指定绘图对象的分辨率,即每英寸多少个像素,缺省值为80facecolor:背景颜色edgecolor:边框颜色frameon:是否显示边框
plt.figure(figsize=(20, 8), dpi=80, facecolor='red')  # 创建新画布
plt.plot([1, 2, 3, 4, 5, 6, 7], [23, 24, 23, 27, 27, 32, 31])  # 绘制折线图
plt.savefig(r"C:\Users\zhangxing\Desktop\test.png")
plt.show()  # 显示
(4)保存图片
使用plt.savefig()保存图片
plt.figure()  # 创建新画布
plt.plot([1, 2, 3, 4, 5, 6, 7], [23, 24, 23, 27, 27, 32, 31])  # 绘制折线图
plt.savefig(r"C:\Users\zhangxing\Desktop\test.png")
plt.show()  # 显示
二:折线图完善1(辅助显示层)
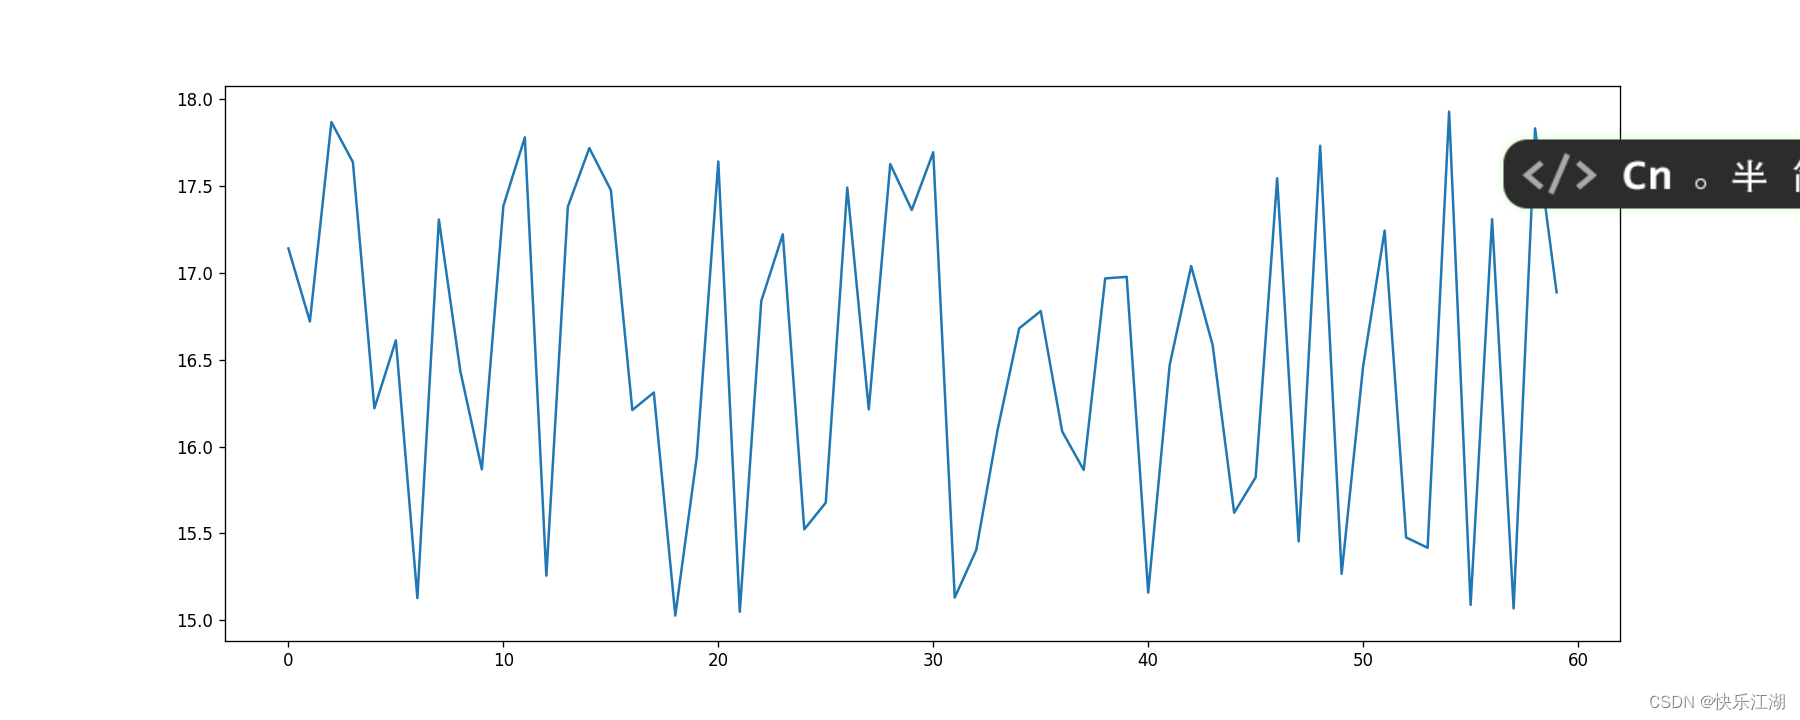
对于上面的折线图,现在要求:显示该城市某天11-12时内每分钟的温度变化情况。数据可以这样生成
x_minute = range(60)
y_temp = [random.uniform(15, 18) for i in x_minute]
绘制如下
import matplotlib.pyplot as plt  # 导入
import random

#  数据
x_minute = range(60)
y_temp = [random.uniform(15, 18) for i in x_minute]

# 绘图
plt.figure(figsize=(15, 6), dpi=80)
plt.plot(x_minute, y_temp)
plt.show()
(1)设置x、y轴刻度
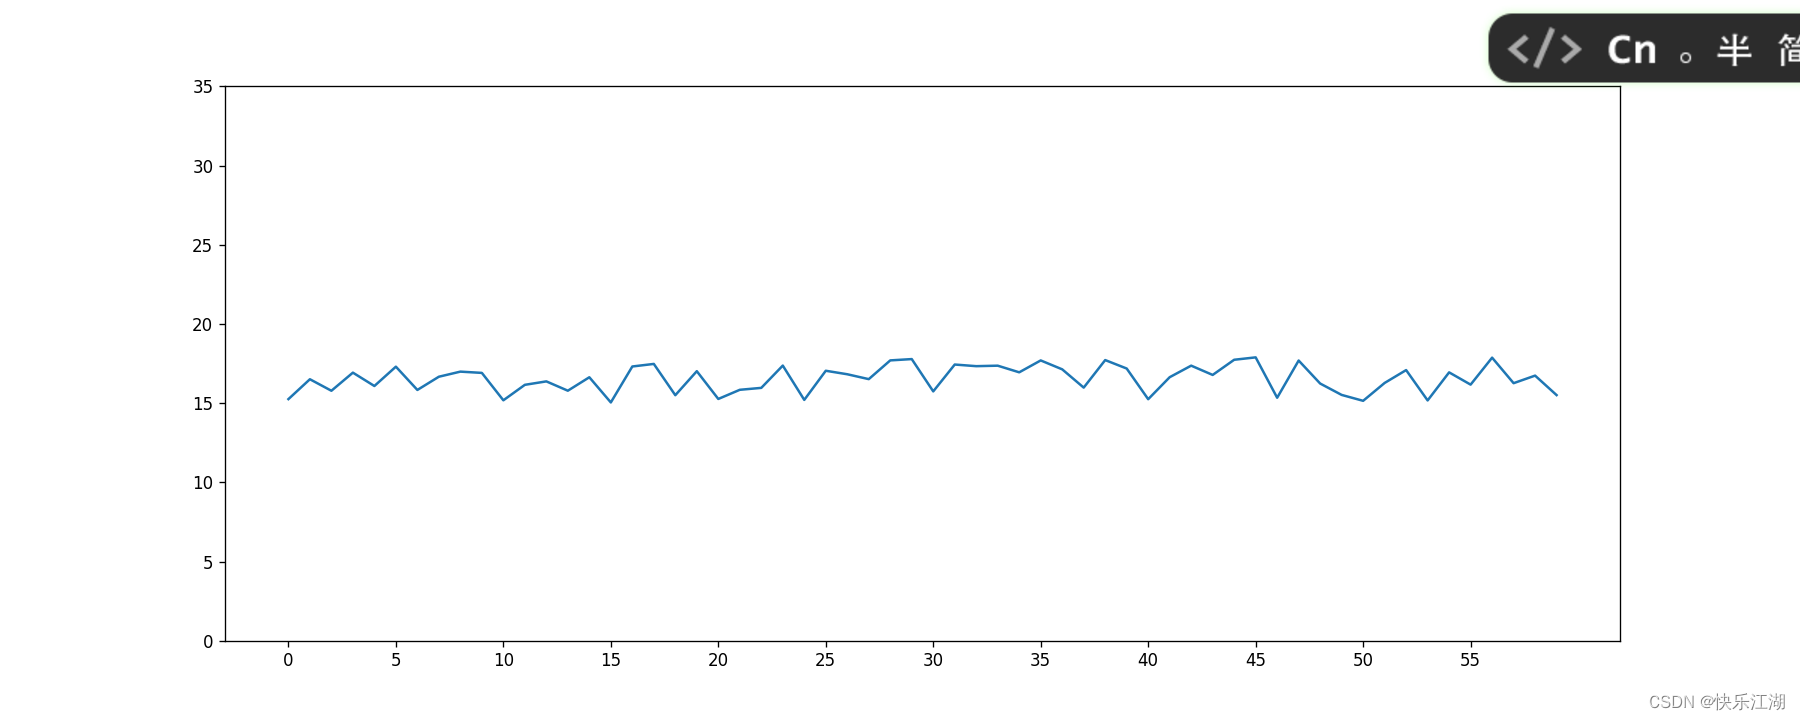
上图的x、y轴刻度显示的有些不合理,这会导致最终图像显示的巨大差异,可以借助xticks()和yticks()进行设定
以xticks()为例,它有三个参数
xticks(locs, [labels], **kwargs)
locs:是数组参数,用于设置X轴刻度间隔;例如你希望刻度显示为(0,2,4,6,8),那就可以写range(0, 10, 2)[labels]:是数组参数,用于设置每个间隔的显示标签kwargs:是关键字参数,用于设置标签字体倾斜度和颜色等外观属性
例如将上图x,y轴的间隔设置为5
import matplotlib.pyplot as plt  # 导入
import random

#  数据
x_minute = range(60)
y_temp = [random.uniform(15, 18) for i in x_minute]

# 绘图
plt.figure(figsize=(15, 6), dpi=80)
plt.plot(x_minute, y_temp)

# 修改刻度
plt.xticks(range(0, 60, 5))
plt.yticks(range(0, 40, 5))
plt.show()
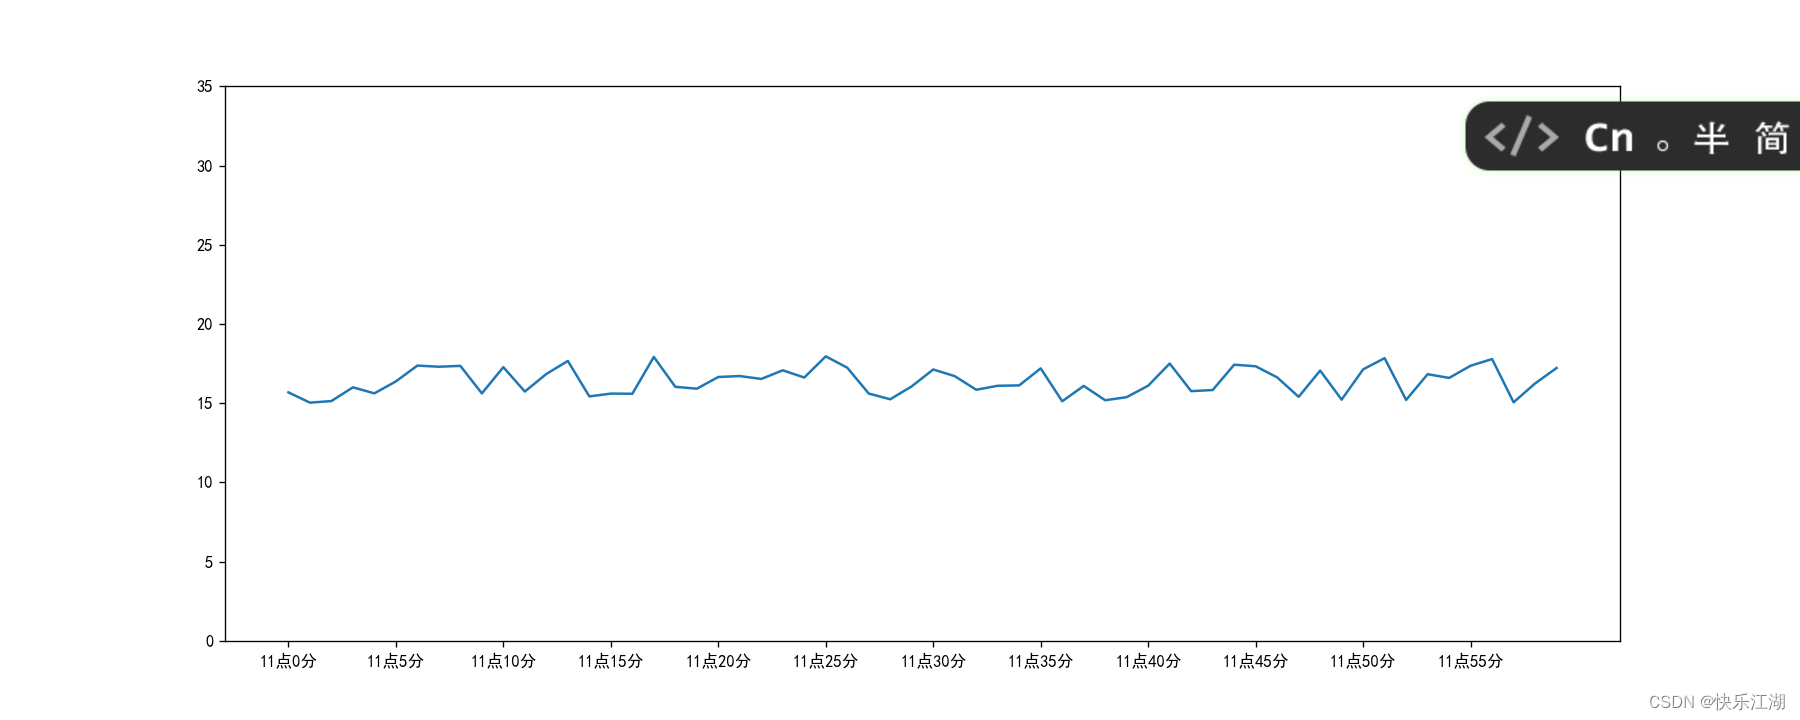
x轴刻度直接显示数组并不合理,现在需要将其转化为为**11点()**分的形式,方法如下
- 注意:matplotlib无法正常显示中文,所以需要下载SimHei(点击跳转下载),然后在代码进行设定(如下)
import matplotlib.pyplot as plt  # 导入
import random
plt.rcParams['font.sans-serif'] = ['SimHei']   # 用来正常显示中文标签
plt.rcParams['axes.unicode_minus'] = False   # 用来正常显示负号

#  数据
x_minute = range(60)
y_temp = [random.uniform(15, 18) for i in x_minute]

# 绘图
plt.figure(figsize=(15, 6), dpi=80)
plt.plot(x_minute, y_temp)

# 修改刻度
x_label = ["11点{}分".format(i) for i in x_minute]  # 显示标签
plt.xticks(range(0, 60, 5), x_label[::5])  # 特别注意标签的步长也要一直
plt.yticks(range(0, 40, 5))


plt.show()
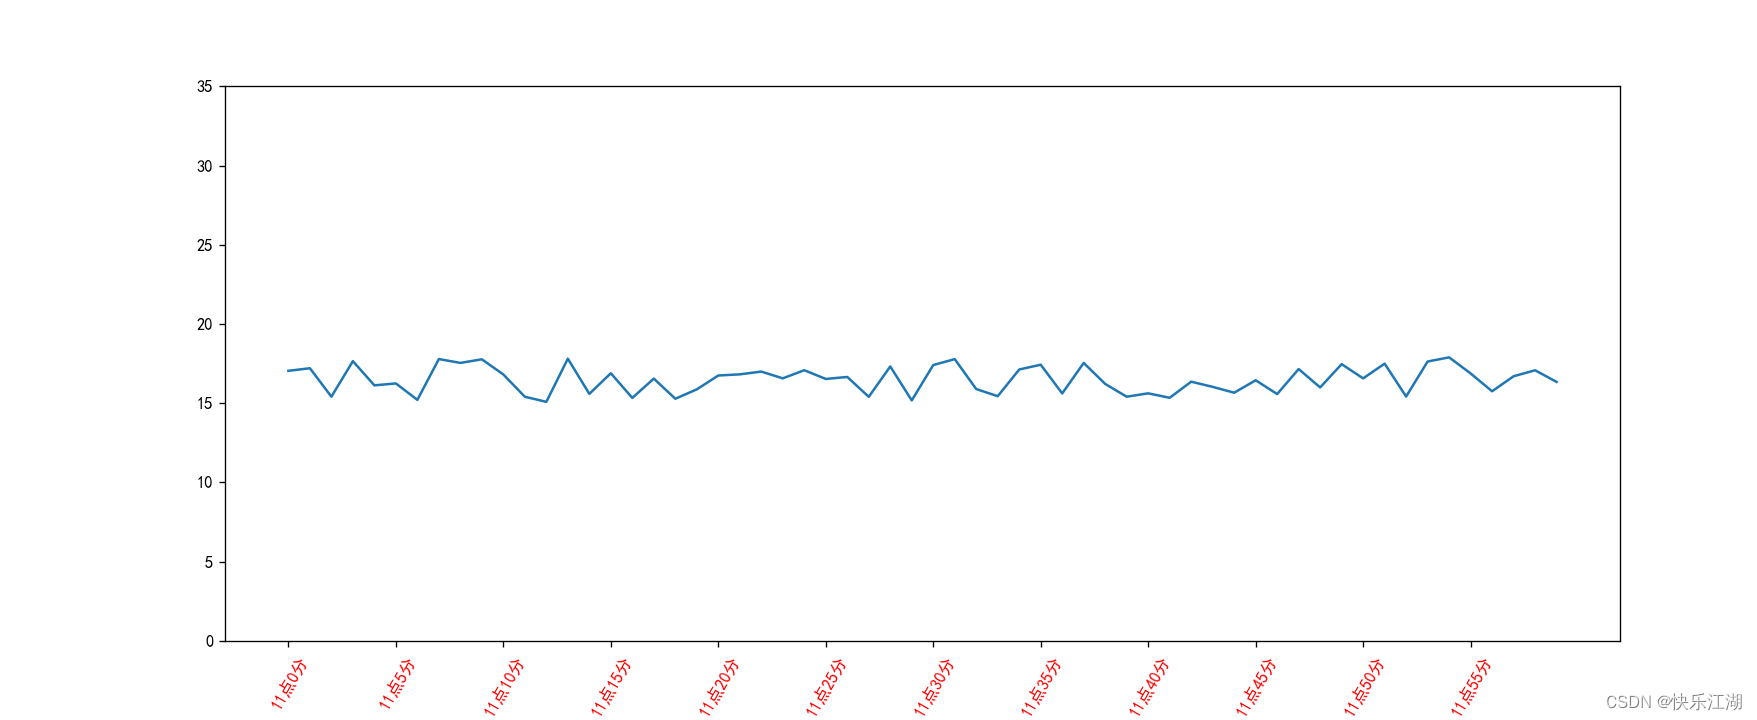
如果希望它倾斜一定角度和更改颜色,方法如下
import matplotlib.pyplot as plt  # 导入
import random
plt.rcParams['font.sans-serif'] = ['SimHei']   # 用来正常显示中文标签
plt.rcParams['axes.unicode_minus'] = False   # 用来正常显示负号

#  数据
x_minute = range(60)
y_temp = [random.uniform(15, 18) for i in x_minute]

# 绘图
plt.figure(figsize=(15, 6), dpi=80)
plt.plot(x_minute, y_temp)

# 修改刻度
x_label = ["11点{}分".format(i) for i in x_minute]  # 显示标签
plt.xticks(range(0, 60, 5), x_label[::5], color='red', rotation = 60)  # 特别注意标签的步长也要一直
plt.yticks(range(0, 40, 5))


plt.show()
(2)添加网格显示
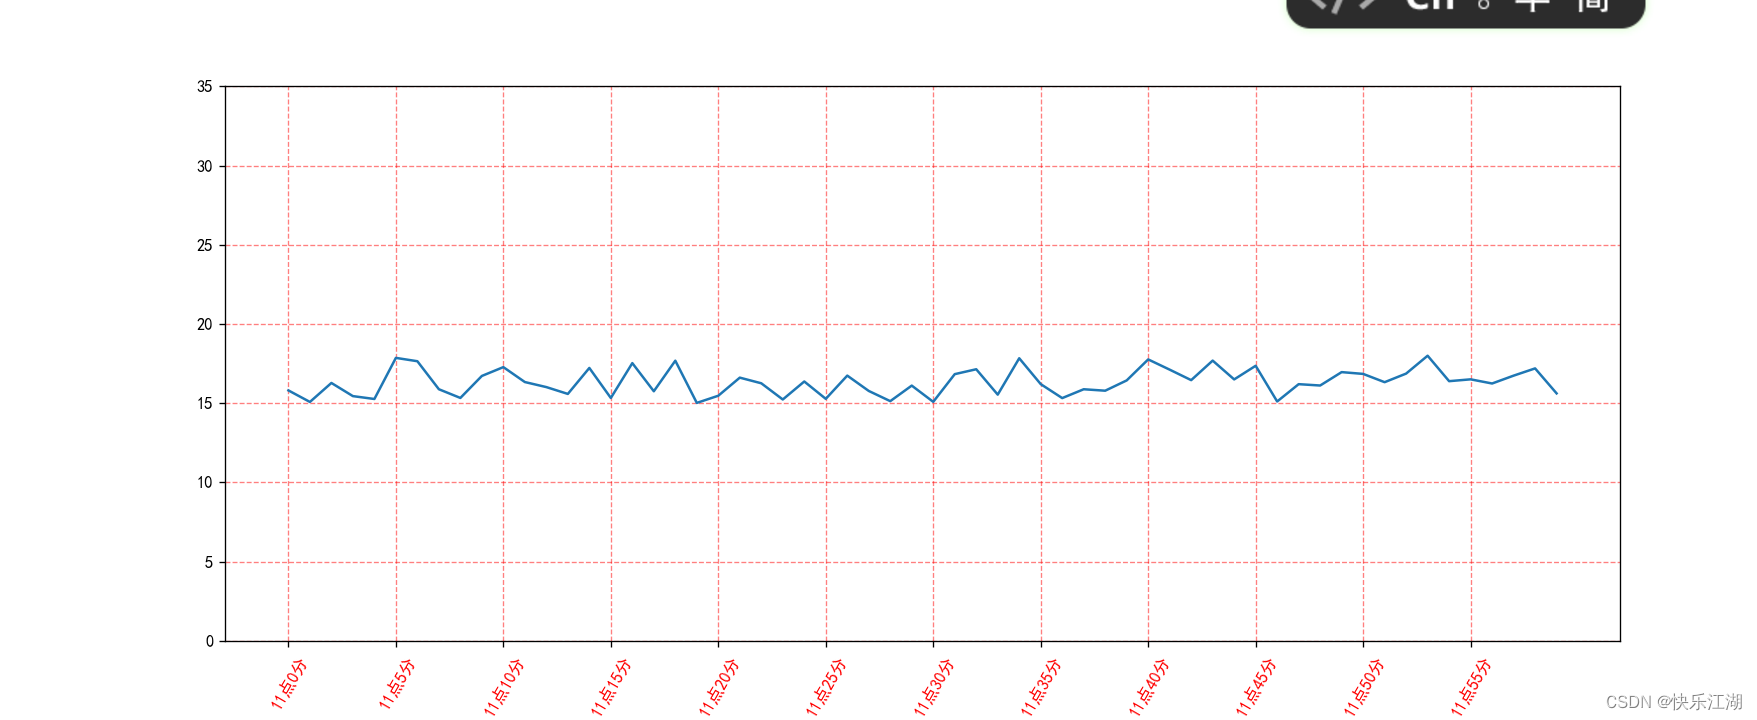
使用plt.grid()以显示网格
import matplotlib.pyplot as plt  # 导入
import random
plt.rcParams['font.sans-serif'] = ['SimHei']   # 用来正常显示中文标签
plt.rcParams['axes.unicode_minus'] = False   # 用来正常显示负号

#  数据
x_minute = range(60)
y_temp = [random.uniform(15, 18) for i in x_minute]

# 绘图
plt.figure(figsize=(15, 6), dpi=80)
plt.plot(x_minute, y_temp)

# 修改刻度
x_label = ["11点{}分".format(i) for i in x_minute]  # 显示标签
plt.xticks(range(0, 60, 5), x_label[::5], color='red', rotation=60)  # 特别注意标签的步长也要一直
plt.yticks(range(0, 40, 5))

# 显示网格
plt.grid(True, linestyle='--', alpha=0.5, color='red')


plt.show()
alpha:透明度
(3)添加描述信息
使用plt.xlabel()和plt.ylabel()增加坐标轴描述信息
import matplotlib.pyplot as plt  # 导入
import random
plt.rcParams['font.sans-serif'] = ['SimHei']   # 用来正常显示中文标签
plt.rcParams['axes.unicode_minus'] = False   # 用来正常显示负号

#  数据
x_minute = range(60)
y_temp = [random.uniform(15, 18) for i in x_minute]

# 绘图
plt.figure(figsize=(15, 6), dpi=80)
plt.plot(x_minute, y_temp)

# 修改刻度
x_label = ["11点{}分".format(i) for i in x_minute]  # 显示标签
plt.xticks(range(0, 60, 5), x_label[::5], color='red', rotation=60)  # 特别注意标签的步长也要一直
plt.yticks(range(0, 40, 5))

# 显示网格
plt.grid(True, linestyle='--', alpha=0.5, color='red')

# 增加坐标轴描述信息
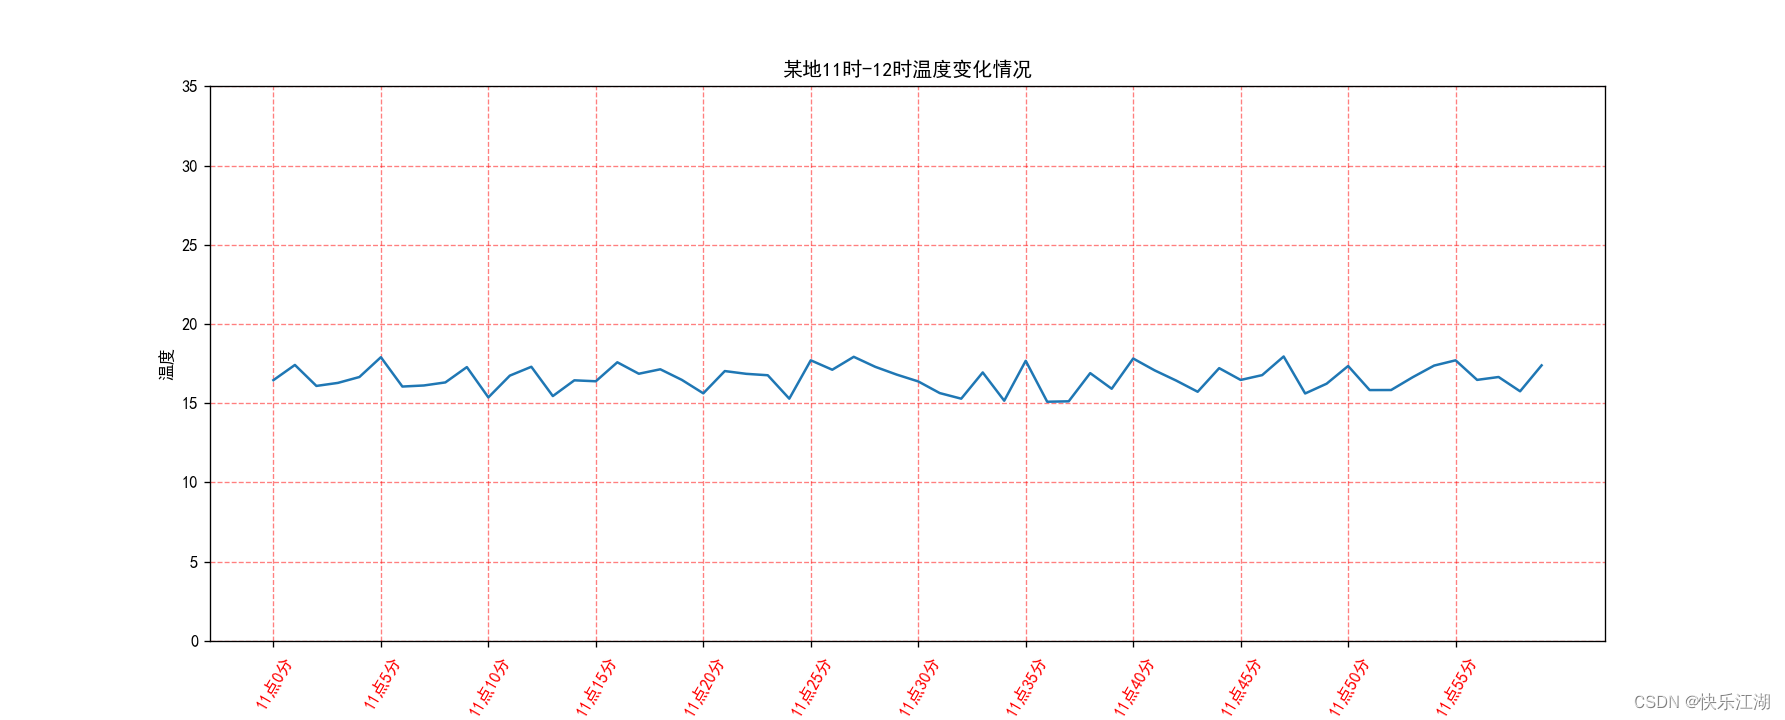
plt.xlabel("时间")
plt.ylabel("温度")
plt.title("某地11时-12时温度变化情况")


plt.show()
三:折线图完善2(图像层)
(1)plt.plot()细谈
plt.plot()这个函数我们打交道的次数会非常多,因为它涉及的是图像层面的修改,格式如下
plt.plot(x, y, format_string, **kwargs)
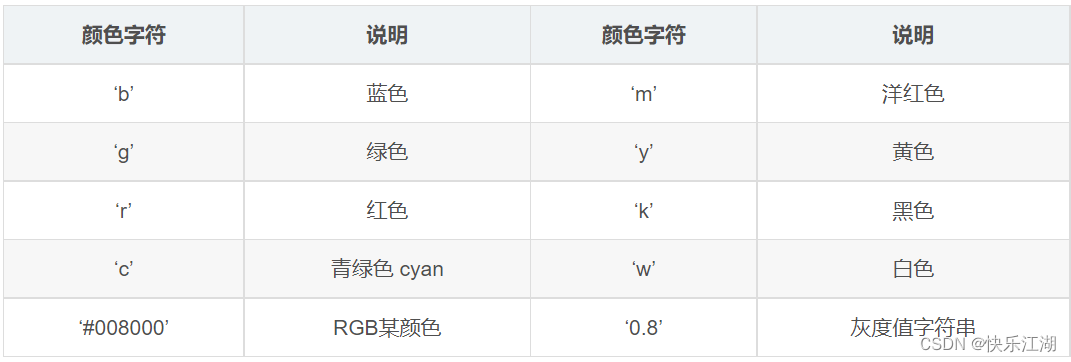
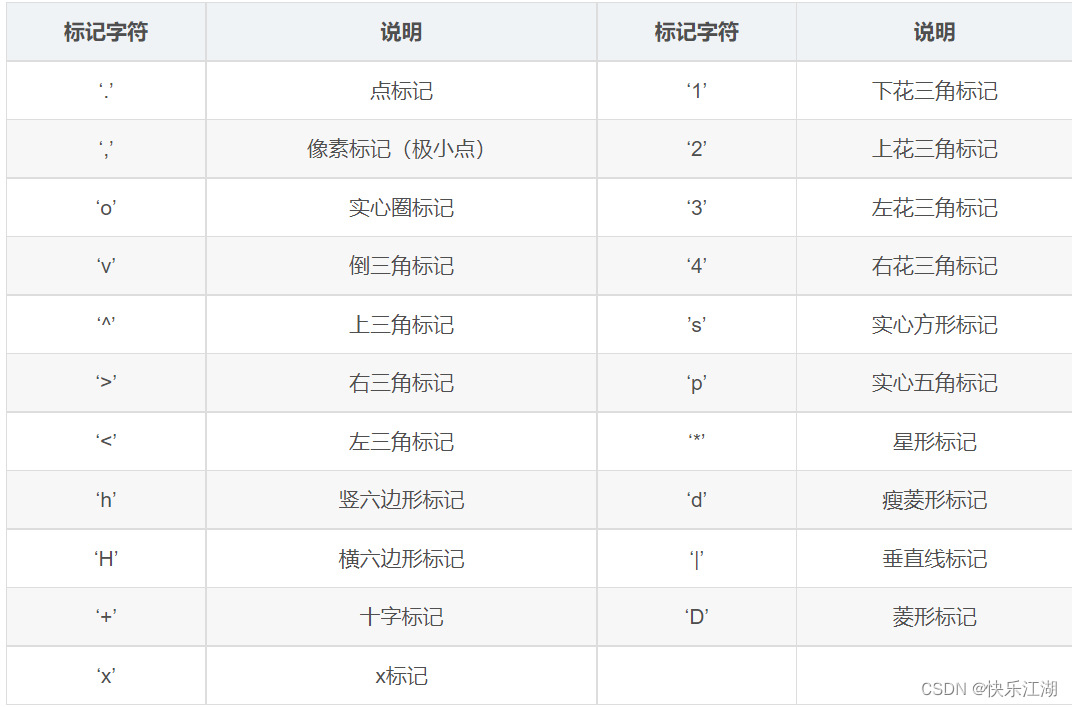
x:x轴数据,列表或数组,可选y:y轴数据,列表或数组format_string(关键字参数):控制曲线的格式字符串,可选,由颜色字符、风格字符和标记字符组成(注意可以一次性在一个字符串内输入)**kwargs:第二组或更多;(x, y, format_string)为一组,可以输入多组
关键字参数中常用关键字如下
color:控制颜色linestyle:控制线条风格marker:控制标记风格markerfacecolor:控制标记颜色markersize:控制标记尺寸
相应颜色字符、标记字符等符号如下

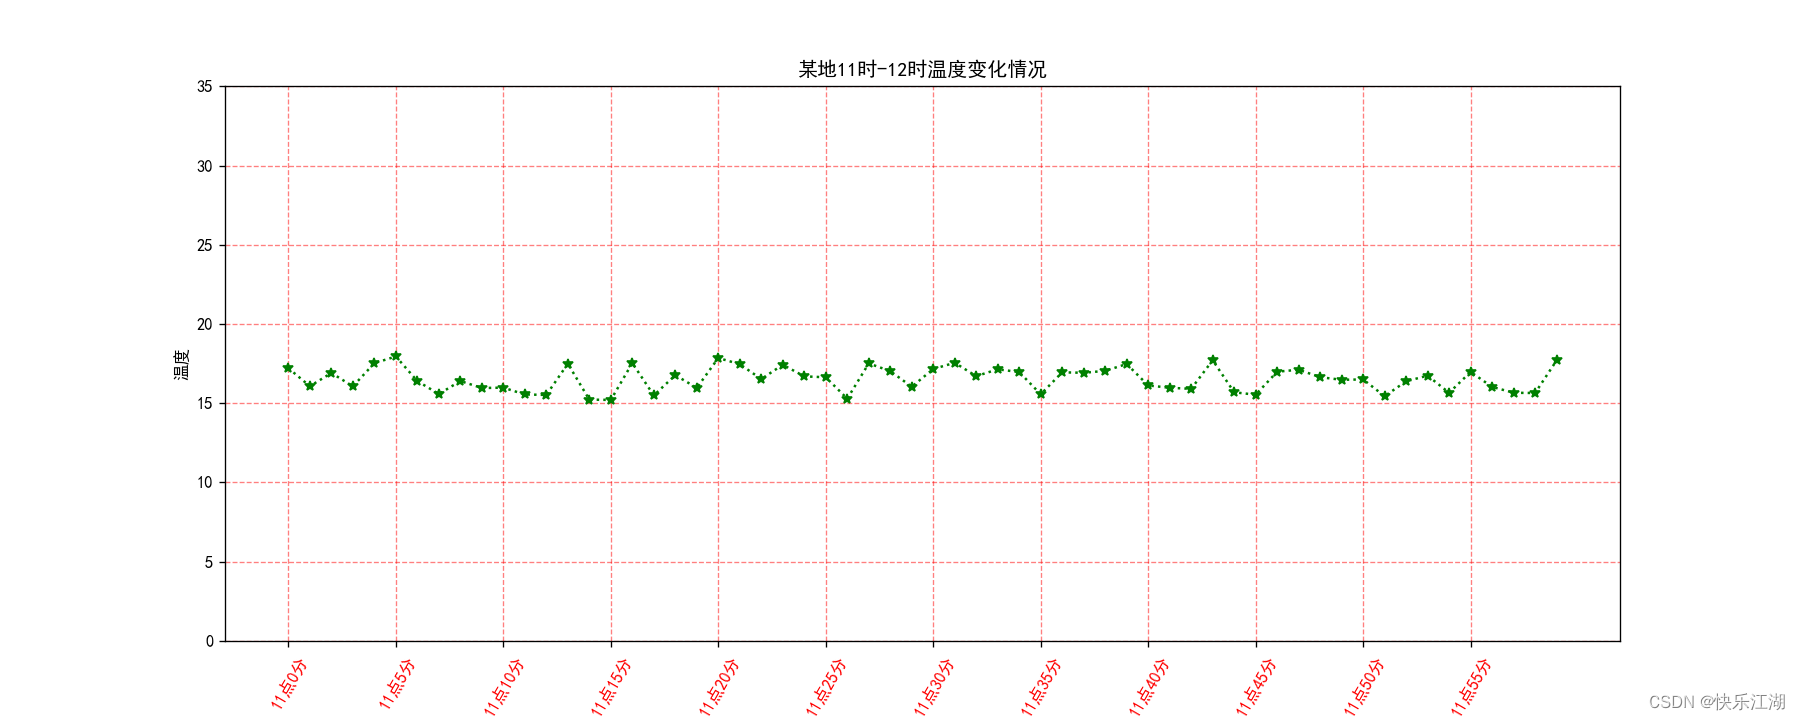
例如上图修改线条为绿色虚线星型标记
plt.plot(x_minute, y_temp, 'g:*')
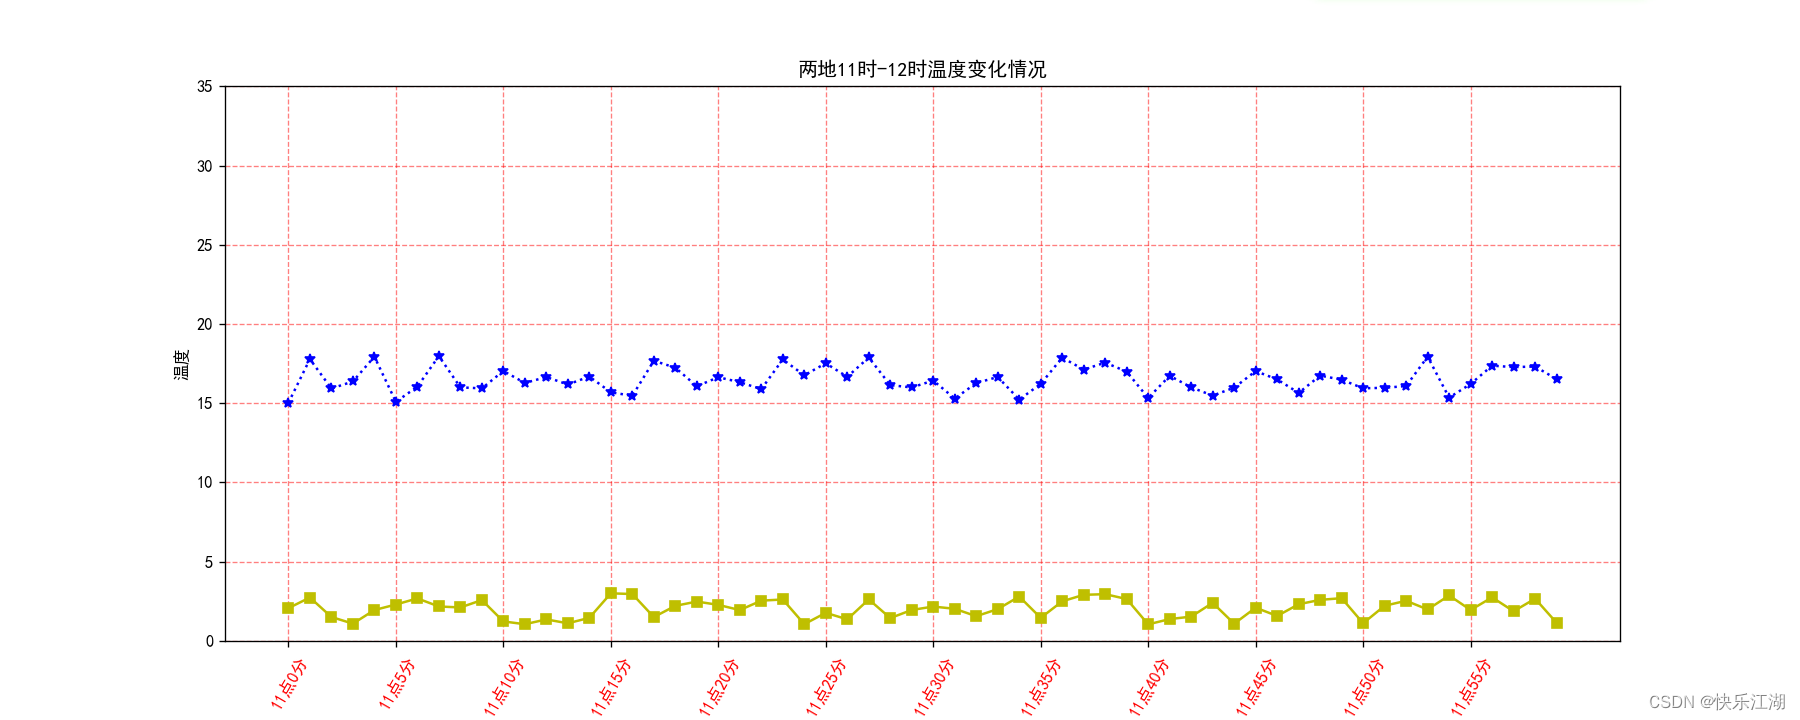
(2)在本图上再添加一组或多组数据
现在需要添加另外一个地方的相同时间内的温度变化情况,范围为1~3℃,数据如下
y_temp2 = [random.uniform(1, 3) for j in x_minute]
代码如下
import matplotlib.pyplot as plt  # 导入
import random
plt.rcParams['font.sans-serif'] = ['SimHei']   # 用来正常显示中文标签
plt.rcParams['axes.unicode_minus'] = False   # 用来正常显示负号

#  数据
x_minute = range(60)  # 时间变化情况
y_temp = [random.uniform(15, 18) for i in x_minute]  # 地点1
y_temp2 = [random.uniform(1, 3) for j in x_minute]   # 地点2

# 创建画布
plt.figure(figsize=(15, 6), dpi=80)

# 绘制图像
plt.plot(x_minute, y_temp, 'b:*', x_minute, y_temp2, 'y-s')  # 地点1和地点2


# 修改刻度
x_label = ["11点{}分".format(i) for i in x_minute]  # 显示标签
plt.xticks(range(0, 60, 5), x_label[::5], color='red', rotation=60)  # 特别注意标签的步长也要一致
plt.yticks(range(0, 40, 5))

# 显示网格
plt.grid(True, linestyle='--', alpha=0.5, color='red')

# 增加坐标轴描述信息
plt.xlabel("时间")
plt.ylabel("温度")
plt.title("某地11时-12时温度变化情况")


plt.show()
其中的绘图还可以这样写
plt.plot(x_minute, y_temp, 'b:*')
plt.plot(x_minute, y_temp2, 'y-s')
(3)添加图例
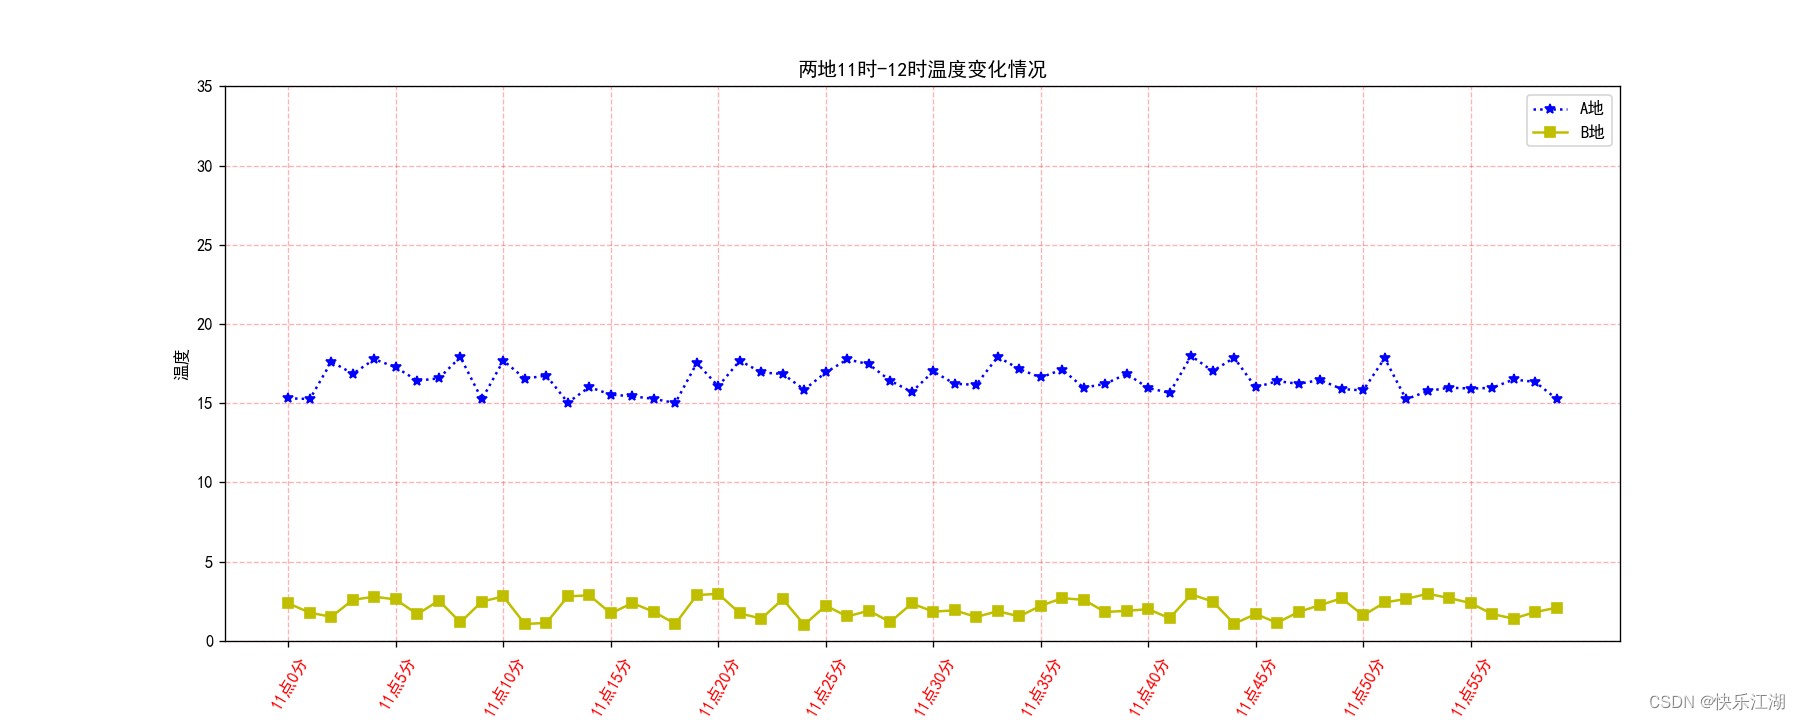
现在这张图已经有两组数据了,所以需要用图例进行区分,设置图例步骤如下
- 首先在
plt.plot()中设定图例标签(也就是图例名字) - 调用
plt.legend()显示图例
import matplotlib.pyplot as plt  # 导入
import random
plt.rcParams['font.sans-serif'] = ['SimHei']   # 用来正常显示中文标签
plt.rcParams['axes.unicode_minus'] = False   # 用来正常显示负号

#  数据
x_minute = range(60)  # 时间变化情况
y_temp = [random.uniform(15, 18) for i in x_minute]  # 地点1
y_temp2 = [random.uniform(1, 3) for j in x_minute]   # 地点2

# 创建画布
plt.figure(figsize=(15, 6), dpi=80)

# 绘制图像
plt.plot(x_minute, y_temp, 'b:*', label='A地')  # 地点1
plt.plot(x_minute, y_temp2, 'y-s', label='B地')  # 地点1

# 修改刻度
x_label = ["11点{}分".format(i) for i in x_minute]  # 显示标签
plt.xticks(range(0, 60, 5), x_label[::5], color='red', rotation=60)  # 特别注意标签的步长也要一致
plt.yticks(range(0, 40, 5))

# 显示网格
plt.grid(True, linestyle='--', alpha=0.3, color='red')

# 显示图例
plt.legend()

# 增加坐标轴描述信息
plt.xlabel("时间")
plt.ylabel("温度")
plt.title("两地11时-12时温度变化情况")


plt.show()
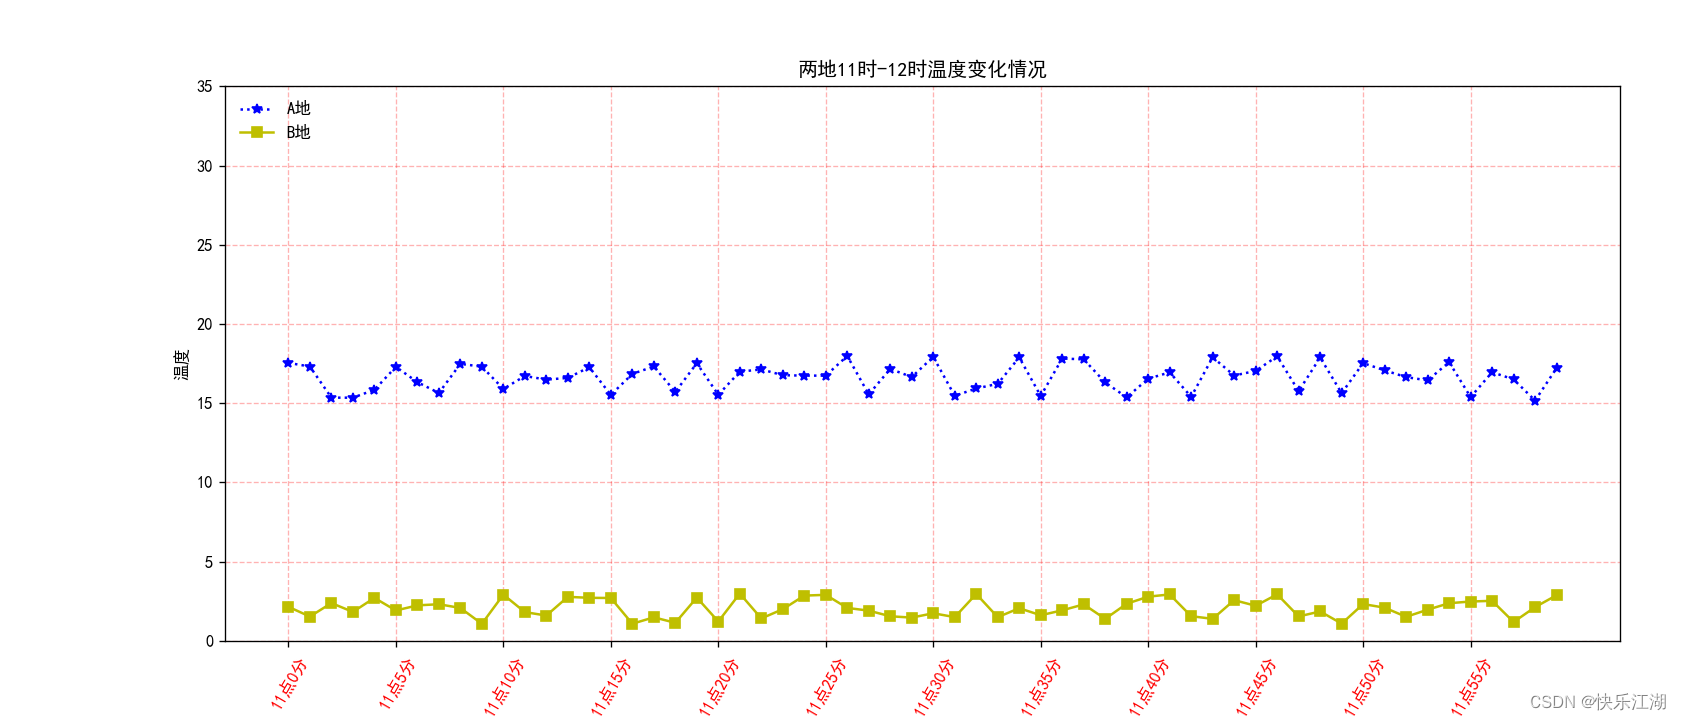
plt.legend()中有很多参数可以设定,以下参数用的比较多(具体用法可以自己查)
loc:设置图例的位置frameon:是否显示图例边框edgecolor:图例边框颜色facecolor:图例背景颜色
plt.legend(loc='upper left', frameon=False)
四:多个绘图区域(面向对象绘图方法)
前面画图时针对的都是一张图,即便有多组数据,也还是在一张图上绘制。如果现在我们要求上面的两组数据分别绘制在不同的图上,那应该怎么做呢?其实这反映的就是面向对象思想的绘图方法,因为只要一张图绘制好了,其他图只需要参照此模板即可。这里推荐使用 subplots()函数完成
subplots() 函数可以一次生成多张图,格式如下
subplots(nrows=1, ncols=1, *, sharex=False, sharey=False, squeeze=True, subplot_kw=None, gridspec_kw=None, **fig_kw)
nrows:默认为1;设置图表的行数ncols:默认为1;设置图表的列数
它有两种返回值
figure:图对象axes:用于设置坐标轴(set_xticks、set_yticks、set_xlabel、set_ylabel)
代码如下,与绘制单图有所区别,具体体现在方法名字不同,且需要用axes[0]或axes[1]指定应该设置哪个图的坐标轴
plt.plot要改为axes[0].plot和axes[1].plotplt.xticks要改为axes[0].set_xticks和axes[0].set_yticksplt.xlabel要改为axes[0].set_xlabel- 其余像网格、图例都要自己设定自己的
- 如果无法正确执行,可能是方法没有写对,可以查阅官方文档Matplotlib文档
import matplotlib.pyplot as plt  # 导入
import random
plt.rcParams['font.sans-serif'] = ['SimHei']   # 用来正常显示中文标签
plt.rcParams['axes.unicode_minus'] = False   # 用来正常显示负号


#  数据
x_minute = range(60)  # 时间变化情况
y_temp = [random.uniform(15, 18) for i in x_minute]  # 地点1
y_temp2 = [random.uniform(1, 3) for j in x_minute]  # 地点2

# 设置绘图区
figure, axes = plt.subplots(nrows=1, ncols=2, figsize=(15, 6), dpi=80)

# 绘制图像
axes[0].plot(x_minute, y_temp, 'b:*', label='A')  # 地点1
axes[1].plot(x_minute, y_temp2, 'y-s', label='B')  # 地点2

# 显示图例
axes[0].legend()
axes[1].legend()

# 修改刻度
x_label = ["11点{}分".format(i) for i in x_minute]  # 显示标签
axes[0].set_xticks(range(0, 60, 5), x_label[::5], rotation=60)  # 地点1
axes[0].set_yticks(range(0, 40, 5))
axes[1].set_xticks(range(0, 60, 5), x_label[::5], rotation=60)  # 地点2
axes[1].set_yticks(range(0, 40, 5))

# 显示网格
axes[0].grid(True, linestyle='--', alpha=0.3, color='red')
axes[1].grid(True, linestyle='--', alpha=0.3, color='red')

# 增加坐标轴描述信息
axes[0].set_xlabel("时间")
axes[0].set_ylabel("温度")
axes[0].set_title("A地11时-12时温度变化情况")

axes[1].set_xlabel("时间")
axes[1].set_ylabel("温度")
axes[1].set_title("B地11时-12时温度变化情况")

plt.show()

