import os
os.chdir("C:\\Users\\Administrator\\Desktop")
import pandas as pd
dt = pd.read_excel('data2.xlsx')
dt.head(6)
| Stkcd | Accper | B002000101 |
|---|
| 0 | 16 | 2014-12-31 | 5.262353e+07 |
|---|
| 1 | 16 | 2015-12-31 | -1.256819e+09 |
|---|
| 2 | 16 | 2016-12-31 | 9.567303e+07 |
|---|
| 3 | 16 | 2017-12-31 | 5.057025e+09 |
|---|
| 4 | 20 | 2014-12-31 | 7.687620e+06 |
|---|
| 5 | 20 | 2015-12-31 | -4.200846e+06 |
|---|
code=dt['Stkcd'].value_counts()
code=list(code[code==4].index)
info = pd.read_excel('info.xlsx')
S = pd.Series(info.iloc[:,1].values,index=info.iloc[:,0].values)
list1=[]
list2=[]
list3=[]
list4=[]
for t in range(len(code)):
d = dt.iloc[dt.iloc[:,0].values==code[t],2].values
r=(d[1:]-d[0:-1])/d[0:-1]
if len(r[r > 0.4])==3:
list1.append(S[code[t]])
list2.append(r[0])
list3.append(r[1])
list4.append(r[2])
D={'2015':list2,'2016':list3,'2017':list4}
D=pd.DataFrame(D,index=list1)
print(D)
           2015      2016      2017
欧比特    1.307383  0.462634  0.428948
长信科技   0.434675  0.460146  0.568439
太极实业   0.660745  8.864148  0.796785
信维通信   2.509017  1.401281  0.672495
洲明科技   0.866089  0.465667  0.707984
利亚德    1.050507  1.021921  0.808804
凯乐科技   1.517285  0.523497  3.058523
天通股份   4.394320  0.507627  0.421749
合众思壮   0.512233  0.592181  1.508319
和而泰    0.663487  0.596609  0.488410
领益智造  11.952004  4.083113  5.001538
import numpy as np
import matplotlib.pyplot as plt
data = pd.read_excel('trd.xlsx')
dt=data.loc[data['股票代码']==600000,['交易日期','收盘价','交易量']]
I1=dt['交易日期'].values>='2017-01-03'
I2=dt['交易日期'].values<='2017-01-20'
dta=dt.iloc[I1&I2,:]
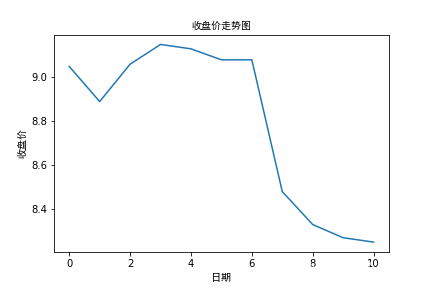
y1=dta['收盘价']
x1=range(len(y1))
I3=dt['交易日期'].values>='2017-01-03'
I4=dt['交易日期'].values<='2017-01-24'
dta=dt.iloc[I3&I4,:]
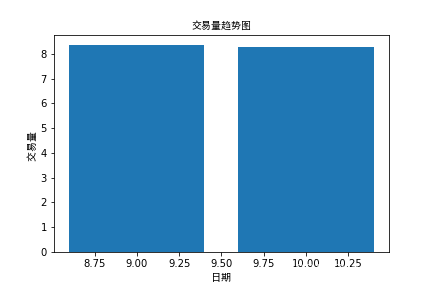
y2=dta['交易量']
x2= range(len(y2))
print(y2.head(6))
0    16237125
1    29658734
2    26437646
3    17195598
4    14908745
5     7996756
Name: 交易量, dtype: int64
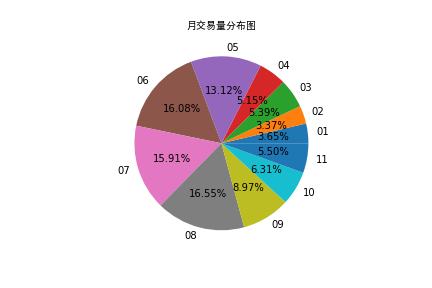
D = np.zeros((11))
list1=list()
for m in range(11):
    m = m + 1
    if m<10:
        m1='2017-0'+str(m)+'-01'
        m2='2017-0'+str(m)+'-31'
        mon='0'+str(m)
    else:
        m1='2017-'+str(m)+'-01'
        m2='2017-'+str(m)+'-31'
        mon=str(m)
    I1=dt['交易日期'].values >= m1
    I2=dt['交易日期'].values <= m2
    D[m-1]=dt.iloc[I1&I2,[2]].sum()[0]
    list1.append(mon)
plt.figure(1)
plt.plot(x1,y1)
plt.xlabel(u'日期',fontproperties='SimHei')
plt.ylabel(u'收盘价',fontproperties='SimHei')
plt.title(u'收盘价走势图',fontproperties='SimHei')
plt.savefig('1')
plt.figure(2)
plt.bar(x2,y2)
plt.xlabel(u'日期',fontproperties='SimHei')
plt.ylabel(u'交易量 ',fontproperties='SimHei')
plt.title(u'交易量趋势图',fontproperties='SimHei')
plt.savefig('2')
plt.figure(3)
plt.pie(D,labels=list1,autopct='%1.2f%%')
plt.title(u'月交易量分布图',fontproperties='SimHei')
plt.savefig('3')
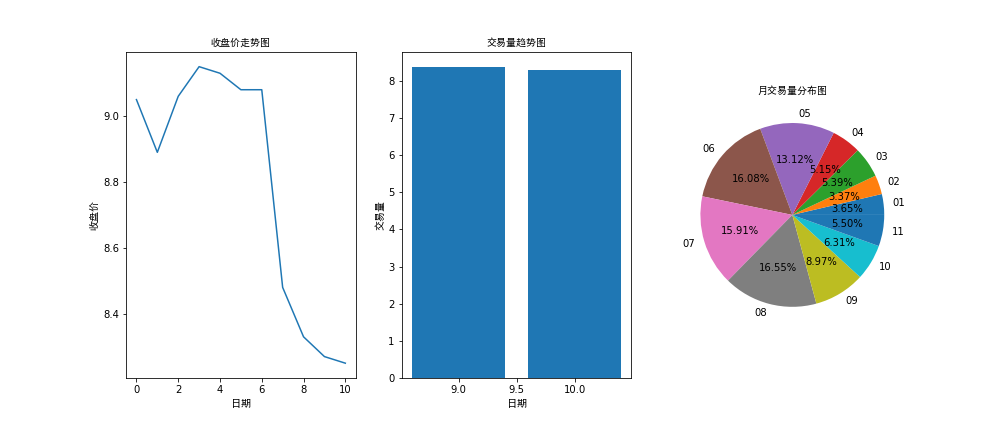
plt.figure(4)
plt.figure(figsize=(14,6))
plt.subplot(1,3,1)
plt.plot(x1,y1)
plt.xlabel(u'日期',fontproperties='SimHei')
plt.ylabel(u'收盘价',fontproperties='SimHei')
plt.title(u'收盘价走势图',fontproperties='SimHei')
plt.subplot(1,3,2)
plt.bar(x2,y2)
plt.xlabel(u'日期',fontproperties='SimHei')
plt.ylabel(u'交易量',fontproperties='SimHei')
plt.title(u'交易量趋势图',fontproperties='SimHei')
plt.subplot(1,3,3)
plt.pie(D,labels=list1,autopct='%1.2f%%')
plt.title(u'月交易量分布图',fontproperties='SimHei')
plt.savefig('4')
<Figure size 432x288 with 0 Axes>
trd= pd.read_excel('trd.xlsx')
c=trd['Stkcd'].value_counts()
print(c)
2001    63
2002    63
2019    63
2018    63
2017    63
2016    63
2015    63
2014    63
2013    63
2011    63
2010    63
2009    63
2008    63
2007    63
2006    63
2005    63
2004    63
2003    63
2020    63
2012    11
Name: Stkcd, dtype: int64
code = list(c.index)
print(code)
[2001, 2002, 2019, 2018, 2017, 2016, 2015, 2014, 2013, 2011, 2010, 2009, 2008, 2007, 2006, 2005, 2004, 2003, 2020, 2012]
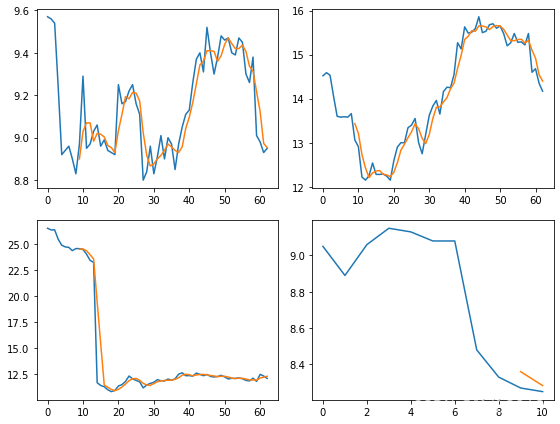
q=0
for i in range(20):
p=trd.loc[trd['Stkcd'].values==code[i],'Clsprc'].values
avg_p=pd.rolling_mean(p,10)
x1=np.arange(0,len(p))
y1=p
y2=avg_p[9:]
x2=np.arange(9,len(p))
if i%4==0:
q=q+1
plt.figure(q)
plt.figure(figsize=(8,6))
plt.subplot(2,2,i%4+1)
plt.tight_layout()
plt.plot(x1,y1)
plt.plot(x2,y2)
plt.savefig(str(q))
---------------------------------------------------------------------------

AttributeError                            Traceback (most recent call last)

<ipython-input-12-dfcf7b02d998> in <module>
      7     #并构造绘图的x,y值
      8     p=trd.loc[trd['Stkcd'].values==code[i],'Clsprc'].values
----> 9     avg_p=pd.rolling_mean(p,10)
     10     x1=np.arange(0,len(p))
     11     y1=p


C:\ProgramData\Anaconda3\lib\site-packages\pandas\__init__.py in __getattr__(name)
    242         return _SparseArray
    243
--> 244     raise AttributeError(f"module 'pandas' has no attribute '{name}'")
    245
    246


AttributeError: module 'pandas' has no attribute 'rolling_mean'
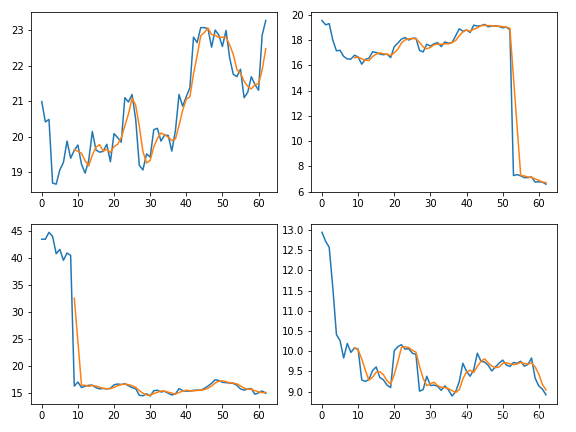
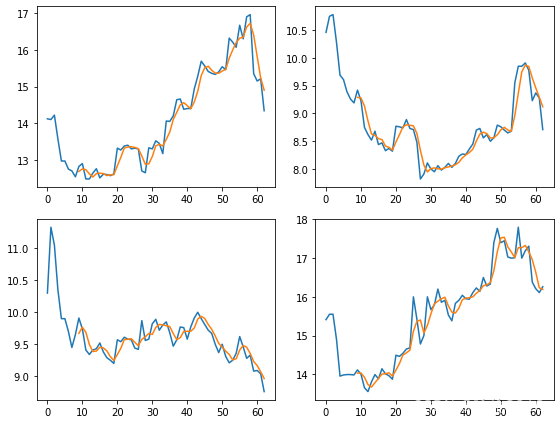
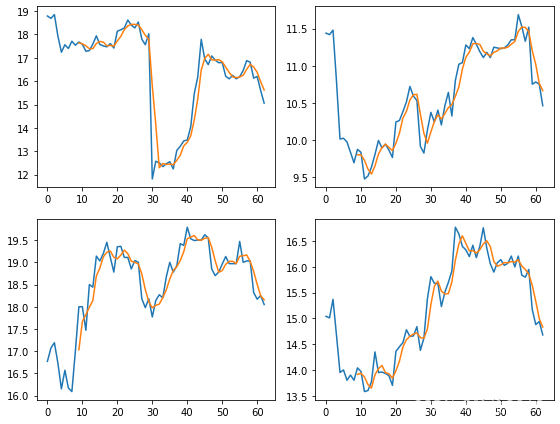
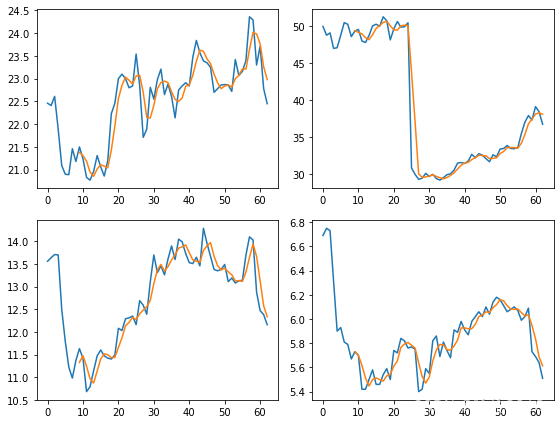
q=0
for i in range(20):
p=trd.loc[trd['Stkcd'].values==code[i],'Clsprc'].values
p = pd.Series(p)
avg_p = p.rolling(3).mean()
x1=np.arange(0,len(p))
y1=p
y2=avg_p[9:]
x2=np.arange(9,len(p))
if i%4==0:
q=q+1
plt.figure(q)
plt.figure(figsize=(8,6))
plt.subplot(2,2,i%4+1)
plt.tight_layout()
plt.plot(x1,y1)
plt.plot(x2,y2)
plt.savefig(str(q))
<Figure size 432x288 with 0 Axes>
|


