行星数据
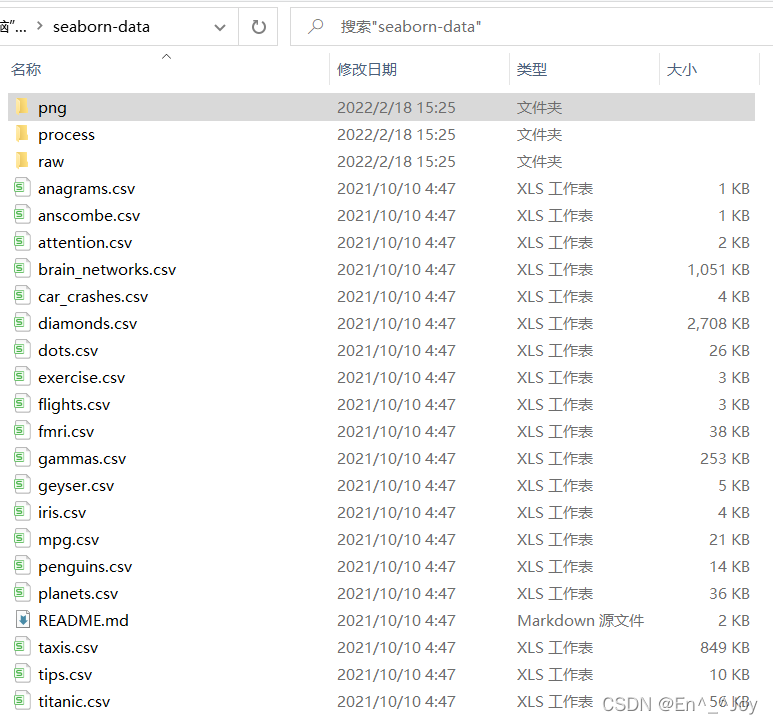
通过seaborn库得到行星数据,报错将https://github.com/mwaskom/seaborn-data中的文件保存到文件seaborn-data中


import seaborn as sns

planets = sns.load_dataset('planets')
print(planets.shape)  # (1035, 6)
print(planets.head())
'''
            method  number  orbital_period   mass  distance  year
0  Radial Velocity       1         269.300   7.10     77.40  2006
1  Radial Velocity       1         874.774   2.21     56.95  2008
2  Radial Velocity       1         763.000   2.60     19.84  2011
3  Radial Velocity       1         326.030  19.40    110.62  2007
4  Radial Velocity       1         516.220  10.50    119.47  2009
'''
pandas简单累计功能
| 函数 | 说明 |
|---|---|
| count() | 计数项 |
| first()、last() | 第一项与最后一项 |
| mean()、median() | 均值与中位数 |
| min()、max() | 最小值与最大值 |
| std()、var() | 标准差与方差 |
| mad() | 均值绝对偏差 |
| prod() | 所有项乘积 |
| sum() | 所有项求和 |
| describe() | 每列的若干统计值 |
Numpy数组累计指标和pandas累计函数
import pandas as pd

ser = pd.Series([2,4,6,8])
print(ser)
'''
0    2
1    4
2    6
3    8
dtype: int64
'''
print(ser.sum())  # 20
print(ser.mean()) # 5.0
DataFrame累计函数默认对每列进行统计
import pandas as pd

df = pd.DataFrame({'A':[1,2,3],'B':[4,5,6]})
print(df)
'''
   A  B
0  1  4
1  2  5
2  3  6
'''
print(df.mean())
'''
A    2.0
B    5.0
dtype: float64
'''
# 设置axis参数可以对每一行进行统计
print(df.mean(axis='columns'))
'''
0    2.5
1    3.5
2    4.5
dtype: float64
'''
# 计算每列的若干统计值
print(df.describe())
'''
         A    B
count  3.0  3.0
mean   2.0  5.0
std    1.0  1.0
min    1.0  4.0
25%    1.5  4.5
50%    2.0  5.0
75%    2.5  5.5
max    3.0  6.0
'''
GroupBy:分组、累计与组合
groupby操作可视化过程

groupby一行代码可以计算每组的和、均值、计数、最小值等
用DataFrame的groupby()方法进需要的列名传入,其次是统计方式,sum为众多可用方法其中一个,还可以用Pandas和Numpy的任意一种累计方式,也可以用任意有效的DataFrame对象
df = pd.DataFrame({'key':['A','B','C','A','B','C'],'data':range(6)},columns=['key','data'])
print(df)
'''
  key  data
0   A     0
1   B     1
2   C     2
3   A     3
4   B     4
5   C     5
'''

print(df.groupby('key')) # 返回DataFrameGroupBy对象
# <pandas.core.groupby.generic.DataFrameGroupBy object at 0x000001E090215160>

print(df.groupby('key').sum())
'''
     data
key
A       3
B       5
C       7
'''
GroupBy对象
GroupBy最常用的操作可能就是aggregate/filter/transform/apply(累计、过滤、转换、应用)
按列取值
import pandas as pd
import seaborn as sns

planets = sns.load_dataset('planets')
print(planets)
'''
               method  number  orbital_period   mass  distance  year
0     Radial Velocity       1      269.300000   7.10     77.40  2006
1     Radial Velocity       1      874.774000   2.21     56.95  2008
2     Radial Velocity       1      763.000000   2.60     19.84  2011
3     Radial Velocity       1      326.030000  19.40    110.62  2007
4     Radial Velocity       1      516.220000  10.50    119.47  2009
...               ...     ...             ...    ...       ...   ...
1030          Transit       1        3.941507    NaN    172.00  2006
1031          Transit       1        2.615864    NaN    148.00  2007
1032          Transit       1        3.191524    NaN    174.00  2007
1033          Transit       1        4.125083    NaN    293.00  2008
1034          Transit       1        4.187757    NaN    260.00  2008

[1035 rows x 6 columns]
'''
print(planets.groupby('method'))
'''
<pandas.core.groupby.generic.DataFrameGroupBy object at 0x0000013A43D660B8>
'''
print(planets.groupby('method').median())
'''
                               number  orbital_period   mass  distance    year
method
Astrometry                        1.0      631.180000    NaN    17.875  2011.5
Eclipse Timing Variations         2.0     4343.500000  5.125   315.360  2010.0
Imaging                           1.0    27500.000000    NaN    40.395  2009.0
Microlensing                      1.0     3300.000000    NaN  3840.000  2010.0
Orbital Brightness Modulation     2.0        0.342887    NaN  1180.000  2011.0
Pulsar Timing                     3.0       66.541900    NaN  1200.000  1994.0
Pulsation Timing Variations       1.0     1170.000000    NaN       NaN  2007.0
Radial Velocity                   1.0      360.200000  1.260    40.445  2009.0
Transit                           1.0        5.714932  1.470   341.000  2012.0
Transit Timing Variations         2.0       57.011000    NaN   855.000  2012.5
'''
print(planets.groupby('method')['orbital_period'])
'''
<pandas.core.groupby.generic.SeriesGroupBy object at 0x0000013A33F8F7B8>
'''
print(planets.groupby('method')['orbital_period'].median())
'''
method
Astrometry                         631.180000
Eclipse Timing Variations         4343.500000
Imaging                          27500.000000
Microlensing                      3300.000000
Orbital Brightness Modulation        0.342887
Pulsar Timing                       66.541900
Pulsation Timing Variations       1170.000000
Radial Velocity                    360.200000
Transit                              5.714932
Transit Timing Variations           57.011000
Name: orbital_period, dtype: float64
'''
按组迭代
planets = sns.load_dataset('planets')
for (method, group) in planets.groupby('method'):
    print("{0:30s} shape={1}".format(method, group.shape))
'''
Astrometry                     shape=(2, 6)
Eclipse Timing Variations      shape=(9, 6)
Imaging                        shape=(38, 6)
Microlensing                   shape=(23, 6)
Orbital Brightness Modulation  shape=(3, 6)
Pulsar Timing                  shape=(5, 6)
Pulsation Timing Variations    shape=(1, 6)
Radial Velocity                shape=(553, 6)
Transit                        shape=(397, 6)
Transit Timing Variations      shape=(4, 6)
'''
累计、过滤、转换、应用
rng = np.random.RandomState(0)
df = pd.DataFrame({'key':['A','B','C','A','B','C'],
                    'data1':range(6),
                    'data2':rng.randint(0,10,6)},
                   columns=['key','data1','data2'])
print(df)
'''
  key  data1  data2
0   A      0      5
1   B      1      0
2   C      2      3
3   A      3      3
4   B      4      7
5   C      5      9
'''
累计
print(df.groupby('key').aggregate(['min',np.median,max]))
'''
    data1            data2
      min median max   min median max
key
A       0    1.5   3     3    4.0   5
B       1    2.5   4     0    3.5   7
C       2    3.5   5     3    6.0   9
'''
print(df.groupby('key').aggregate({'data1':'min',
                                   'data2':'max'}))
'''
     data1  data2
key
A        0      5
B        1      7
C        2      9
'''
过滤
def filter_func(x):
    return x['data2'].std()>4

print(df.groupby('key').std())
'''
       data1     data2
key
A    2.12132  1.414214
B    2.12132  4.949747
C    2.12132  4.242641
'''
print(df.groupby('key').filter(filter_func))
'''A组的data2列的标准差不大于4,所以被丢弃
  key  data1  data2
1   B      1      0
2   C      2      3
4   B      4      7
5   C      5      9
'''
转换
# 每一组的样本数据减去各组的均值
print(df.groupby('key').transform(lambda x:x-x.mean()))
'''
   data1  data2
0   -1.5    1.0
1   -1.5   -3.5
2   -1.5   -3.0
3    1.5   -1.0
4    1.5    3.5
5    1.5    3.0
'''
apply()方法
# 该方法可以在每个组上应用任意方法,下面例子将第一列数据以第二列的和为基础进行标准化
def norm_by_data2(x):
    # X是一个分组数据的DataFrame
    x['data1'] /= x['data2'].sum()
    return x

print(df.groupby('key').apply(norm_by_data2))
'''
  key     data1  data2
0   A  0.000000      5
1   B  0.142857      0
2   C  0.166667      3
3   A  0.375000      3
4   B  0.571429      7
5   C  0.416667      9
'''
设置分割的键
rng = np.random.RandomState(0)
df = pd.DataFrame({'key':['A','B','C','A','B','C'],
                    'data1':range(6),
                    'data2':rng.randint(0,10,6)},
                   columns=['key','data1','data2'])
print(df)
'''
  key  data1  data2
0   A      0      5
1   B      1      0
2   C      2      3
3   A      3      3
4   B      4      7
5   C      5      9
'''
将列表、数组、Series或索引作为分组键
print(df.groupby('key').sum())
'''
     data1  data2
key
A        3      8
B        5      7
C        7     12
'''
L=[0,1,0,1,2,0]# 相当于序列号,替换上面的A、B、C、A、B、C
print(df.groupby(L).sum())
'''相当于将ABCABC转换为010120,data1后面的7为0+2+5,4为1+3,4为4
   data1  data2
0      7     17
1      4      3
2      4      7
'''
用字典或Series将索引映射到分组名称
df2 = df.set_index('key')
mapping = {'A':'vowel','B':'consonant','C':'consonant'}
print(df2)
'''
     data1  data2
key
A        0      5
B        1      0
C        2      3
A        3      3
B        4      7
C        5      9
'''
print(df2.groupby(mapping).sum())
'''
           data1  data2
consonant     12     19
vowel          3      8
'''
任意python函数
print(df2.groupby(str.lower).mean())
'''
   data1  data2
a    1.5    4.0
b    2.5    3.5
c    3.5    6.0
'''
多个有效键构成的列表
df2 = df.set_index('key')
mapping = {'A':'vowel','B':'consonant','C':'consonant'}
print(df2.groupby([str.lower,mapping]).mean())
'''
             data1  data2
a vowel        1.5    4.0
b consonant    2.5    3.5
c consonant    3.5    6.0
'''
