大家好,信用卡欺诈在金融风控领域是非常常见的,在信用卡欺诈数据集上,使用IsolationForest默认的参数,Top1000准确率为19%左右,优化参数后提高到27%左右,提升幅度非常大,异常检测模型的评估,由于黑白样本极度不平衡,使用准确率评估就不合适了。
本文通过信用卡欺诈交易的数据进行检测,提高我们对于这个模型参数优化和评估方式,我相信你会有一个更清晰的认识。
孤立森林最重要的三个参数:
n_estimators:iTree的个数,指定该森林中生成的随机树数量,默认为100个
max_samples:用来训练随机数的样本数量,即子采样的大小,默认每次采样256个,整数为个数,小数为占全集的比例
max_features : 构建每个子树的特征数,整数位个数,小数为占全特征的比例,指定从总样本X中抽取来训练每棵树iTree的属性的数量,默认只使用1个特征
本文涉及的数据也只是30w不到,如果数据继续上升到百万,千万,上亿等规模,可能学习的情况完全不同,等后面研究了跟大家分享。
一、数据介绍
数据来自于kaggle上的一个信用卡欺诈检测比赛,数据质量高,正负样本比例非常悬殊,很典型的异常检测数据集,在这个数据集上来测试一下各种异常检测手段的效果。当然,可能换个数据集结果就会有很大不同,结果仅供参考。
注意点
提供完整代码、资料、技术交流,目前开通了技术交流群,群友已超过2000人,添加时最好的备注方式为:来源+兴趣方向,方便找到志同道合的朋友
方式、添加微信号:dkl88191,备注:来自CSDN
方式、微信搜索公众号:Python学习与数据挖掘,后台回复:加群
1、数据集介绍
信用卡欺诈是指故意使用伪造、作废的信用卡,冒用他人的信用卡骗取财物,或用本人信用卡进行恶意透支的行为,信用卡欺诈形式分为3种:失卡冒用、假冒申请、伪造信用卡。欺诈案件中,有60%以上是伪造信用卡诈骗,其特点是团伙性质,从盗取卡资料、制造假卡、贩卖假卡,到用假卡作案,牟取暴利。而信用卡欺诈检测是银行减少损失的重要手段。
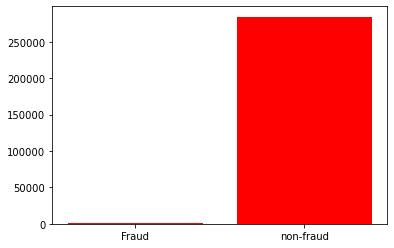
该数据集包含欧洲持卡人于 2013 年 9 月通过信用卡进行的交易信息。此数据集显示的是两天内发生的交易,在 284807 笔交易中,存在 492 起欺诈,数据集高度不平衡,正类(欺诈)仅占所有交易的 0.172%。原数据集已做脱敏处理和PCA处理,匿名变量V1, V2, …V28 是 PCA 获得的主成分,唯一未经过 PCA 处理的变量是 Time 和 Amount。Time 是每笔交易与数据集中第一笔交易之间的间隔,单位为秒;Amount 是交易金额。Class 是分类变量,在发生欺诈时为1,否则为0。项目要求根据现有数据集建立分类模型,对信用卡欺诈行为进行检测。
**注:**PCA - “Principal Component Analysis” - 主成分分析,用于提取数据集的"主成分"特征,即对数据集进行降维处理。
2、数据来源
数据集 Credit Card Fraud Detection 由比利时布鲁塞尔自由大学(ULB) - Worldline and the Machine Learning Group 提供。可从Kaggle上下载:https://www.kaggle.com/mlg-ulb/creditcardfraud
二、孤立森林参数
我们使用sklearn中的孤立森林,进行参数调节讲解,一般任务默认参数即可,算法API地址:
https://scikit-learn.org/stable/modules/generated/sklearn.ensemble.IsolationForest.html#sklearn.ensemble.IsolationForest
1、基本用法
sklearn.ensemble.IsolationForest(
              *,
              n_estimators=100,
              max_samples='auto',
              contamination='auto',
              max_features=1.0,
              bootstrap=False,
              n_jobs=None,
              random_state=None,
              verbose=0,
              warm_start=False
)
2、参数详解
n_estimators : int, optional (default=100)
iTree的个数,指定该森林中生成的随机树数量,默认为100个
max_samples : int or float, optional (default=”auto”)
如果设置的是一个int常数,那么就会从总样本X拉取max_samples个样本来生成一棵树iTree
如果设置的是一个float浮点数,那么就会从总样本X拉取max_samples * X.shape[0]个样本,X.shape[0]表示总样本个数
如果设置的是"auto",则max_samples=min(256, n_samples),n_samples即总样本的数量,如果max_samples值比提供的总样本数量还大的话,所有的样本都会用来构造数,意思就是没有采样了,构造的n_estimators棵iTree使用的样本都是一样的,即所有的样本
contamination : float in (0., 0.5), optional (default=0.1)
取值范围为(0., 0.5),表示异常数据占给定的数据集的比例,数据集中污染的数量,其实就是训练数据中异常数据的数量,比如数据集异常数据的比例。定义该参数值的作用是在决策函数中定义阈值。如果设置为’auto’,则决策函数的阈值就和论文中定义的一样
max_features : int or float, optional (default=1.0)
构建每个子树的特征数,整数位个数,小数为占全特征的比例,指定从总样本X中抽取来训练每棵树iTree的属性的数量,默认只使用一个属性
如果设置为int整数,则抽取max_features个属性
如果是float浮点数,则抽取max_features * X.shape[1]个属性
bootstrap : boolean, optional (default=False)
采样是有放回还是无放回,如果为True,则各个树可放回地对训练数据进行采样。如果为False,则执行不放回的采样。
**n_jobs 😗*int or None, optional (default=None)
在运行fit()和predict()函数时并行运行的作业数量。除了在joblib.parallel_backend上下文的情况下,None表示为1。设置为-1则表示使用所有可用的处理器
random_state : int, RandomState instance or None, optional (default=None)
每次训练的随机性
如果设置为int常数,则该random_state参数值是用于随机数生成器的种子
如果设置为RandomState实例,则该random_state就是一个随机数生成器
如果设置为None,该随机数生成器就是使用在np.random中的RandomState实例
verbose : int, optional (default=0)
训练中打印日志的详细程度,数值越大越详细
warm_start : bool, optional (default=False)
当设置为True时,重用上一次调用的结果去fit,添加更多的树到上一次的森林1集合中;否则就fit一整个新的森林
3、属 性
base_estimator_:构建子分类器的模板
estimators_:子分类器的列表,存储了所有的树
estimators_:features_list of ndarray The subset of drawn features for each base estimator.
estimators_features_:每个树所选用的特征
max_samples_:构建树时抽取的样本数
n_features_:构建树时使用的特征数量
n_features_in_:_同上,也是特征数量,替代_n_features_
feature_names_in_:所使用的特征名称
4、方 法
fit(X[, y, sample_weight]):训练模型
decision_function(X):返回平均异常分数
predict(X):预测模型返回1或者-1
fit_predict(X[, y]):训练-预测模型一起完成
get_params([deep]):获取分类器的参数
score_samples(X):返回原来的论文里面的分数形式
set_params(**params):设置分类器的参数
三、算法应用测试
1、数据读取
# 工作空间设置
import os
import pandas as pd
import numpy as np
import matplotlib.pyplot as plt
from sklearn.ensemble import IsolationForest

os.chdir('/Users/wuzhengxiang/Documents/DataSets/CreditCardFraudDetection')
os.getcwd()


# 数据读取
data = pd.read_csv('creditcard.csv')

# 查看 0 - 1 个数
print(data.Class.value_counts())
0    284315
1       492
Name: Class, dtype: int64

num_nonfraud = np.sum(data['Class'] == 0)
num_fraud = np.sum(data['Class'] == 1)
plt.bar(['Fraud', 'non-fraud'], [num_fraud, num_nonfraud], color='red')
plt.show()


#简单的特征工程
data['Hour'] = data["Time"].apply(lambda x : divmod(x, 3600)[0])
X = data.drop(['Time','Class'],axis=1)
Y = data.Class
2、使用默认参数
# 模型训练
iforest = IsolationForest()
#fit_predict 函数 训练和预测一起 可以得到模型是否异常的判断,-1为异常,1为正常
data['label'] = iforest.fit_predict(X)
# 预测 decision_function 可以得出 异常评分
data['scores'] = iforest.decision_function(X)
# TopN准确率评估
n = 1000
df =  data.sort_values(by='scores',ascending=True)
df = df.head(n)
rate = df[df['Class']==1].shape[0]/n
print('Top{}的准确率为:{}'.format(n,rate))
Top1000的准确率为:0.187
我们可以看到,在默认情况下,准确率为0.187,我们看看看默认参数都是啥
iforest.get_params()
{'bootstrap': False,
 'contamination': 'auto',
 'max_features': 1.0,
 'max_samples': 'auto',
 'n_estimators': 100,
 'n_jobs': None,
 'random_state': None,
 'verbose': 0,
 'warm_start': False}
接下来我们就要进行参数的评估与调整,看看模型的极限有多少
3、n_estimators对准确率的影响
n_estimators是指我们需要构建多少颗树,默认值是100,我们从10-500开始测试,看看什么区间的准确率会提高。
n_est = list(range(10,500,10))
rates = []
for i in n_est:
    # 模型训练
    iforest = IsolationForest(n_estimators=i,
                              max_samples=256,
                              contamination=0.02,
                              max_features=5,
                              random_state=1
                              )
    #fit_predict 函数 训练和预测一起 可以得到模型是否异常的判断,-1为异常,1为正常
    data['label'] = iforest.fit_predict(X)
    # 预测 decision_function 可以得出 异常评分
    data['scores'] = iforest.decision_function(X)
    # TopN准确率评估
    n = 1000
    df =  data.sort_values(by='scores',ascending=True)
    df = df.head(n)
    rate = df[df['Class']==1].shape[0]/n
    print('Top{}的准确率为:{}'.format(n,rate))
    rates.append(rate)
print(n_est)
[10, 20, 30, 40, 50, 60, 70, 80, 90, 100, 110, 120, 130, 140, 150, 160, 170, 180, 190, 200, 210, 220, 230, 240, 250, 260, 270, 280, 290, 300, 310, 320, 330, 340, 350, 360, 370, 380, 390, 400, 410, 420, 430, 440, 450, 460, 470, 480, 490]
print(rates)
[0.114, 0.179, 0.18, 0.184, 0.178, 0.189, 0.194, 0.197, 0.185, 0.192, 0.189, 0.19, 0.193, 0.208, 0.207, 0.192, 0.197, 0.195, 0.197, 0.196, 0.202, 0.207, 0.207, 0.197, 0.195, 0.196, 0.192, 0.195, 0.191, 0.191, 0.191, 0.188, 0.183, 0.182, 0.183, 0.184, 0.185, 0.184, 0.184, 0.184, 0.183, 0.184, 0.183, 0.184, 0.183, 0.186, 0.185, 0.184, 0.185]
import matplotlib.pyplot as plt
plt.plot(n_est,rates, linestyle='--', marker='.',color='c',markerfacecolor='red')
plt.show()
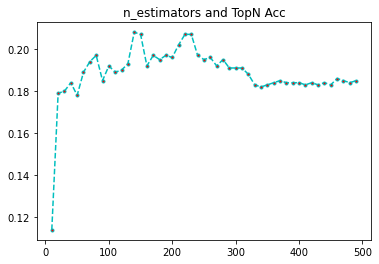
我们可以看到,树的棵树,超过200,准确率就开始下降,到300左右,维持在一个比较低的水平了,不下降不上升,因此,树的棵树,并不是越多越好
4、max_features对准确率的影响
max_features是指每次构建树时候,抽取的特征个数,我们从1开始,本数据集有30个特征,那我们就做30次评估。
features = list(range(1,X.shape[1]+1))
rates = []
for i in features:
    # 模型训练
    iforest = IsolationForest(n_estimators=100,
                              max_samples = 256,
                              contamination=0.02,
                              max_features=i,
                              random_state=1
                              )
    #fit_predict 函数 训练和预测一起 可以得到模型是否异常的判断,-1为异常,1为正常
    data['label'] = iforest.fit_predict(X)
    # 预测 decision_function 可以得出 异常评分
    data['scores'] = iforest.decision_function(X)
    # TopN准确率评估
    n = 1000
    df =  data.sort_values(by='scores',ascending=True)
    df = df.head(n)
    rate = df[df['Class']==1].shape[0]/n
    print('Top{}的准确率为:{}'.format(n,rate))
    rates.append(rate)

print(features)

print(rates)

import matplotlib.pyplot as plt
plt.plot(features,rates, linestyle='--', marker='.',color='c',markerfacecolor='red')
plt.title('max_features and TopN Acc')
plt.show()
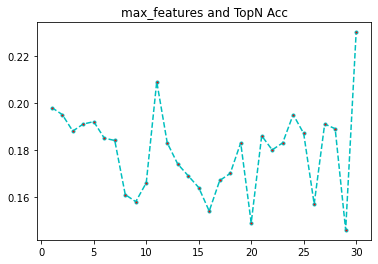
可以看到,特征最多的时候,准确率最高,但是理论上不大可能,我们研究随机森林的时候知道,特征最大的时候,模型的相关性很高,融合准确率反而低。那为什么会出现这种情况呢,我推测是每次抽取的样本数过少的原因,我们把样本数加大在看看。max_samples = 1200
features = list(range(1,X.shape[1]+1))
rates = []
for i in features:
    # 模型训练
    iforest = IsolationForest(n_estimators=100,
                              max_samples = 1200,
                              contamination=0.02,
                              max_features=i,
                              random_state=1
                              )
    #fit_predict 函数 训练和预测一起 可以得到模型是否异常的判断,-1为异常,1为正常
    data['label'] = iforest.fit_predict(X)
    # 预测 decision_function 可以得出 异常评分
    data['scores'] = iforest.decision_function(X)
    # TopN准确率评估
    n = 1000
    df =  data.sort_values(by='scores',ascending=True)
    df = df.head(n)
    rate = df[df['Class']==1].shape[0]/n
    print('Top{}的准确率为:{}'.format(n,rate))
    rates.append(rate)

print(features)
[1, 2, 3, 4, 5, 6, 7, 8, 9, 10, 11, 12, 13, 14, 15, 16, 17, 18, 19, 20, 21, 22, 23, 24, 25, 26, 27, 28, 29, 30]
print(rates)
[0.198, 0.195, 0.188, 0.191, 0.192, 0.185, 0.184, 0.161, 0.158, 0.166, 0.209, 0.183, 0.174, 0.169, 0.164, 0.154, 0.167, 0.17, 0.183, 0.149, 0.186, 0.18, 0.183, 0.195, 0.187, 0.157, 0.191, 0.189, 0.146, 0.23]
import matplotlib.pyplot as plt
plt.plot(features,rates, linestyle='--', marker='.',color='c',markerfacecolor='red')
plt.title('max_samples and TopN Acc')
plt.show()
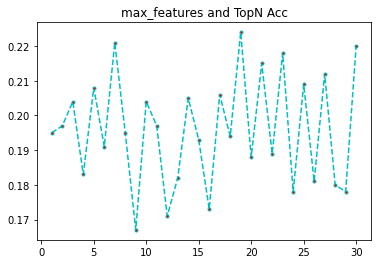
可以看到,样本数加大后,准确率和特征树就不会有这么极端的情况了,基本上在7左右能取到一个较好的值了。
证明我们的猜想是对的,大家可以继续加大样本量进行测试。
5、max_samples对准确率的影响
max_samples 这个是每次抽取样本的个数,默认256,相对于我们的28w样本,是杯水车薪,但是即使这样,也是有非常好的准确率了。
这个参数是最难测试的,需要涉及到几个数量级的波动,几百,几千,几万,十几万等,我们从小的开始进行测试,看看与默认值同一个数量级的情况下,准确率的变化。
samples = list(range(16,2066,16))
rates = []
for i in samples:
    # 模型训练
    iforest = IsolationForest(n_estimators=100,
                              max_samples= i,
                              contamination=0.02,
                              max_features=5,
                              random_state=1
                              )
    #fit_predict 函数 训练和预测一起 可以得到模型是否异常的判断,-1为异常,1为正常
    data['label'] = iforest.fit_predict(X)
    # 预测 decision_function 可以得出 异常评分
    data['scores'] = iforest.decision_function(X)
    # TopN准确率评估
    n = 1000
    df =  data.sort_values(by='scores',ascending=True)
    df = df.head(n)
    rate = df[df['Class']==1].shape[0]/n
    print('Top{}的准确率为:{}'.format(n,rate))
    rates.append(rate)

print(samples)
[16, 32, 48, 64, 80, 96, 112, 128, 144, 160, 176, 192, 208, 224, 240, 256, 272, 288, 304, 320, 336, 352, 368, 384, 400, 416, 432, 448, 464, 480, 496, 512, 528, 544, 560, 576, 592, 608, 624, 640, 656, 672, 688, 704, 720, 736, 752, 768, 784, 800, 816, 832, 848, 864, 880, 896, 912, 928, 944, 960, 976, 992, 1008, 1024, 1040, 1056, 1072, 1088, 1104, 1120, 1136, 1152, 1168, 1184, 1200, 1216, 1232, 1248, 1264, 1280, 1296, 1312, 1328, 1344, 1360, 1376, 1392, 1408, 1424, 1440, 1456, 1472, 1488, 1504, 1520, 1536, 1552, 1568, 1584, 1600, 1616, 1632, 1648, 1664, 1680, 1696, 1712, 1728, 1744, 1760, 1776, 1792, 1808, 1824, 1840, 1856, 1872, 1888, 1904, 1920, 1936, 1952, 1968, 1984, 2000, 2016, 2032, 2048, 2064]
print(rates)
[0.142, 0.115, 0.1, 0.127, 0.131, 0.164, 0.174, 0.18, 0.167, 0.169, 0.169, 0.171, 0.168, 0.179, 0.189, 0.192, 0.173, 0.177, 0.172, 0.167, 0.171, 0.17, 0.173, 0.185, 0.172, 0.174, 0.179, 0.165, 0.166, 0.183, 0.183, 0.165, 0.199, 0.201, 0.196, 0.191, 0.197, 0.19, 0.194, 0.198, 0.186, 0.187, 0.188, 0.186, 0.194, 0.185, 0.18, 0.187, 0.189, 0.202, 0.207, 0.206, 0.193, 0.189, 0.191, 0.193, 0.203, 0.207, 0.209, 0.207, 0.204, 0.202, 0.216, 0.219, 0.207, 0.221, 0.215, 0.209, 0.204, 0.216, 0.224, 0.215, 0.209, 0.212, 0.208, 0.224, 0.21, 0.232, 0.214, 0.229, 0.232, 0.23, 0.219, 0.211, 0.205, 0.206, 0.21, 0.202, 0.211, 0.213, 0.219, 0.205, 0.219, 0.232, 0.235, 0.238, 0.236, 0.23, 0.23, 0.223, 0.214, 0.224, 0.233, 0.231, 0.229, 0.234, 0.229, 0.232, 0.222, 0.226, 0.22, 0.226, 0.23, 0.229, 0.219, 0.23, 0.236, 0.238, 0.237, 0.23, 0.228, 0.229, 0.229, 0.224, 0.233, 0.232, 0.226, 0.228, 0.222]
import matplotlib.pyplot as plt
plt.plot(samples,rates, linestyle='--', marker='.',color='c',markerfacecolor='red')
plt.title('max_samples and TopN Acc')
plt.show()
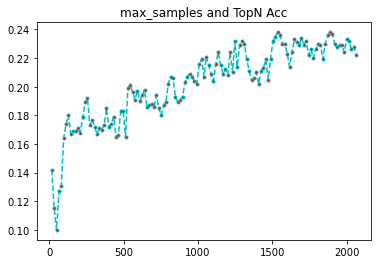
可以看到,在几百到几千的过程中,准确率缓步上升,最后到达一个瓶颈,开始下降。
samples = list(range(50,5000,100))
rates = []
for i in samples:
    # 模型训练
    iforest = IsolationForest(n_estimators=100,
                              max_samples = i,
                              contamination=0.02,
                              max_features=5,
                              random_state=1
                              )
    #fit_predict 函数 训练和预测一起 可以得到模型是否异常的判断,-1为异常,1为正常
    data['label'] = iforest.fit_predict(X)
    # 预测 decision_function 可以得出 异常评分
    data['scores'] = iforest.decision_function(X)
    # TopN准确率评估
    n = 1000
    df =  data.sort_values(by='scores',ascending=True)
    df = df.head(n)
    rate = df[df['Class']==1].shape[0]/n
    print('Top{}的准确率为:{}'.format(n,rate))
    rates.append(rate)

print(samples)
[50, 150, 250, 350, 450, 550, 650, 750, 850, 950, 1050, 1150, 1250, 1350, 1450, 1550, 1650, 1750, 1850, 1950, 2050, 2150, 2250, 2350, 2450, 2550, 2650, 2750, 2850, 2950, 3050, 3150, 3250, 3350, 3450, 3550, 3650, 3750, 3850, 3950, 4050, 4150, 4250, 4350, 4450, 4550, 4650, 4750, 4850, 4950]
print(rates)
[0.105, 0.174, 0.186, 0.175, 0.169, 0.195, 0.196, 0.186, 0.191, 0.212, 0.22, 0.212, 0.229, 0.202, 0.212, 0.233, 0.23, 0.225, 0.227, 0.231, 0.234, 0.217, 0.231, 0.234, 0.23, 0.213, 0.225, 0.209, 0.243, 0.233, 0.222, 0.221, 0.225, 0.234, 0.22, 0.229, 0.22, 0.217, 0.219, 0.221, 0.227, 0.212, 0.209, 0.214, 0.229, 0.226, 0.224, 0.215, 0.24, 0.236]
import matplotlib.pyplot as plt
plt.plot(samples,rates, linestyle='--', marker='.',color='c',markerfacecolor='red')
plt.title('max_samples and TopN Acc')
plt.show()
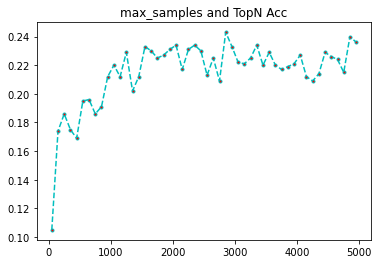
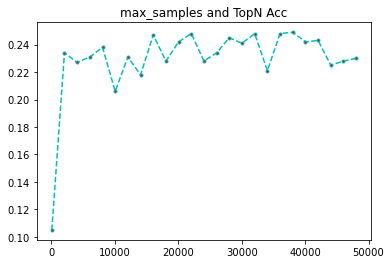
上图为2000提高到了5000,准确率还在稳定中,我们需要继续加大量级,下面的到了五万,可以看到也是能维持到23%左右。
继续加大,做到27w左右。
samples = list(range(50,270000,2000))
rates = []
for i in samples:
    # 模型训练
    iforest = IsolationForest(n_estimators=100,
                              max_samples = i,
                              contamination=0.02,
                              max_features=5,
                              random_state=1
                              )
    #fit_predict 函数 训练和预测一起 可以得到模型是否异常的判断,-1为异常,1为正常
    data['label'] = iforest.fit_predict(X)
    # 预测 decision_function 可以得出 异常评分
    data['scores'] = iforest.decision_function(X)
    # TopN准确率评估
    n = 1000
    df =  data.sort_values(by='scores',ascending=True)
    df = df.head(n)
    rate = df[df['Class']==1].shape[0]/n
    print('Top{}的准确率为:{}'.format(n,rate))
    rates.append(rate)

print(samples)
50, 2050, 4050, 6050, 8050, 10050, 12050, 14050, 16050, 18050, 20050, 22050, 24050, 26050, 28050, 30050, 32050, 34050, 36050, 38050, 40050, 42050, 44050, 46050, 48050, 50050, 52050, 54050, 56050, 58050, 60050, 62050, 64050, 66050, 68050, 70050, 72050, 74050, 76050, 78050, 80050, 82050, 84050, 86050, 88050, 90050, 92050, 94050, 96050, 98050, 100050, 102050, 104050, 106050, 108050, 110050, 112050, 114050, 116050, 118050, 120050, 122050, 124050, 126050, 128050, 130050, 132050, 134050, 136050, 138050, 140050, 142050, 144050, 146050, 148050, 150050, 152050, 154050, 156050, 158050, 160050, 162050, 164050, 166050, 168050, 170050, 172050, 174050, 176050, 178050, 180050, 182050, 184050, 186050, 188050, 190050, 192050, 194050, 196050, 198050, 200050, 202050, 204050, 206050, 208050, 210050, 212050, 214050, 216050, 218050, 220050, 222050, 224050, 226050, 228050, 230050, 232050, 234050, 236050, 238050, 240050, 242050, 244050, 246050, 248050, 250050, 252050, 254050, 256050, 258050, 260050, 262050, 264050, 266050, 268050]
print(rates)
[0.105, 0.234, 0.227, 0.231, 0.238, 0.206, 0.231, 0.218, 0.247, 0.228, 0.242, 0.248, 0.228, 0.234, 0.245, 0.241, 0.248, 0.221, 0.248, 0.249, 0.242, 0.243, 0.225, 0.228, 0.23, 0.233, 0.235, 0.248, 0.243, 0.247, 0.254, 0.251, 0.252, 0.236, 0.246, 0.233, 0.235, 0.223, 0.246, 0.244, 0.255, 0.251, 0.249, 0.254, 0.251, 0.257, 0.242, 0.261, 0.235, 0.243, 0.246, 0.246, 0.251, 0.26, 0.254, 0.247, 0.244, 0.253, 0.242, 0.237, 0.225, 0.237, 0.233, 0.235, 0.247, 0.245, 0.253, 0.247, 0.236, 0.241, 0.252, 0.239, 0.23, 0.239, 0.246, 0.236, 0.261, 0.254, 0.252, 0.257, 0.248, 0.234, 0.254, 0.254, 0.252, 0.24, 0.231, 0.238, 0.246, 0.254, 0.235, 0.244, 0.238, 0.243, 0.246, 0.255, 0.261, 0.243, 0.247, 0.252, 0.228, 0.232, 0.243, 0.236, 0.243, 0.247, 0.247, 0.243, 0.229, 0.243, 0.248, 0.23, 0.247, 0.254, 0.257, 0.255, 0.243, 0.245, 0.237, 0.252, 0.259, 0.247, 0.242, 0.249, 0.244, 0.243, 0.262, 0.267, 0.261, 0.244, 0.262, 0.248, 0.252, 0.241, 0.249]

import matplotlib.pyplot as plt
plt.plot(samples,rates, linestyle='--', marker='.',color='c',markerfacecolor='red')
plt.title('max_samples and TopN Acc')
plt.show()
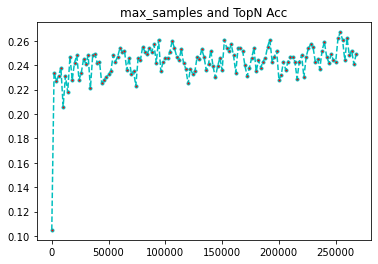
我们可以看到,数据量从3w-27w基本上能维持到25%以上的均值,可见,我们的样本量,还是要大,才能维持较高的准确率,默认值对于这个数据量过于小。
四、最佳模型
通过上面的,我们基本上能找到最优的模型了,当然,这个最优只是目前的探索,还有很多未探索的方法,还有很多的提升空间。
# 模型训练
iforest = IsolationForest(n_estimators=250,
                            max_samples = 125000,
                            contamination=0.05,
                            max_features=5,
                            random_state=1
                            )
#fit_predict 函数 训练和预测一起 可以得到模型是否异常的判断,-1为异常,1为正常
data['label'] = iforest.fit_predict(X)
# 预测 decision_function 可以得出 异常评分
data['scores'] = iforest.decision_function(X)
# TopN准确率评估
n = 1000
df =  data.sort_values(by='scores',ascending=True)
df = df.head(n)
rate = df[df['Class']==1].shape[0]/n
print('Top{}的准确率为:{}'.format(n,rate))
Top1000的准确率为:0.251

# 保存Top1000的数据
df.to_csv('df.csv',header=True,index=False)
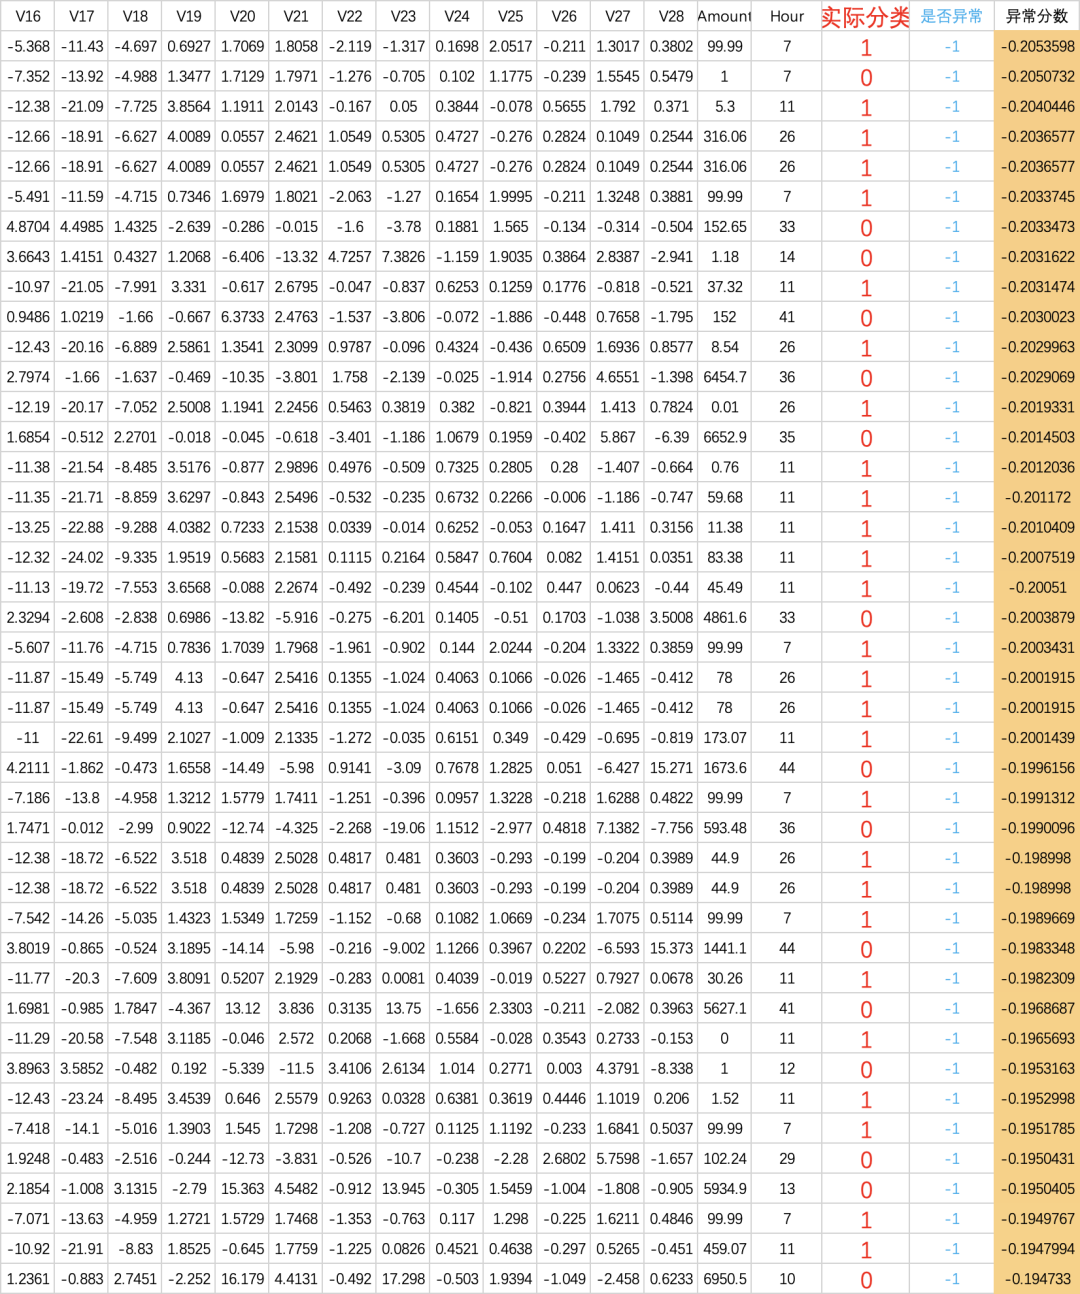
简单的测试下,我们的准确性,就从18%提高到了25%,还是非常大的提升的。我们看看最终的结果。异常检测的部分结果,从排名来看,还是非常准的,所以无监督的异常感知,还是大有可为。
五、模型可视化
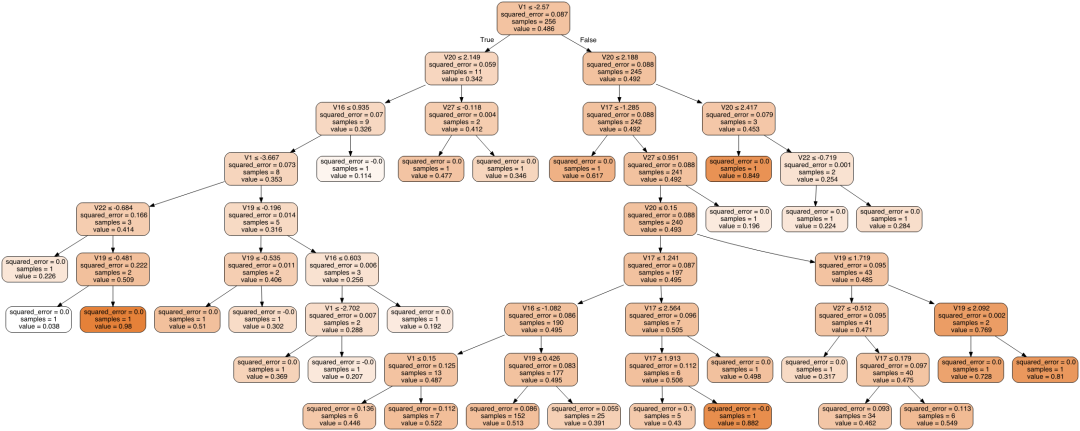
孤立森林作为树模型,基模型用的决策树,因此,也是可以可视化的,我们看看可视化的效果
# 模型训练
iforest = IsolationForest(n_estimators=120,
                            max_samples = 256,
                            contamination=0.05,
                            max_features=7,
                            random_state=1
                            )
#fit_predict 函数 训练和预测一起 可以得到模型是否异常的判断,-1为异常,1为正常
data['label'] = iforest.fit_predict(X)
# 预测 decision_function 可以得出 异常评分
data['scores'] = iforest.decision_function(X)
# TopN准确率评估
n = 1000
df =  data.sort_values(by='scores',ascending=True)
df = df.head(n)
rate = df[df['Class']==1].shape[0]/n
print('Top{}的准确率为:{}'.format(n,rate))


import os
path="/opt/homebrew/Cellar/graphviz/2.50.0/bin/"
os.environ["PATH"] += os.pathsep + path
os.environ['PATH']
from sklearn import tree
from dtreeviz.trees import dtreeviz
import graphviz

# 第 n 颗树可视化 dir(clf)
n = 2
clf = iforest.estimators_[n]
names = [X.columns[i] for i in iforest.estimators_features_[n]]


dot_data = tree.export_graphviz(clf, out_file=None,
                     feature_names=names,
                     filled=True,
                     rounded=True,
                     special_characters=True)
graph = graphviz.Source(dot_data)
graph
n = 2

n = 27

n = 80
n = 113

好了,今天就写到这里了,大家可以把这个数据拿去测试下自己玩玩。